Pythonのnba_apiを使ってNBAチームのパフォーマンスを分析し、可視化してみたので共有します。
1. なぜNBAのパフォーマンスを可視化するのか?
スポーツデータを視覚化すると、数字だけでは見えないトレンドや選手の貢献度が一目で分かります。NBAでは、選手ごとのスタッツ(得点、リバウンド、アシストなど)が豊富に提供されています。これを利用して、チーム全体のパフォーマンスや選手ごとの貢献度を数値化・可視化すると、新たな発見があるかもしれません。
2. 必要な環境とライブラリ
環境
- Python 3.8以降
必要なライブラリ
以下のライブラリをインストールしてください:
pip install nba_api pandas matplotlib seaborn
nba_api はNBAのデータを取得するためのライブラリです。公式APIを利用して、選手やチームの詳細なデータを取得できます。
3. スクリプト
以下は、選手ごとのパフォーマンスを集計し、チームへの貢献度を可視化するスクリプトです。また、チームのパフォーマンスの絶対値も出力します。
チームと選手データの取得
まず、nba_api を使って、選手ごとのスタッツとチームの総合スタッツを取得します。
import time
import seaborn as sns
import matplotlib.pyplot as plt
from nba_api.stats.endpoints import teamgamelog, playergamelog, commonteamroster
from nba_api.stats.static import teams
import pandas as pd

# NBAチームの貢献度計算スクリプト
def get_team_stats(team_abbreviation, season):
    # チーム情報の取得
    team_list = teams.get_teams()
    team = next((t for t in team_list if t['abbreviation'] == team_abbreviation), None)
    if not team:
        raise ValueError(f"Team with abbreviation {team_abbreviation} not found.")

    team_id = team['id']

    # チームのシーズンスタッツを取得
    print(f"Fetching team stats for {team_abbreviation}...")
    time.sleep(1)  # ディレイを追加
    team_game_log = teamgamelog.TeamGameLog(team_id=team_id, season=season)
    team_stats = pd.DataFrame(team_game_log.get_normalized_dict()['TeamGameLog'])

    # チームのトータルスタッツを計算
    team_stats_aggregated = team_stats[['PTS', 'REB', 'AST', 'STL', 'BLK', 'TOV']].astype(float).sum()
    return team_stats_aggregated

def get_player_stats(team_abbreviation, season):
    # チーム情報の取得
    team_list = teams.get_teams()
    team = next((t for t in team_list if t['abbreviation'] == team_abbreviation), None)
    if not team:
        raise ValueError(f"Team with abbreviation {team_abbreviation} not found.")

    team_id = team['id']

    # チームロスターの取得
    print(f"Fetching roster for {team_abbreviation}...")
    time.sleep(1)  # ディレイを追加
    roster = commonteamroster.CommonTeamRoster(team_id=team_id, season=season)
    players = pd.DataFrame(roster.get_normalized_dict()['CommonTeamRoster'])

    # 各選手のスタッツを取得
    player_stats = []
    for _, player in players.iterrows():
        player_id = player['PLAYER_ID']
        player_name = player['PLAYER']
        print(f"Fetching stats for {player_name}...")
        time.sleep(1)  # ディレイを追加
        player_log = playergamelog.PlayerGameLog(player_id=player_id, season=season)
        stats = pd.DataFrame(player_log.get_normalized_dict()['PlayerGameLog'])
        if not stats.empty:
            aggregated_stats = stats[['PTS', 'REB', 'AST', 'STL', 'BLK', 'TOV']].astype(float).sum()
            aggregated_stats['PLAYER_NAME'] = player_name
            player_stats.append(aggregated_stats)

    player_stats_df = pd.DataFrame(player_stats)
    return player_stats_df

def calculate_contribution(team_stats, player_stats):
    # チームスタッツに対する選手の貢献度を計算
    contribution = player_stats.copy()
    for stat in ['PTS', 'REB', 'AST', 'STL', 'BLK']:
        contribution[f'{stat}_CONTRIBUTION'] = player_stats[stat] / team_stats[stat] * 100

    # ターンオーバーの負の貢献度(減点)
    contribution['TOV_CONTRIBUTION'] = -(player_stats['TOV'] / team_stats['TOV'] * 100)

    # 総合的な貢献度
    contribution['TOTAL_CONTRIBUTION'] = contribution[
        ['PTS_CONTRIBUTION', 'REB_CONTRIBUTION', 'AST_CONTRIBUTION', 'STL_CONTRIBUTION', 'BLK_CONTRIBUTION', 'TOV_CONTRIBUTION']
    ].mean(axis=1)
    return contribution

def plot_contributions(contribution, team_name, season):
    plt.figure(figsize=(12, 6))
    sns.barplot(
        data=contribution,
        x='PLAYER_NAME',
        y='TOTAL_CONTRIBUTION',
        hue='PLAYER_NAME',  # hueをPLAYER_NAMEに設定
        dodge=False,        # 棒グラフの色を分けるだけで位置をずらさない
        legend=False        # 凡例を非表示にする
    )
    # タイトルにチーム名とシーズンを含める
    plt.title(f'{team_name} - {season} Player Contributions to Team Performance', fontsize=16)
    plt.xlabel('Player Name', fontsize=12)
    plt.ylabel('Total Contribution (%)', fontsize=12)
    plt.xticks(rotation=45, ha='right')
    plt.tight_layout()
    plt.show()

def get_team_name(team_abbreviation):
  team_list = teams.get_teams()
  team = next((t for t in team_list if t['abbreviation'] == team_abbreviation), None)
  if not team:
      raise ValueError(f"Team with abbreviation {team_abbreviation} not found.")
  return team['full_name']

def calculate_team_total_performance(player_stats):
    """
    各選手のスタッツを合計してチームの総合力を計算します。
    """
    # スタッツの合計を計算
    team_total_performance = player_stats[['PTS', 'REB', 'AST', 'STL', 'BLK']].sum().sum()
    # ターンオーバーは負の要素として引く
    team_total_performance -= player_stats['TOV'].sum()
    return team_total_performance

# メイン処理
team_abbreviation = 'LAL'  # チームの略称(例: LAL = Los Angeles Lakers)
season = '2022-23'         # シーズン(例: 2022-23)

team_stats = get_team_stats(team_abbreviation, season)
player_stats = get_player_stats(team_abbreviation, season)
contribution = calculate_contribution(team_stats, player_stats)
contribution = contribution.sort_values('TOTAL_CONTRIBUTION', ascending=False)

# チーム名を取得
team_name = get_team_name(team_abbreviation)

team_total_performance = calculate_team_total_performance(player_stats)
team_total_performance_per_game = team_total_performance / len(player_stats)
print(f"Team Total Performance: {team_total_performance:.0f}")
print(f"Team Total Performance Per Game: {team_total_performance_per_game:.0f}")

# グラフの描画
plot_contributions(contribution, team_name, season)
4. 可視化した結果と考察
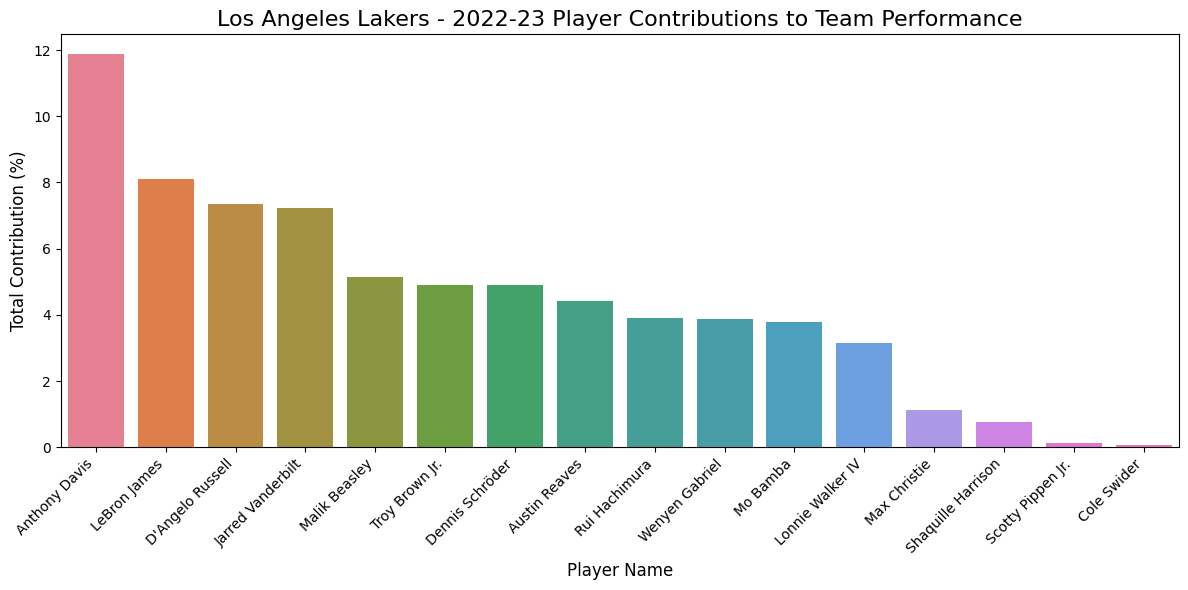
例えば、2022-23シーズンのLos Angeles Lakersで分析を行うと、以下のようなグラフが得られます。
Team Total Performance: 16287
Team Total Performance Per Game: 1018
選手ごとの貢献度が一目でわかりますね。特に得点やリバウンドが多い選手などがチームにどれだけ貢献しているか、ターンオーバーの影響がどうかなど、データから新たな視点が見えてくると思います。Scotty Pippen Jr. ってあのピッペンの息子?八村塁選手も主力として活躍していることがわかります。これからもがんばって欲しい。
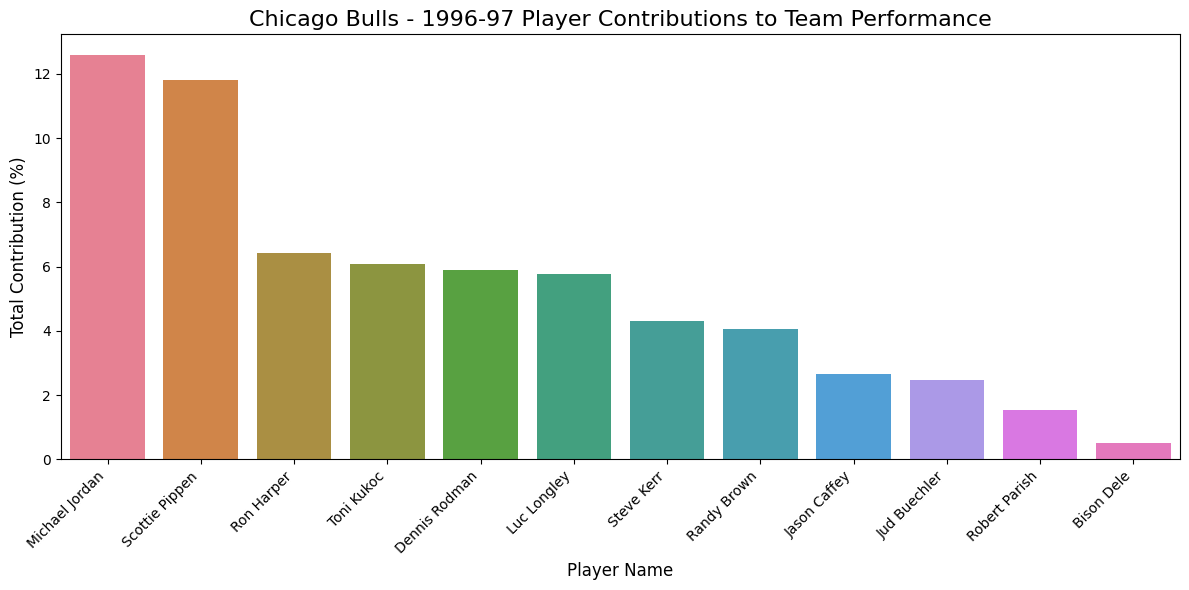
ついでに、シカゴ・ブルズ全盛期最後のシーズン(1996-97)も可視化してみました。観てたなぁ、この時代。
Team Total Performance: 13632
Team Total Performance Per Game: 1136
やっぱりジョーダンだぜって感じですね。スティーブ・カーはもっと活躍してたイメージがあったが、まあこんなものなのかも。ゲームごとのパフォーマンス点で言うと最近のレイカーズよりもブルズ黄金期の方が上だったようです。まあ印象通りといえば印象通り。シーズン全体のポイントが最近のほうが多いのは、試合数が増えたからか?過去のチームと比較するときは、試合ごとのパフォーマンスで比較したほうがよいですね。
5. 応用の可能性
このスクリプトを応用すると:
- チーム間の比較
- シーズンごとのトレンド分析
- 特定のスタッツ(例えばディフェンス)のみを評価した分析
など、様々な分析が可能だと思います。
最後に
NBAデータを可視化するだけで、バスケットボールの観戦や分析がさらに楽しくなります。自分がかつてみていた時代のデータを見返すと、伝説のプレイヤーがどれだけすごかったのかが改めて実感できました。このスクリプトをベースにもっといろんな視点で解析してみたいと思います。
記事が面白かったらコーヒー奢ってください!↓
https://buymeacoffee.com/takurot

