概要説明
衛星データを注文する際、GeojsonをアップロードしてAOIを指定している。Geojsonファイルの作成には都度、geojson.ioなどでポリゴンを描画してエクスポートしているがMapLibre GL JSを使ってWebGISアプリを自作してGeojsonファイルのエクスポートができないかやってみた。
使用したもの
MapLibre GL JS
Javascriptの地図ライブラリ。
Vite
発音は「ヴィット」。フロントエンドの開発環境をまとめてくれているツール群?のようなもの。
Maplibre GL Terra Draw
Maplibre用のライブラリ。Web地図上にポリゴンを描画するのに使う。
ソース
Javascript
Viteでプロジェクトを作成。フレームワークは「Vanilla」を選択した。
main.js
import { Map } from 'maplibre-gl';
import 'maplibre-gl/dist/maplibre-gl.css';
import { MaplibreTerradrawControl } from '@watergis/maplibre-gl-terradraw';
import '@watergis/maplibre-gl-terradraw/dist/maplibre-gl-terradraw.css';

const map = new Map({
  container: 'map',
  style: {
    version: 8,
    sources: {
      'osm-tiles': {
        type: 'raster',
        tiles: ['https://tile.openstreetmap.org/{z}/{x}/{y}.png'],
        tileSize: 256,
        attribution: '© OpenStreetMap contributors',
      },
    },
    layers: [
      {
        id: 'osm-tiles',
        type: 'raster',
        source: 'osm-tiles',
        minzoom: 0,
        maxzoom: 19,
      },
    ],
  },
  center: [139.767, 35.681], // 地図の中心座標 (東京)
  zoom: 10, // ズームレベル
});

// TerraDrawの初期化
const draw = new MaplibreTerradrawControl({
  modes: ['polygon', 'rectangle', 'select', 'delete-selection', 'delete'],
  open: true,
});
map.addControl(draw, 'top-left');

const drawInstance = draw.getTerraDrawInstance();

// GeoJSON情報を表示するためのHTML要素を取得
const geojsonInfoDiv = document.getElementById('geojson-info');
const downloadButton = document.getElementById('download-button');

// 描画完了イベントをリッスン
drawInstance.on('finish', () => {
  const snapshot = drawInstance.getSnapshot();
  const geojson = JSON.stringify(snapshot, null, 2); // フォーマットを整えるためにnull, 2を追加
  console.log('GeoJSON:', geojson);

  // GeoJSONを表示するためのHTML要素を更新
  geojsonInfoDiv.innerHTML = `<pre>${geojson}</pre>`; // <pre>タグを使用してフォーマットを保持

  // ダウンロードボタンのクリックイベントを設定
  downloadButton.onclick = () => {
    const blob = new Blob([geojson], { type: 'application/json' });
    const url = URL.createObjectURL(blob);
    const a = document.createElement('a');
    a.href = url;
    a.download = 'drawing.geojson';
    a.click();
    URL.revokeObjectURL(url);
  };
});
HTML
index.html
<!doctype html>
<html lang="en">
  <head>
    <meta charset="UTF-8" />
    <link rel="icon" type="image/svg+xml" href="/vite.svg" />
    <meta name="viewport" content="width=device-width, initial-scale=1.0" />
    <title>Vite App</title>
  </head>
  <body>
    <div id="app"></div>
    <script type="module" src="/src/main.js"></script>
  </body>
</html>
<!DOCTYPE html>
<html lang="ja">
  <head>
    <meta charset="UTF-8" />
    <link rel="icon" type="image/svg+xml" href="/vite.svg" />
    <meta name="viewport" content="width=device-width, initial-scale=1.0" />
    <title>Terra Draw demo</title>
    <style>
      body {
        display: flex;
        margin: 0;
        position: relative;
      }
      #map {
        flex: 1;
        height: 100vh;
      }
      #geojson-info {
        width: 300px;
        height: 100vh;
        overflow: auto;
        background-color: white;
        padding: 10px;
        border-left: 1px solid black;
      }
      #download-button {
        position: absolute;
        bottom: 10px;
        right: 10px;
        padding: 10px;
        background-color: #4CAF50;
        color: white;
        border: none;
        cursor: pointer;
      }
    </style>
  </head>
  <body>
    <div id="map"></div>
    <div id="geojson-info">
      GeoJSON情報がここに表示されます。
    </div>
    <button id="download-button">GeoJSONをダウンロード</button>
    <script type="module" src="/main.js"></script>
  </body>
</html>
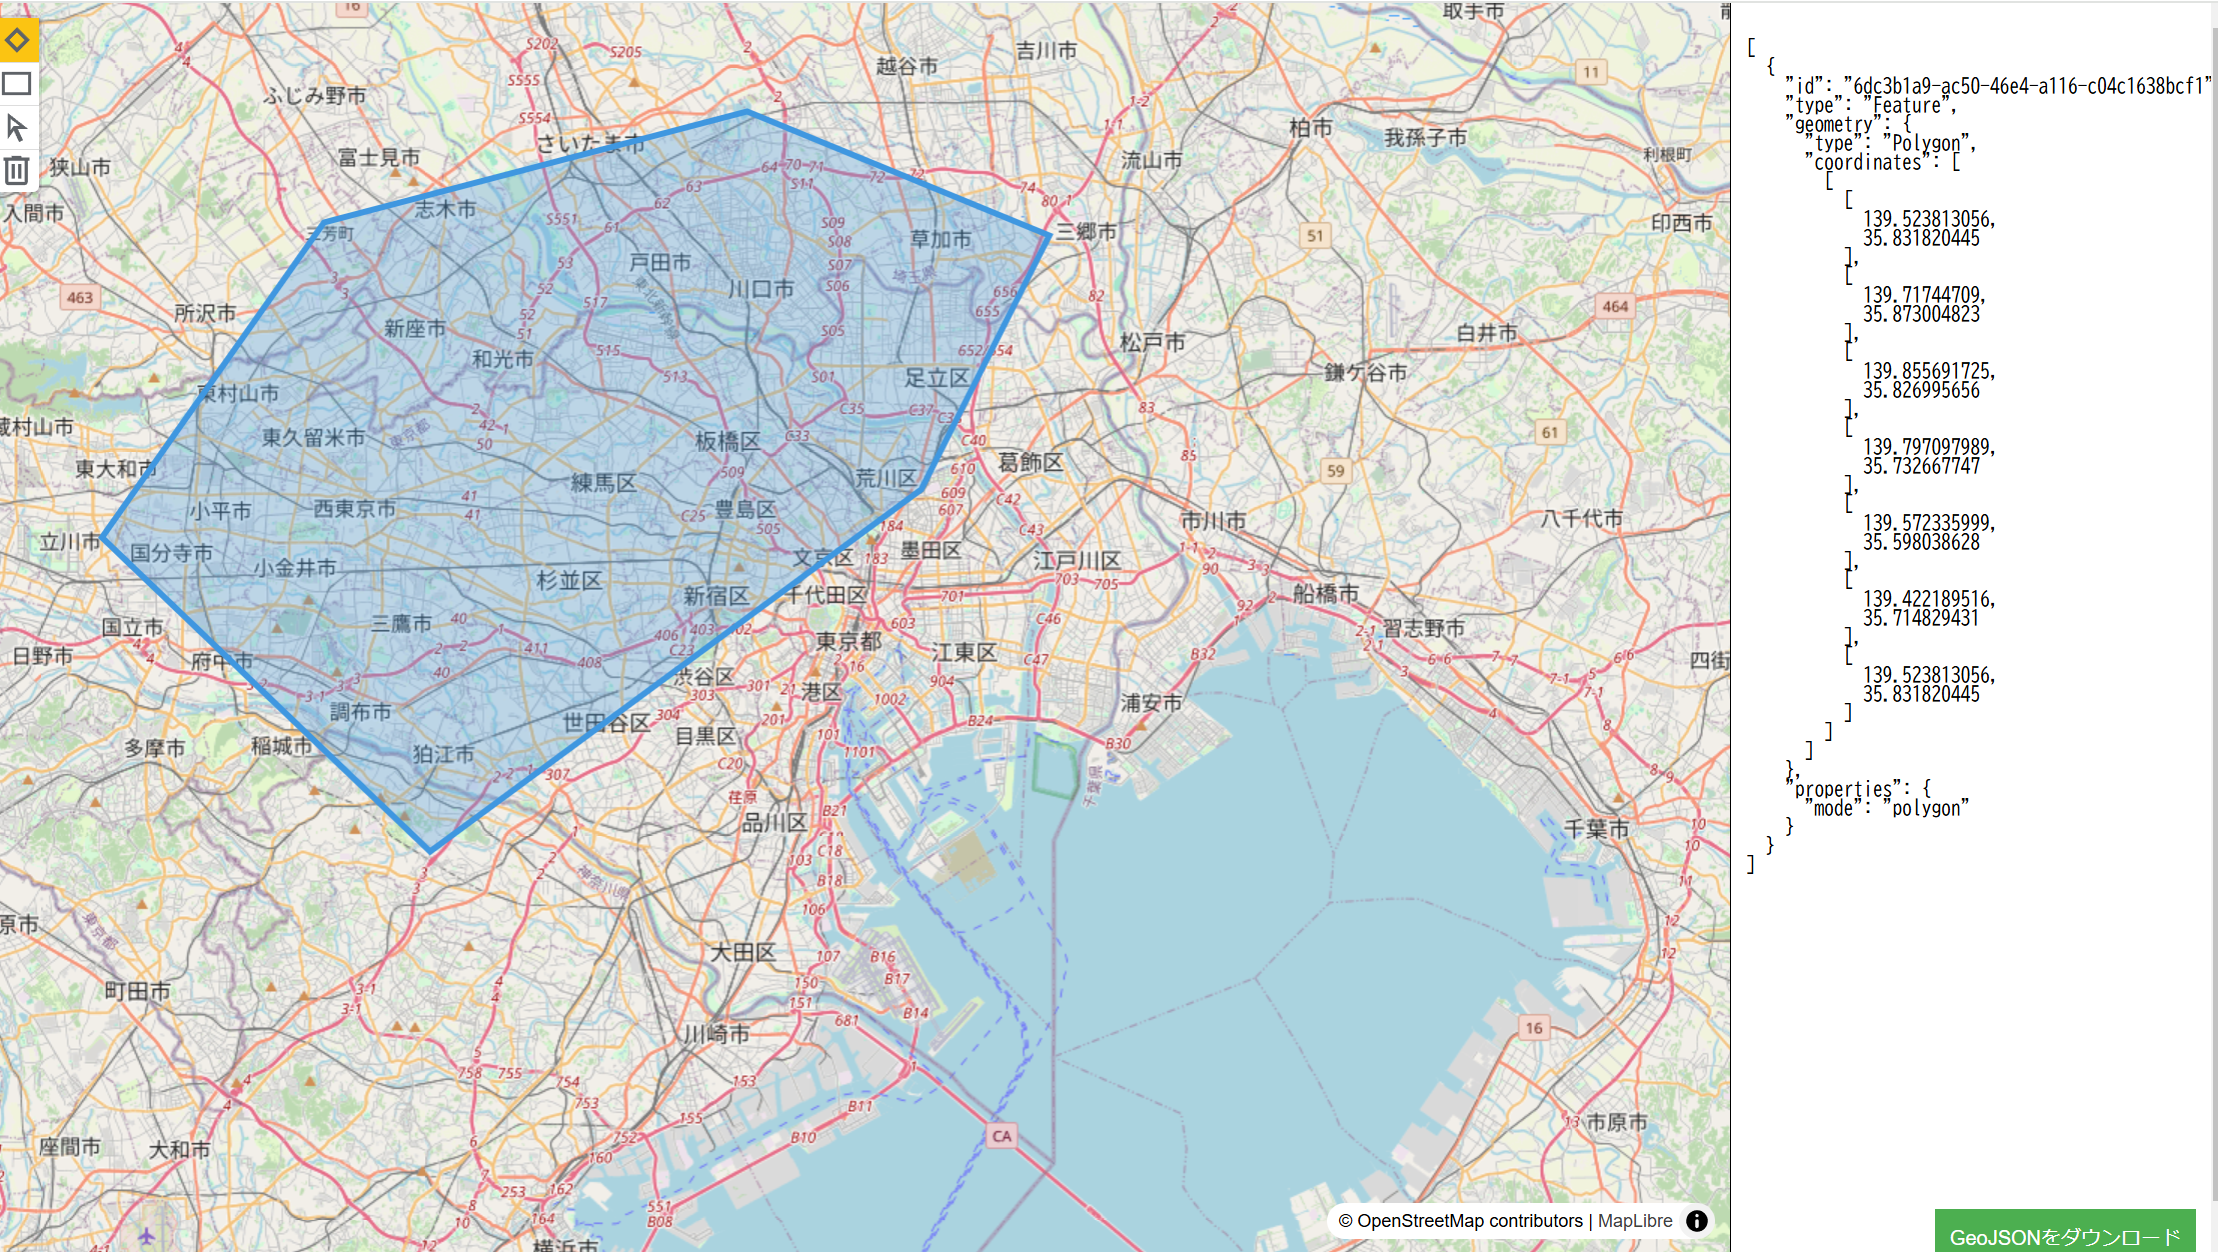
出力画面
Map上にポリゴンを書いて、Geojsonフォーマットにして出力する
ソースの詳細
ベースマップにOpenStreetMapを使用
main.js
const map = new Map({
  container: 'map',
  style: {
    version: 8,
    sources: {
      'osm-tiles': {
        type: 'raster',
        tiles: ['https://tile.openstreetmap.org/{z}/{x}/{y}.png'],
        tileSize: 256,
        attribution: '© OpenStreetMap contributors',
      },
    },
    layers: [
      {
        id: 'osm-tiles',
        type: 'raster',
        source: 'osm-tiles',
        minzoom: 0,
        maxzoom: 19,
      },
    ],
  },
地図上にポリゴンを描画するTerra Drawをインスタンス化
ポリゴンの描画方法として今回は「'polygon','rectangle'」をつかっているが他にも
「'circle','freehand','angled-rectangle','sensor」などがある
main.js
const draw = new MaplibreTerradrawControl({
  modes: ['polygon', 'rectangle', 'select', 'delete-selection', 'delete'],
ポリゴンの描画イベントが完了したらdrawInstance.getSnapshot()で描画した座標データを取得。最後にGeojsonのフォーマットを整える。
main.js
drawInstance.on('finish', () => {
  const snapshot = drawInstance.getSnapshot();
  const geojson = JSON.stringify(snapshot, null, 2);
最後に
このアプリで出力したGeojsonを衛星データ取得のWebサイトにアップロードすることでAOIとしているエリアのデータを見つけ出すことができる。
最近ではAPI経由で衛星の撮影をタスキングできるサービスも増えているのでそこでの連携にも応用できそう