【内容】
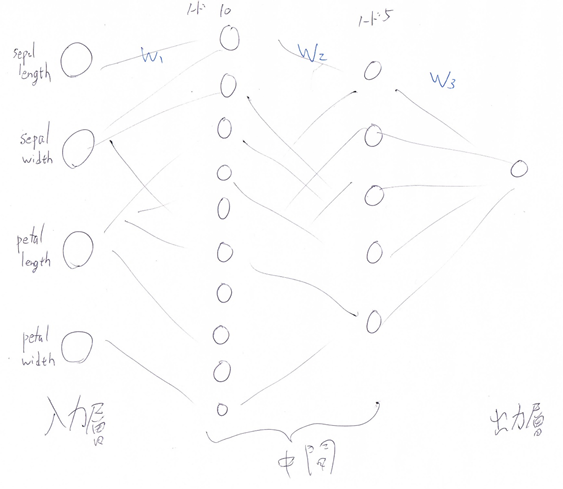
irisデータセットを使って、DNNを構築する。
タスクは回帰。
モデルは、中間層1層目10ノード、2層目5ノード
誤差関数は、最小二乗誤差。
【ソースコード】
講義中に使った、function.pyをインポートしている。
iris-dnn.py
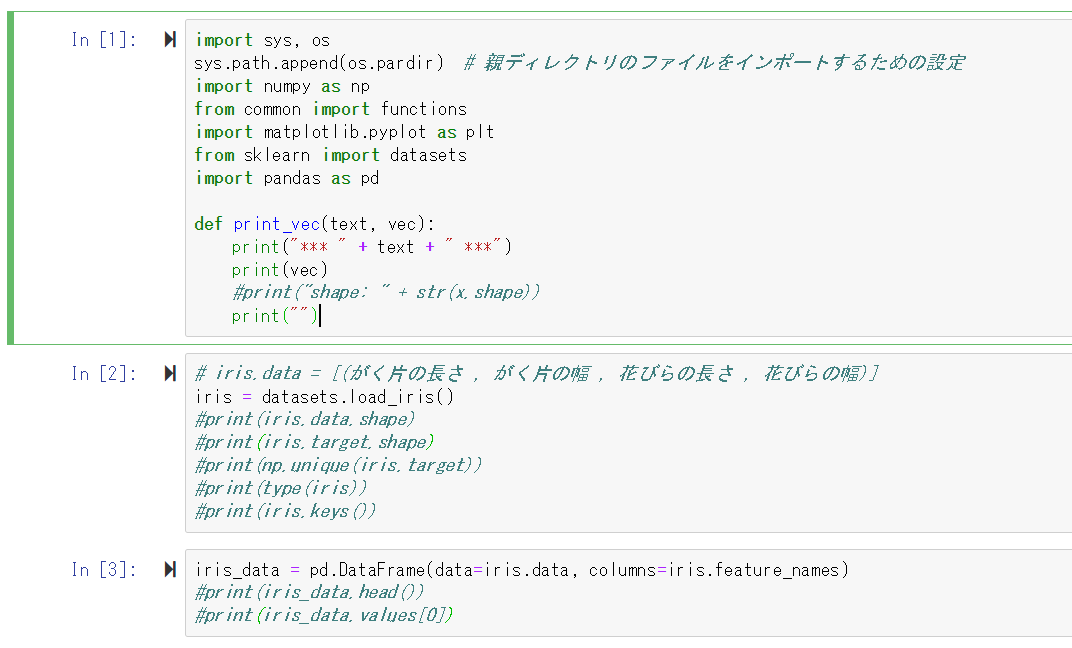
import sys, os
sys.path.append(os.pardir)  # 親ディレクトリのファイルをインポートするための設定
import numpy as np
from common import functions
import matplotlib.pyplot as plt
from sklearn import datasets
import pandas as pd

def print_vec(text, vec):
    print("*** " + text + " ***")
    print(vec)
    #print("shape: " + str(x.shape))
    print("")

# iris.data = [(がく片の長さ , がく片の幅 , 花びらの長さ , 花びらの幅)]
iris = datasets.load_iris()
# print(iris.data.shape)
# print(iris.target.shape)
# print(np.unique(iris.target))
# print(type(iris))
# print(iris.keys())

iris_data = pd.DataFrame(data=iris.data, columns=iris.feature_names)
# print(iris_data.head())
# print(iris_data.values[0])

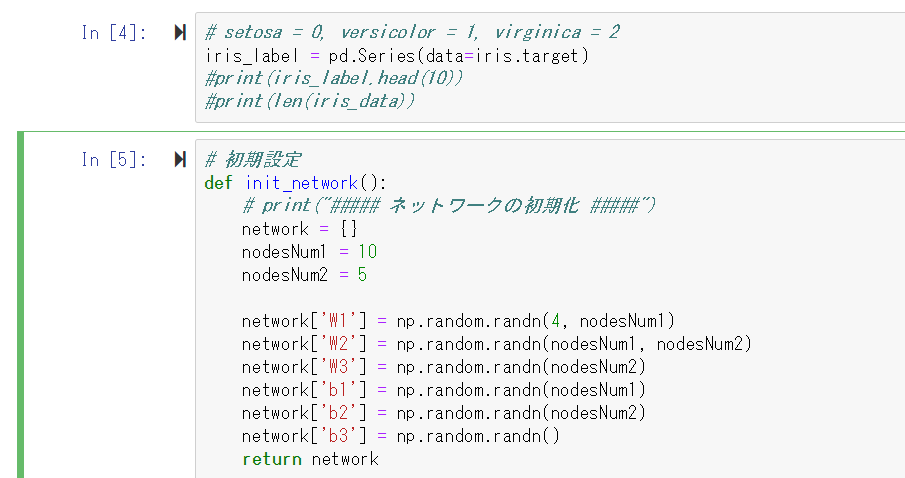
# setosa = 0, versicolor = 1, virginica = 2
iris_label = pd.Series(data=iris.target)
# print(iris_label.head(10))
# print(len(iris_data))

# 初期設定
def init_network():
    # print("##### ネットワークの初期化 #####")
    network = {}
    nodesNum1 = 10
    nodesNum2 = 5

    network['W1'] = np.random.randn(4, nodesNum1)
    network['W2'] = np.random.randn(nodesNum1, nodesNum2)
    network['W3'] = np.random.randn(nodesNum2)
    network['b1'] = np.random.randn(nodesNum1)
    network['b2'] = np.random.randn(nodesNum2)
    network['b3'] = np.random.randn()
    return network

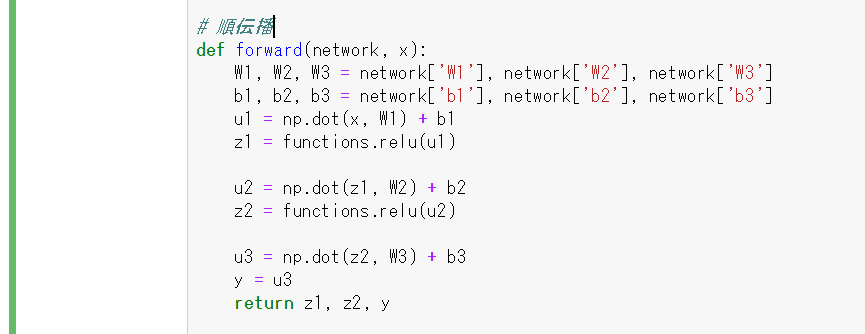
# 順伝播
def forward(network, x):
    W1, W2, W3 = network['W1'], network['W2'], network['W3']
    b1, b2, b3 = network['b1'], network['b2'], network['b3']
    u1 = np.dot(x, W1) + b1
    z1 = functions.relu(u1)

    u2 = np.dot(z1, W2) + b2
    z2 = functions.relu(u2)

    u3 = np.dot(z2, W3) + b3
    y = u3
    return z1, z2, y

# 誤差逆伝播
def backward(x, d, z1, z2, y):
    grad = {}

    W1, W2, W3 = network['W1'], network['W2'], network['W3']
    b1, b2, b3 = network['b1'], network['b2'], network['b3']

    # 出力層でのデルタ
    delta3 = functions.d_mean_squared_error(d, y)
    # b3の勾配
    grad['b3'] = np.sum(delta3, axis=0)
    # W3の勾配
    grad['W3'] = np.dot(z2.T, delta3)
    # 2層でのデルタ
    delta2 = np.dot(delta3, W3.T) * functions.d_relu(z2)
    delta2 = delta2[np.newaxis, :]

    # b2の勾配
    grad['b2'] = np.sum(delta2, axis=0)
    # W2の勾配
    z1 = z1[np.newaxis, :]
    grad['W2'] = np.dot(z1.T, delta2)
    # 1層でのデルタ
    delta1 = np.dot(delta2, W2.T) * functions.d_relu(z1)

    delta1 = delta1[np.newaxis, :]
    # b1の勾配
    grad['b1'] = np.sum(delta1, axis=0)
    grad['b1'] = np.reshape(grad['b1'], (10,))

    x = x[np.newaxis, :]
    # W1の勾配
    grad['W1'] = np.dot(x.T, delta1)
    grad['W1'] = np.reshape(grad['W1'], (4,10))
    return grad

losses = []
# 学習率
learning_rate = 0.01

# 抽出数
epoch = 150

# パラメータの初期化
network = init_network()

# 勾配降下の繰り返し
for i in range(len(iris_data)):
    x = iris_data.values[i]
    d = iris_label[i]
    z1, z2, y = forward(network, x)
    grad = backward(x, d, z1, z2, y)
    # パラメータに勾配適用

    #network['W1'] -= learning_rate * grad['W1']
    #network['W2'] -= learning_rate * grad['W2']
    #network['W3'] -= learning_rate * grad['W3']
    #network['b1'] -= learning_rate * grad['b1']
    #network['b2'] -= learning_rate * grad['b2']
    #network['b3'] -= learning_rate * grad['b3']

    for key in ('W1', 'W2', 'W3', 'b1', 'b2', 'b3'):
        network[key]  -= learning_rate * grad[key]


    # 誤差
    loss = functions.mean_squared_error(d, y)
    losses.append(loss)

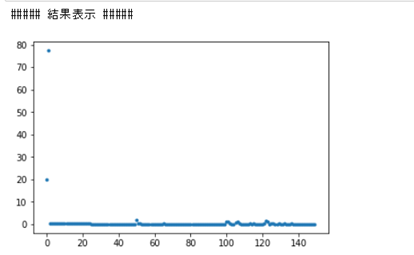
print("##### 結果表示 #####")
lists = range(epoch)

plt.plot(lists, losses, '.')
# グラフの表示
plt.show()
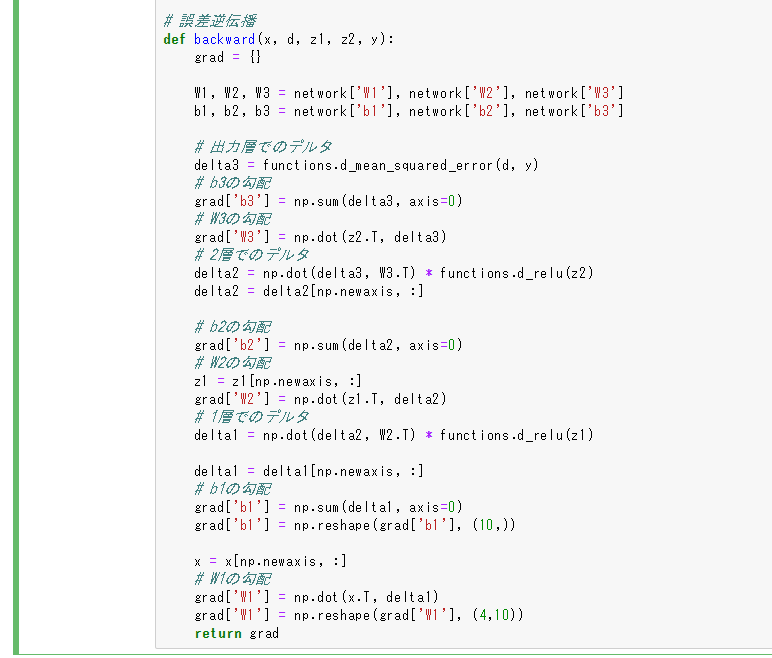
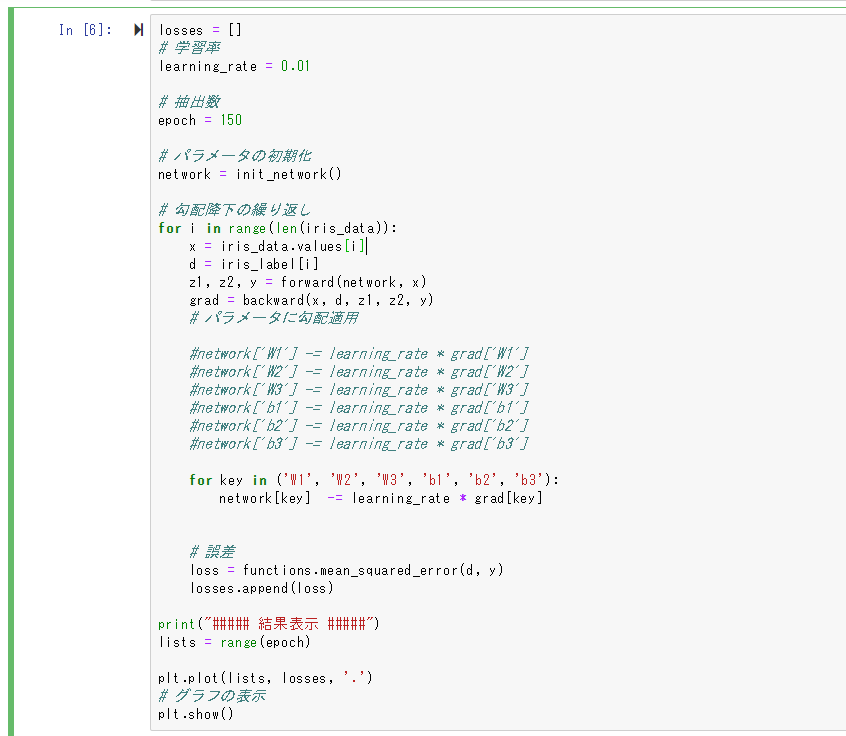
Jupter notebookのソースコード画像
【終了課題についての確認(5分)】
Q1. 課題の目的とは? どのような工夫が出来そうか
→irisが持っている4つの特徴から、どの品種(全部で3種類)かを分類する目的。
サンプルデータ数が150と少ないので、学習率が小さく上手く学習が出来ない場合は、交差検証法などで、データの水増しをすると上手く行く可能性がありそう。
Q2. 課題を分類タスクで解く場合の意味は何か
→出力が0, 1, 2のいずれか(離散的)なので、各値を各グループと考える事が出来、分類タスクとして解く意味がある。
Q3. irisデータとは何か2行で述べよ
→アヤメ(花)の特徴(ガクの長さ、幅など)と、それに対する品種(3種類)が、1つのデータとして割り当てられたデータセット。全部で150サンプルある。
