LoginSignup
1
1

More than 5 years have passed since last update.

エントロピーの近似計算(MLSベイズ図2.1)

Posted at

目的

  • 機械学習スタートアップシリーズ「ベイズ推論による機械学習入門」の図をJuliaで再現する
  • 今回の対象: 図2.1 サンプリングによるエントロピーの近似

ベルヌーイ分布の用意

  • 作図はPlots.jlでバックエンドはGR
  • Distributions.jlから利用する
  • エントロピーの真値もDistributions.jlが計算してくれる
using Distributions
using Plots
gr()

μ = 1.0 / 3.0
dist = Bernoulli(μ)
H = entropy(dist)
println(H)
# => 0.6365141682948128  # エントロピーの真値

サンプリングによる近似

  • 表の出た回数$p$と裏の出た回数$N-p$と、パラメータ$\mu$と$1-\mu$を利用して、$N$回試行したときの近似値を求める
  • 今回はまとめて試行して計算している
# approx. by sampling
num_trials = 5     # 試行数
num_samples = 500  # サンプル数
results = zeros(num_trials, num_samples)  # 近似結果を格納

for t in 1:num_trials
    seqt = rand(dist, num_samples)
    for j in 1:num_samples
        pj = sum(seqt[1:j])
        nj = j - pj
        termp =  pj > 0 ? pj * log(μ) : 0
        termn =  nj > 0 ? nj * log(1 - μ) : 0  
        ej = - (termp + termn) / j
        results[t, j] = ej
    end
end

# 結果をプロットする
plot()
plot!([0, 500], [H, H], line=(0.5, :dash), color=:black, label="entropy")
for t in 1:num_trials
    plot!(results[t, :], xlim=(0, 500), ylim=(0.35, 1.0))
end
plot!()
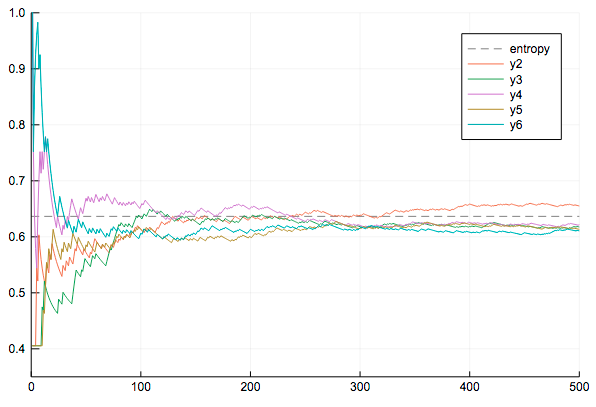
entropy.png

1
1
0

Register as a new user and use Qiita more conveniently

  1. You get articles that match your needs
  2. You can efficiently read back useful information
  3. You can use dark theme
What you can do with signing up
1
1