必要なもの
- エディタ
- VSCode
- VSCodeプラグイン
環境構築
DockerでPlantUMLが動く環境を構築する。
PlantUML Serverを起動
docker run -d --name plantuml_server -p 8080:8080 plantuml/plantuml-server:jetty
VSCodeの設定
プラグインのPlantUMLにカーソルを合わせて右クリック→Extension Settings。
| 設定項目 | 値 |
|---|---|
| Plantuml: Render | PlantUMLServer |
| Plantuml: Server | http://localhost:8080 |


単一テーブルを作成する
@startuml ""

Class "order:注文" as order <<T,FFAA00)>> {
  + order_id: 注文ID [PK]
  ---
  order_date: 注文日
  product_code: 商品コード [FK]
  customer_code: 顧客コード [FK]
  quantity: 数量
  created_at: 作成日
  updated_at: 更新日
}

@enduml
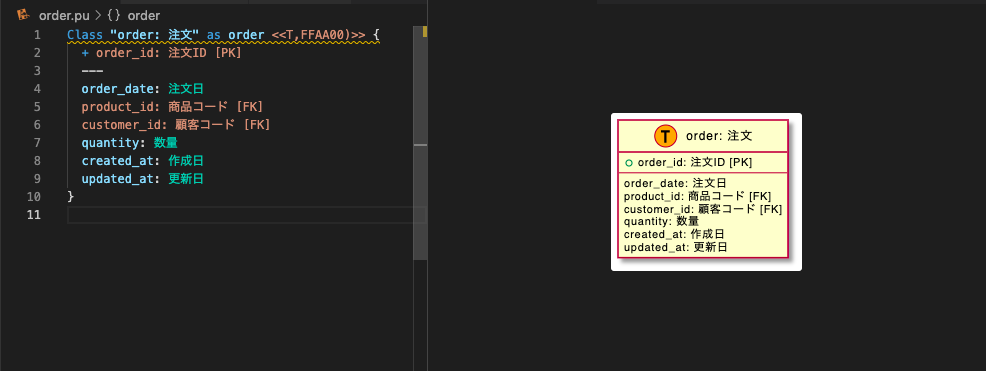
プレビューはMacだと「オプション + D」で開きます。
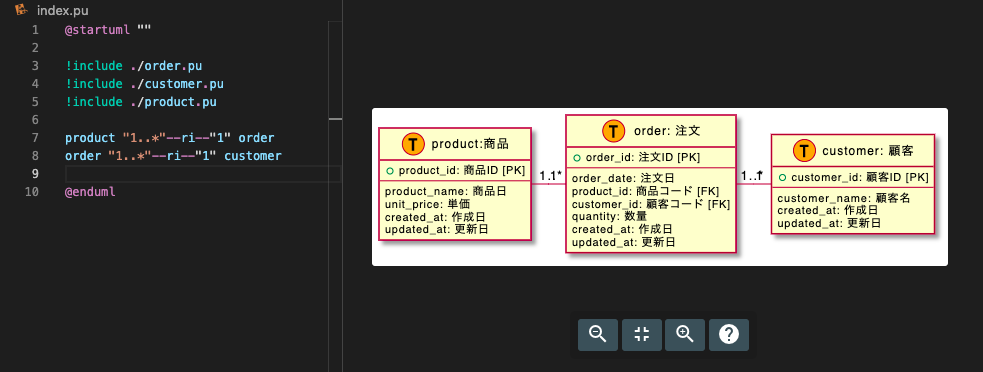
複数テーブルを作成してリレーションを引いてみる
@startuml ""

!include ./order.pu
!include ./customer.pu
!include ./product.pu

product "1..*"--ri--"1" order
order "1..*"--ri--"1" customer

@enduml
レイアウトの方向
| 方向 | キーワード |
|---|---|
| 上 | up |
| 下 | do |
| 左 | le |
| 右 | ri |