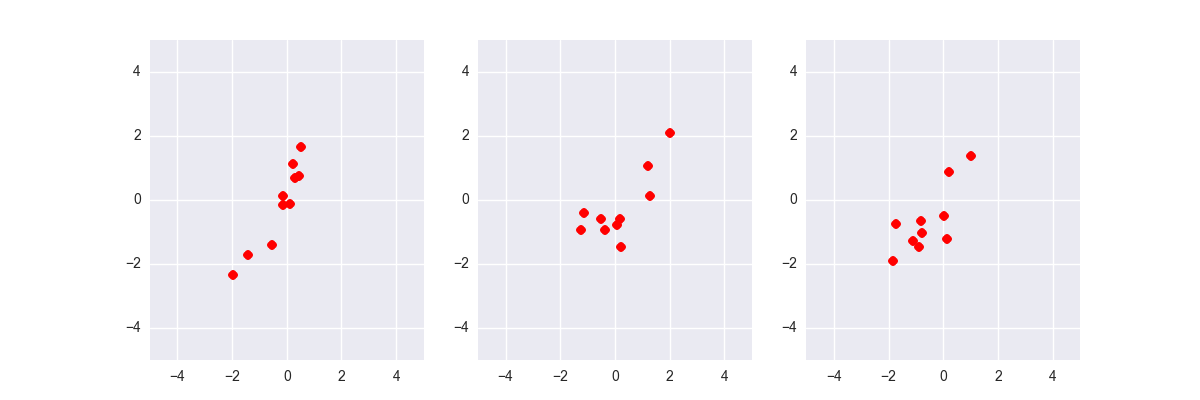
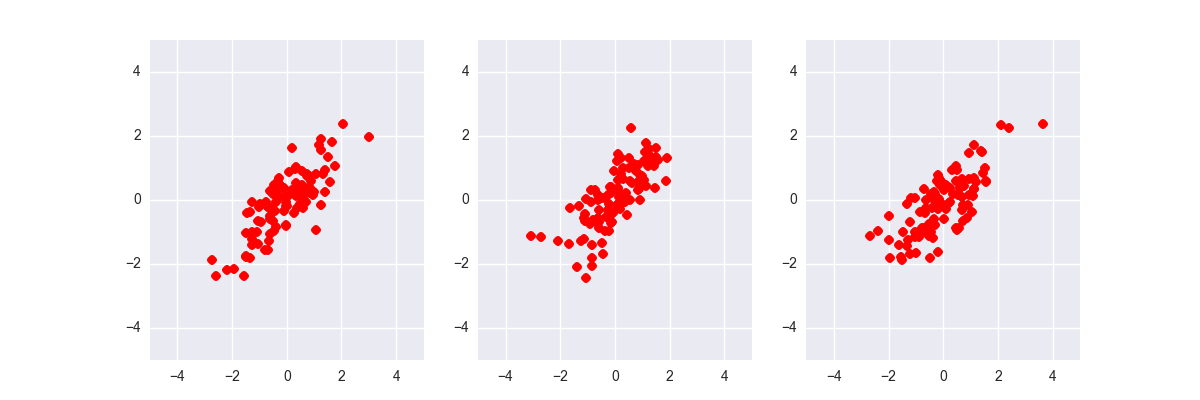
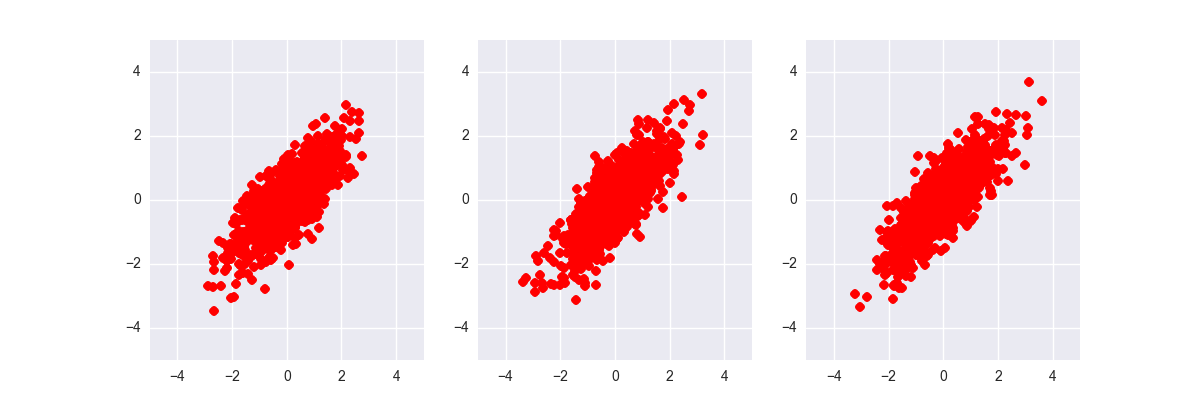
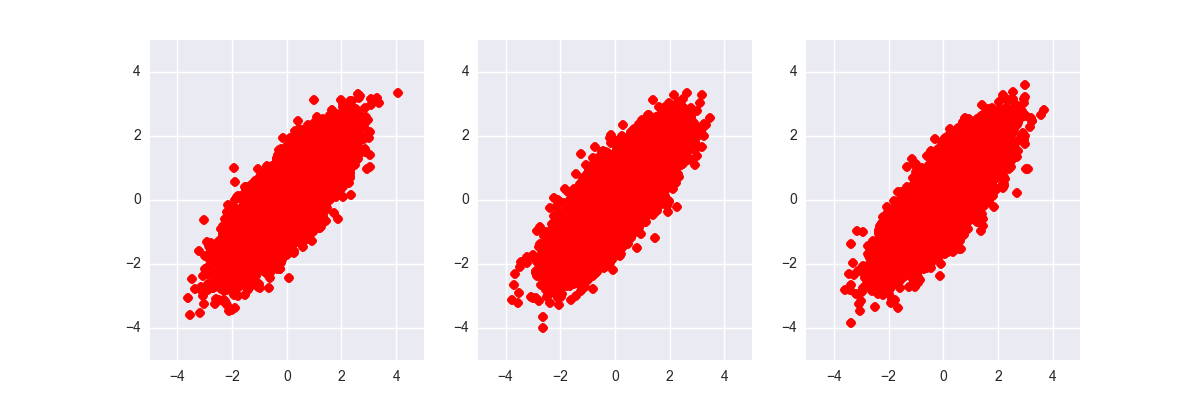
機械学習プロフェッショナルシリーズの「統計的因果探索」を読んでいて出てきた擬似相関の数値例を再現する部分をPythonでやります(本の1.3章 図1.4あたり)。見かけ上の相関関係からは、背景のデータ生成モデルを理解できない場合があるという例。
- モデル共通
- zが平均0、分散1の正規分布に従う
- $e_x$と$e_y$は和に使った後の変数$x, y$が分散1になるようなノイズ(平均は0)
- モデル1
- $x = 0.3z + e_x$
- $y = 0.7x + 0.3z + e_y$
- モデル2
- $x = 0.7y + 0.3z + e_x$
- $y = 0.3z + e_y$
- モデル3
- $x = 0.89z + e_x$
- $y = 0.89z + e_y$
# -*- coding: utf-8 -*-
import numpy as np
import seaborn as sns
import matplotlib.pyplot as plt


def gendata(N=100, verbose=False):
    # Model 1
    z1 = np.random.normal(0.0, 1.0, N)
    ex1 = np.random.normal(0.0, np.sqrt(1-0.3**2), N)
    ey1 = np.random.normal(0.0, np.sqrt(1-0.7**2-0.3**), N)
    x1 = 0.3 * z1 + ex1
    y1 = 0.7 * x1 + 0.3 * z1 + ey1

    if verbose:
        print("model 1")
        print(np.std(x1))
        print(np.std(y1))

    # Model 2
    z2 = np.random.normal(0.0, 1.0, N)
    ex2 = np.random.normal(0.0, np.sqrt(1-0.7**2-0.3**), N)
    ey2 = np.random.normal(0.0, np.sqrt(1-0.3**2), N)
    y2 = 0.3 * z2 + ey2
    x2 = 0.7 * y2 + 0.3 * z2 + ex2

    if verbose:
        print("model 2")
        print(np.std(x2))
        print(np.std(y2))

    # Model 3
    z3 = np.random.normal(0.0, 1.0, N)
    ex3 = np.random.normal(0.0, np.sqrt(1.0-0.89**2), N)
    ey3 = np.random.normal(0.0, np.sqrt(1.0-0.89**2), N)
    x3 = 0.89 * z3 + ex3
    y3 = 0.89 * z3 + ey3

    if verbose:
        print("model 3")
        print(np.std(x3))
        print(np.std(y3))

    return x1, y1, x2, y2, x3, y3

if __name__ == '__main__':
    for n in [10, 100, 1000, 10000]:
        x1, y1, x2, y2, x3, y3 = gendata(n)
        plt.figure(figsize=(12, 4))
        plt.subplot(1, 3, 1)
        plt.xlim(-5, 5)
        plt.ylim(-5, 5)
        plt.plot(x1, y1, "ro")
        plt.subplot(1, 3, 2)
        plt.xlim(-5, 5)
        plt.ylim(-5, 5)
        plt.plot(x2, y2, "ro")
        plt.subplot(1, 3, 3)
        plt.xlim(-5, 5)
        plt.ylim(-5, 5)
        plt.plot(x3, y3, "ro")
        plt.savefig("N{}.png".format(n))