Example 1
size = 512
index = np.random.randint(len(train_data_hd))
print (train_data_hd[index])
img = cv2.imread(train_data_hd[index])
print (img.shape)
img = cv2.resize(img, (size, size))
print (img.shape)
img2 = img[150:350, 150:350]
img2 = cv2.resize(img2, (size, size))
fig = plt.figure(figsize = (10, 3))
ax1 = fig.add_subplot(1, 3, 1)
ax1.imshow(img)
ax1.set_xticks([])
ax1.set_yticks([])
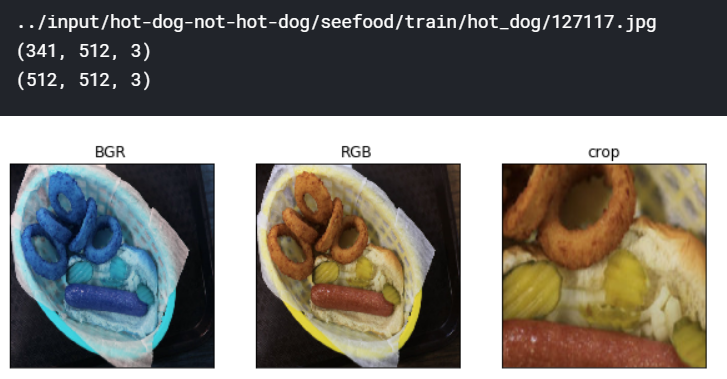
ax1.set_title('BGR')
ax2 = fig.add_subplot(1, 3, 2)
ax2.imshow(cv2.cvtColor(img, cv2.COLOR_BGR2RGB))
ax2.set_xticks([])
ax2.set_yticks([])
ax2.set_title('RGB')
ax2 = fig.add_subplot(1, 3, 3)
ax2.imshow(cv2.cvtColor(img2, cv2.COLOR_BGR2RGB))
ax2.set_xticks([])
ax2.set_yticks([])
ax2.set_title('crop')
plt.show()
Exapmle 2
size = 512
index = np.random.randint(len(train_data_hd))
print (train_data_hd[index])
img = cv2.imread(train_data_hd[index])
print (img.shape)
img = cv2.resize(img, (size, size))
print (img.shape)
img2 = np.copy(img)
img2[:, :, 0] = 0
img2[:, :, 1] = 0
hsv = cv2.cvtColor(img, cv2.COLOR_BGR2HSV_FULL)
h = hsv[:, :, 0]
s = hsv[:, :, 1]
v = hsv[:, :, 2]
img3 = np.zeros(h.shape, dtype=np.uint8)
#img3[((h<50)|(h>200)) & (s>100)] = 255
img3[((h<10)|(h>170)) & (s>150)] = 255
fig = plt.figure(figsize = (10, 3))
ax1 = fig.add_subplot(1, 3, 1)
ax1.imshow(cv2.cvtColor(img, cv2.COLOR_BGR2RGB))
ax1.set_xticks([])
ax1.set_yticks([])
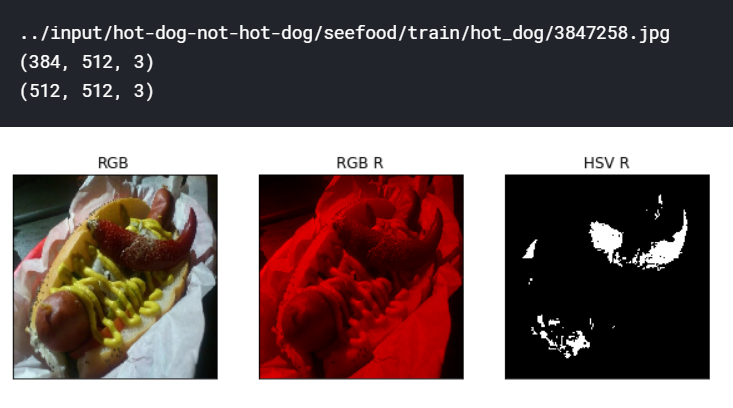
ax1.set_title('RGB')
ax2 = fig.add_subplot(1, 3, 2)
ax2.imshow(cv2.cvtColor(img2, cv2.COLOR_BGR2RGB))
ax2.set_xticks([])
ax2.set_yticks([])
ax2.set_title('RGB R')
ax3 = fig.add_subplot(1, 3, 3)
ax3.imshow(img3, cmap='gray')
ax3.set_xticks([])
ax3.set_yticks([])
ax3.set_title('HSV R')
plt.show()
Example 3
size = 512
index = np.random.randint(len(train_data_hd))
print (train_data_hd[index])
img = cv2.imread(train_data_hd[index])
print (img.shape)
img = cv2.resize(img, (size, size))
print (img.shape)
hsv = cv2.cvtColor(img, cv2.COLOR_BGR2HSV_FULL)
# define range of color in HSV
lower_blue = np.array([110, 200, 0])
upper_blue = np.array([130, 255, 255])
lower_green = np.array([40, 100, 0])
upper_green = np.array([80, 255, 255])
lower_white = np.array([0, 0, 0])
upper_white = np.array([180, 80, 255])
# Threshold the HSV image to get only blue colors
mask_blue = cv2.inRange(hsv, lower_blue, upper_blue)
mask_green = cv2.inRange(hsv, lower_green, upper_green)
mask_white = cv2.inRange(hsv, lower_white, upper_white)
fig = plt.figure(figsize = (10, 3))
ax1 = fig.add_subplot(1, 3, 1)
ax1.imshow(cv2.cvtColor(img, cv2.COLOR_BGR2RGB))
ax1.set_xticks([])
ax1.set_yticks([])
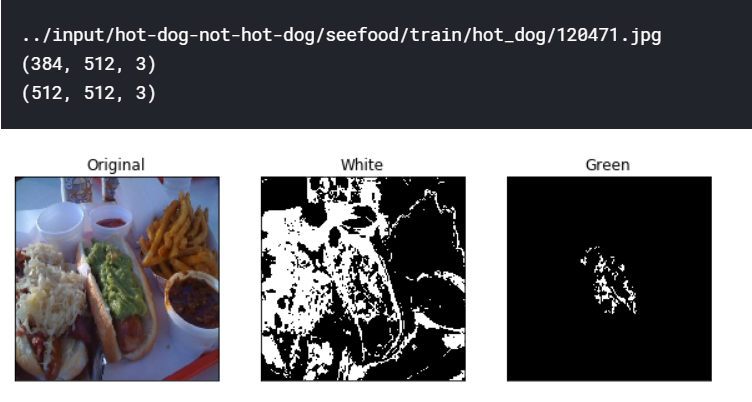
ax1.set_title('Original')
ax2 = fig.add_subplot(1, 3, 2)
ax2.imshow(mask_white, cmap='gray')
ax2.set_xticks([])
ax2.set_yticks([])
ax2.set_title('White')
ax3 = fig.add_subplot(1, 3, 3)
ax3.imshow(mask_green, cmap='gray')
ax3.set_xticks([])
ax3.set_yticks([])
ax3.set_title('Green')
plt.show()
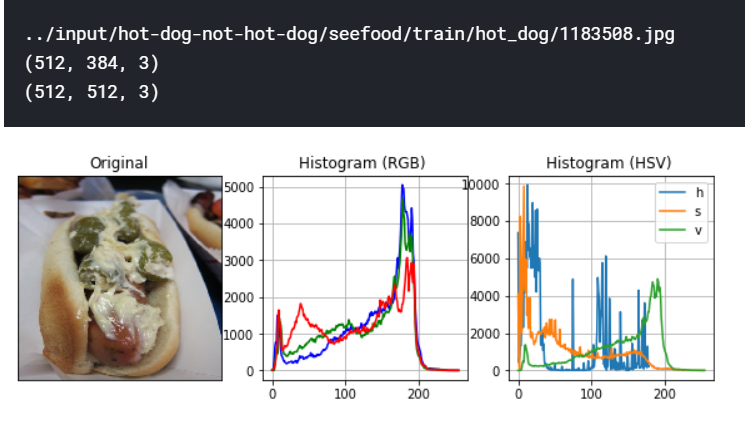
Example 4
size = 512
index = np.random.randint(len(train_data_hd))

print (train_data_hd[index])
img = cv2.imread(train_data_hd[index])
print (img.shape)
img = cv2.resize(img, (size, size))
print (img.shape)

img2 = cv2.cvtColor(img, cv2.COLOR_BGR2RGB)
img3 = cv2.cvtColor(img, cv2.COLOR_BGR2HSV)

fig = plt.figure(figsize = (10, 3))
ax1 = fig.add_subplot(1, 3, 1)
ax1.imshow(img2)
ax1.set_xticks([])
ax1.set_yticks([])
ax1.set_title('Original')

ax2 = fig.add_subplot(1, 3, 2)
color = ('r','g','b')
for channel, col in enumerate(color):
    hist = cv2.calcHist([img2], [channel], None, [256], [0, 256])
    ax2.plot(hist, color = col)
ax2.set_title('Histogram (RGB) ')
ax2.grid(True)

ax3 = fig.add_subplot(1, 3, 3)
hist_h = cv2.calcHist([img3], [0], None, [180], [0, 180])
ax3.plot(hist_h, label = 'h')
hist_s = cv2.calcHist([img3], [1], None, [256], [0, 256])
ax3.plot(hist_s, label = 's')
hist_v = cv2.calcHist([img3], [2], None, [256], [0, 256])
ax3.plot(hist_v, label = 'v')
ax3.set_title('Histogram (HSV) ')
ax3.legend(loc = 'best')
ax3.grid(True)

plt.show()
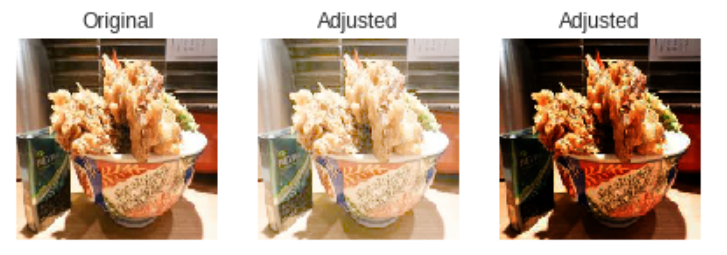
Example 5
path = '/content/gdrive/xxx/'
file_1 = 'xxx.jpg'
size = 128
img = Image.open(path+file_1).resize((size, size))
im = np.array(img, dtype=np.float)
im_1_22 = 255.0 * (im / 255.0)**(1 / 2.2)
im_22 = 255.0 * (im / 255.0)**2.2
im_1_15 = 255.0 * (im / 255.0)**(1 / 1.5)
im_15 = 255.0 * (im / 255.0)**1.5
img_1_22 = Image.fromarray(np.uint8(im_1_22))
img_22 = Image.fromarray(np.uint8(im_22))
img_15 = Image.fromarray(np.uint8(im_15))
img_1_15 = Image.fromarray(np.uint8(im_1_15))
fig = plt.figure(figsize = (7, 3))
ax1 = fig.add_subplot(1, 3, 1)
ax1.imshow(img)
ax1.set_xticks([])
ax1.set_yticks([])
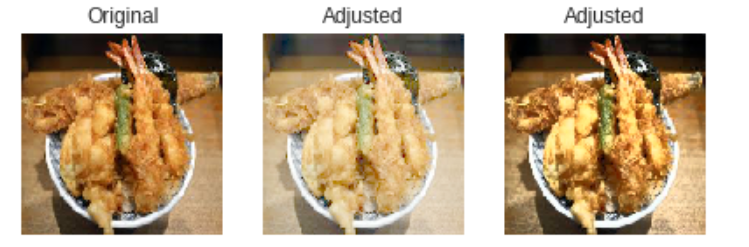
ax1.set_title('Original')
ax2 = fig.add_subplot(1, 3, 2)
ax2.imshow(img_1_22)
ax2.set_xticks([])
ax2.set_yticks([])
ax2.set_title('Adjusted')
ax3 = fig.add_subplot(1, 3, 3)
ax3.imshow(img_22)
ax3.set_xticks([])
ax3.set_yticks([])
ax3.set_title('Adjusted')
plt.show()
Example 6
def gamma_correction(img, gamma):
    arr = np.array(img, dtype=np.float)
    arr = 255.0 * (arr / 255.0)**(gamma)
    return Image.fromarray(np.uint8(arr))


img_a = gamma_correction(img, 1/2.2)
img_a = img_a.convert("YCbCr")
yy, cb, cr = img_a.split() # linear yy,cc,cr

yy = gamma_correction(yy, 2.2)
yy = ImageOps.equalize(yy)
yy = gamma_correction(yy, 1/2.2)

img_b = Image.merge("YCbCr", (yy, cb, cr))
img_b = img_b.convert("RGB")
img_c = gamma_correction(img_b, 2.2)

fig = plt.figure(figsize = (7, 3))
ax1 = fig.add_subplot(1, 3, 1)
ax1.imshow(img)
ax1.set_xticks([])
ax1.set_yticks([])
ax1.set_title('Original')

ax2 = fig.add_subplot(1, 3, 2)
ax2.imshow(img_a)
ax2.set_xticks([])
ax2.set_yticks([])
ax2.set_title('Adjusted')

ax3 = fig.add_subplot(1, 3, 3)
ax3.imshow(img_c)
ax3.set_xticks([])
ax3.set_yticks([])
ax3.set_title('Adjusted')

plt.show()