概要
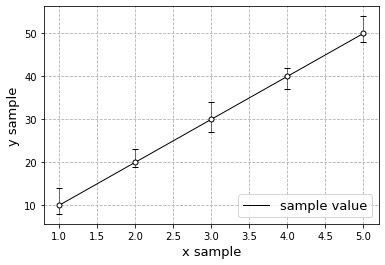
matplotlibで上下異なるエラーバー付きグラフを描く。
プログラム
import matplotlib.pyplot as plt

x = [1,2,3,4,5]
y = [10,20,30,40,50]
yerr = [[2, 1, 3, 3, 2], [4, 3, 4, 2, 4]]

plt.errorbar(x, y, yerr,label="", capsize=3, fmt='.', markersize=10, ecolor="black", elinewidth=0.5, markeredgecolor="black", color="w")
plt.plot(x, y, label="sample value", color="k", linewidth=1)
plt.legend(loc="lower right", fontsize=13)
plt.xlabel("x sample", size=13)
plt.ylabel("y sample", size=13)
plt.grid(linestyle="--")
errorbar
エラーバーはplt.errorbar()で出力される。
x, yはplt.plot()と同じ値を出力し、yerrにエラーバーに表示したい値を入力する。
yerrに入力する値が二次元の場合、
1次元目が中心アイコンからエラーバーの下まで距離の値、
2次元目が中心アイコンからエラーバーの上まで距離の値
になる。
参考
- qiitaのerrorbar記事:
- errorbarの中心のアイコンfmt:
以下のリンクのformat setting
- errorbarのlineの太さなど:
