はじめに
APMによるトレースの取得はOpenTelemetryで行うようになってきましたが、通常のログやメトリクスの取得も含めて全てOpenTelemetryで行えるようになってきています。
Elasticはそのような要望に応えるためにElastic Distributions of OpenTelemetry (EDOT)をリリースしています。
https://elastic.github.io/opentelemetry/
EDOTをを利用することでElastic Common Schema(ECS)に準拠しながら標準のOpenTelemetryを利用することが出来ます。
本記事ではごく簡単なFlaskのアプリケーションのトレースをEDOTで取得する手順について説明します。
2025/04/16現在の最新バージョンであるv9.0.0をベースに記載
環境
OS: Ubuntsu 24.04
Python: 3.12.3
pip: 25.0.1
手順
- pipでパッケージインストール
- EDOT Collector(=Elastic Agent)をダウンロードして設定
- 環境変数設定
- redisインストール&起動
-
opentelemetry-instrumentで起動
パッケージインストール
下記のGitレポジトリをcloneします。
https://github.com/legacyworld/edot
requirements.txtがあるのでそれでインストールしてもいいですし、flask,redis,elastic-opentelemetryを別個にインストールしてもよいです。
pip install -r requirements.txt
Instrumentationインストール
edot-bootstrap --action=install
EDOT Collector
基本はこのページの通りに行います。
https://elastic.github.io/opentelemetry/quickstart/
送信先がElastic CloudやSelf Managedによって少し異なるが基本は同じです。
例えば今回のようにVM上でプログラムを動かしている&Elastic Cloudに送る場合はこちら。
https://elastic.github.io/opentelemetry/quickstart/ech/hosts_vms
ダウンロード
こちらのページからダウンロード
https://elastic.github.io/opentelemetry/edot-collector/download.html
設定
ダウンロードしたファイルを展開して、作成されたディレクトリに移動して下記を実行します。
otel.ymlファイルに設定を入れているのがわかります。
<ELASTICSEARCH_ENDPOINT>と<ELASTIC_API_KEY>は環境に合わせて変更します。
 ELASTICSEARCH_ENDPOINT=<ELASTICSEARCH_ENDPOINT> && \
 ELASTIC_API_KEY=<ELASTIC_API_KEY> && \
 cp ./otel_samples/logs_metrics_traces.yml ./otel.yml && \
 mkdir -p ./data/otelcol && \
 sed -i "s#\${env:STORAGE_DIR}#${PWD}/data/otelcol#g" ./otel.yml && \
 sed -i "s#\${env:ELASTIC_ENDPOINT}#${ELASTICSEARCH_ENDPOINT}#g" ./otel.yml && \
 sed -i "s#\${env:ELASTIC_API_KEY}#${ELASTIC_API_KEY}#g" ./otel.yml
- ELASTICSEARCH_ENDPOINT
Elastic CloudであればCopy Endpointでコピーされる部分

- ELASTIC_API_KEY
EDOT Collector起動
sudo ./otelcol --config otel.yml
環境変数
今回はElasticsearchに直接データをいれるので何もしなくてもよいですが、APMのページに表示される名前がunknown_serviceになってしまってわかりにくいです。
わかりやすくするためにOTEL_RESOURCE_ATTRIBUTESだけは設定しておきます。
export OTEL_RESOURCE_ATTRIBUTES="service.name=edot,service.version=1.0.0,deployment.environment=dev"
Redis
Redisを使います。何もせず起動すればOKです
apt install redis
プログラム起動
opentelemetry-instrument python edot.py
http://<IP address>:5011/endpoint1
にアクセスしてトレースを発生させます。
curlでも問題ありません。
以下のようなログが吐き出されればOKです。
Received request
connecting to Redis 20 times
INFO-1000,fast request
Received request
connecting to Redis 20 times
ERR-1000,slow request
CRITICAL-1000,expected error, will be handled
データ確認
KibanaからObservability->Applicationとクリックします。
(以前のバージョンではAPMでした)
データが表示されるまで少し時間がかかります。

OTEL_RESOURCE_ATTRIBUTESで指定した値が表示されています。
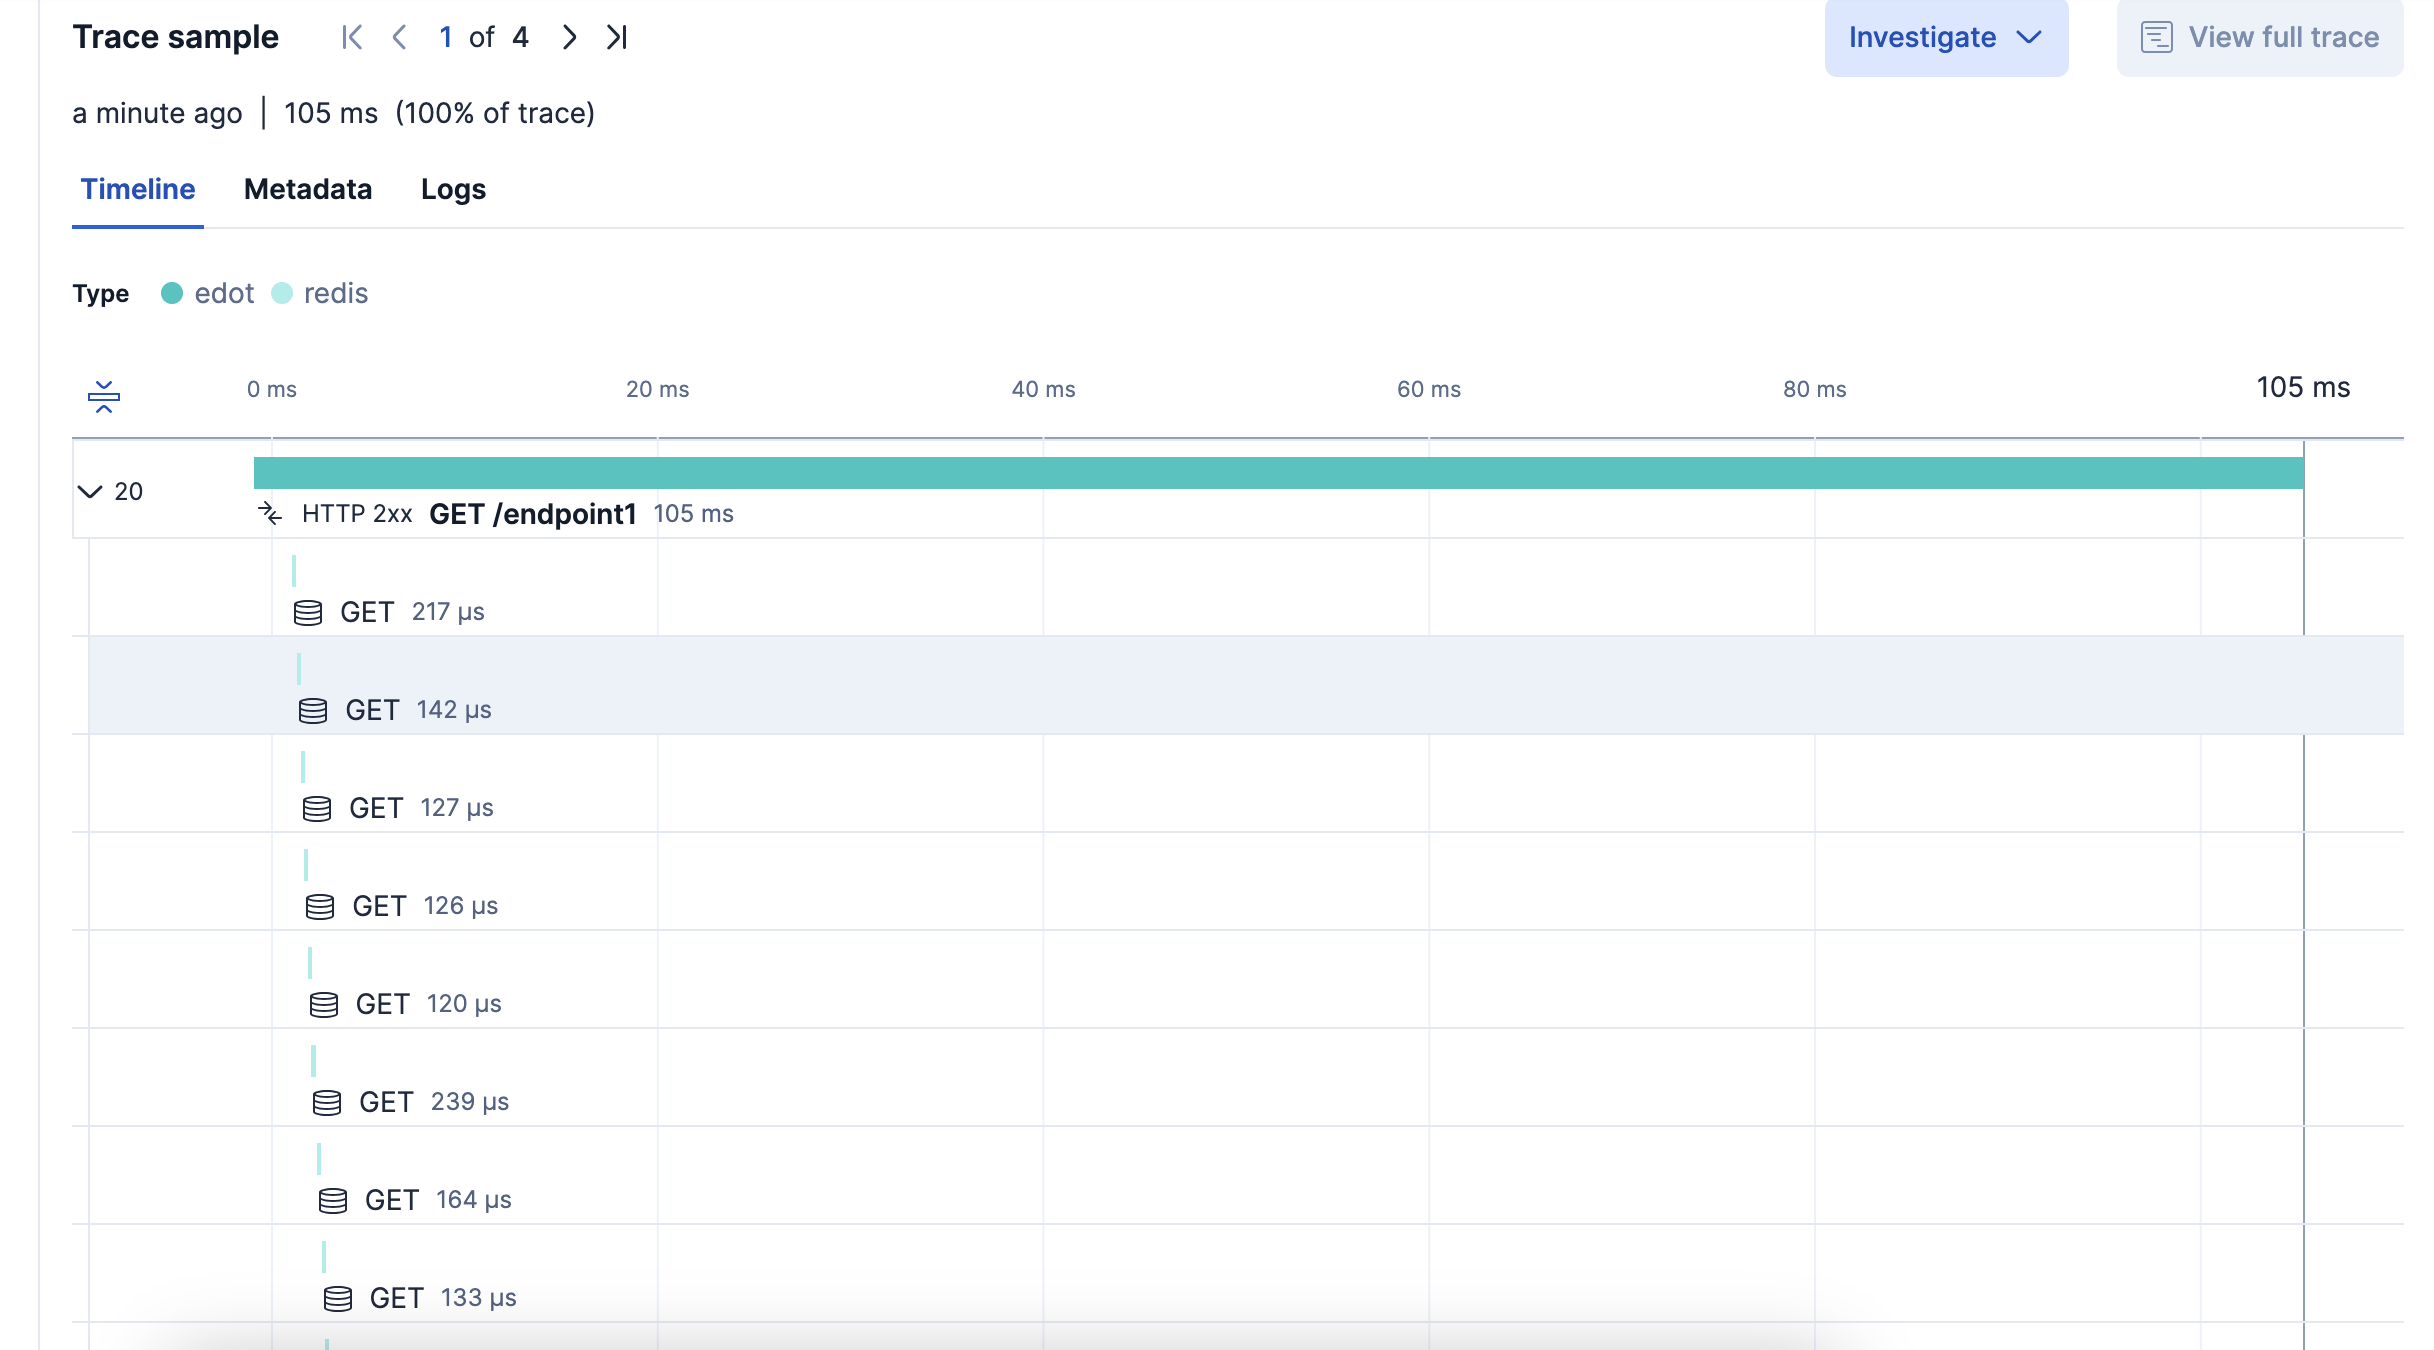
edotをクリックして真ん中あたりにある以下の部分のGET /endpoint1をクリックします。

Redisへ送ったコマンドなどがトレースとして表示されます。
まとめ
非常にシンプルなFlaskアプリでしたが、EDOTを利用すると非常に簡単にOpenTelemetryでトレースデータを直接Elasticsearchに送ることができるのがおわかりいただけたと思います。
これまではIntegrationsサーバ経由でしたがそれもなくなりました。
勿論これまで通りにIntegrationsサーバ経由でも送ることは出来ます。
この機会にぜひElasticsearch+OpenTelemetryをお試しください。