optuna.visualizationのグラフを保存しようとして、幾つか気づきがありましたので、記載します。
環境構築手順
Optuna
Optunaは、Preferred Networksが提供する、ハイパーパラメータ自動最適化フレームワークです。
https://preferred.jp/ja/projects/optuna/
https://github.com/optuna/optuna
optuna visualization
optunaのvisualizationは、最適化の工程をプロットするユーティリティ関数です。
様々なグラフを描画できます。
https://optuna.readthedocs.io/en/stable/reference/visualization/index.html
jupyter notebookのサンプルコードはこちら。
https://colab.research.google.com/github/optuna/optuna/blob/master/examples/visualization/plot_study.ipynb
Plotly
visualizationは、内部でplotlyを利用します。
plotlyはグラフを作成するためのライブラリです。
https://plotly.com/python/
環境構築はこちらのインストールガイドが参考になります。
https://github.com/plotly/plotly.py#jupyterlab-support-python-35
Kaleido
私はウェブブラウザではなく、コマンドプロンプトから、グラフを保存したかったので、Kaleidoをインストールし、無事、保存できました。
Kaleidoは画像を保存するためのライブラリです。
https://pypi.org/project/kaleido/
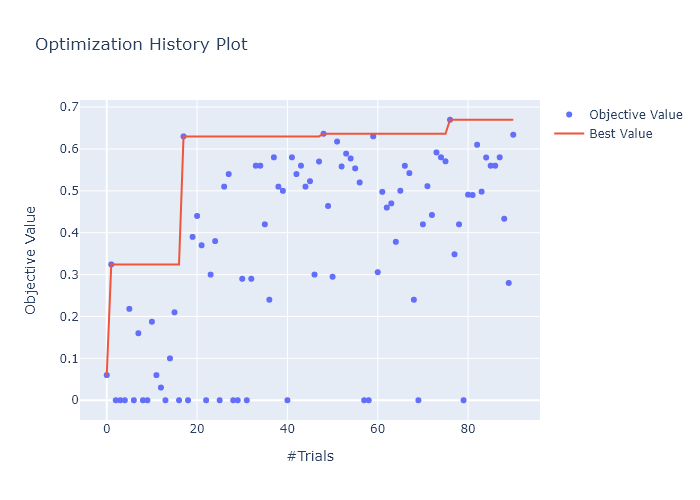
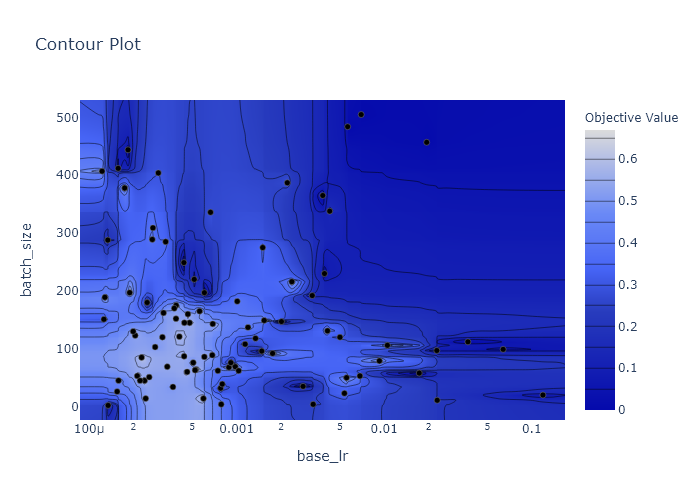
実行結果サンプル
optimization history
contour
注意事項
以下をご注意ください。
plotlyはversion4.9以上を利用する必要があります。google colaboratoryのplotlyはversion4.4.1なので、アップデートする必要があります(2021/1/18)。
https://github.com/plotly/Kaleido
インストールガイドにはOrca/psutilを使う方法も記載されていますが、正しく機能しない場合があります。
Plotlyをオフラインで使う方法もありますが、ウェブブラウザが開かれてしまいます。
optuna.visualization.matplotlib
matplotlibバージョンもあります。
stableバージョンでは、contour、sliceはサポートされていません。
https://optuna.readthedocs.io/en/stable/reference/visualization/matplotlib.html
latestバージョンでは、contour、sliceもサポートされています。
https://optuna.readthedocs.io/en/latest/reference/visualization/matplotlib.html
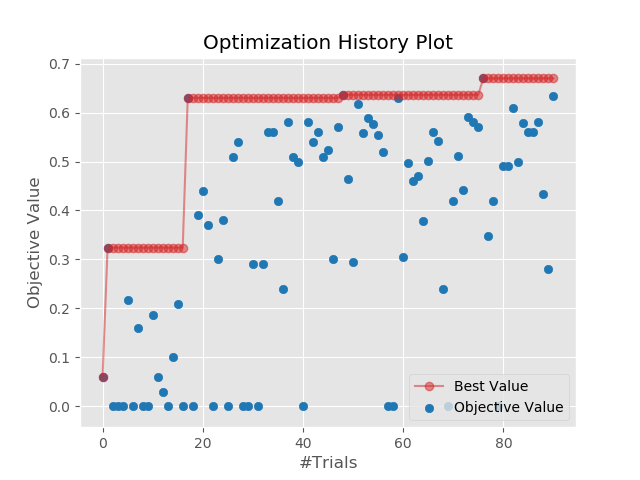
実行結果サンプル
matplotlibはplotlyより低品質な印象です。
optimization history
参照
Static Image Export in Python
https://plotly.com/python/static-image-export/
Matplotlib backend for visualization functions
https://github.com/optuna/optuna/issues/1539


