はじめに
ずっとやり方わからなかったんだけど最近表題のやり方が分かったので共有します。
説明用にサンプルプロジェクト作った1ので、これで説明します。
また、IntelliJから直接デバッグする方法と、Dockerをリモートサーバとしてデバッグする方法と2つ説明します。前者で全てうまくいけばそれでいいと思うんですが、できない場合は後者と言う感じで。
あとRubyMineも大体同じだと思う。Mac以外も大体同じだと思うけど、"Dockerをリモートサーバとしてデバッグする方法"はちょっと違うので注意。
使ったIntelliJのバージョンは2017.3.4。
プロジェクトに必要な準備
この次の章からサンプルプロジェクトを使って説明しますが、その前に読者の方が自分のプロジェクトでやる時に必要な準備について説明しておきます。
やるべきことは1つで、Gemfileにruby-debug-ideとdebaseを追加してインストールしておきます。
あとはbyebug系使ってるとうまく動かないことがあるっぽいので、使わないならGemfileから削除しておくことをおすすめします。
それ以外は多分いじらなくてもこのサンプルプロジェクトを使った説明と同じ手順で動くと思いますが、動かない場合はサンプルプロジェクトと違うところを見比べながら原因を探ると良いかと思います。重要なファイルは以下の3つでしょう。
- Dockerfile
- docker-compose.yml
- Gemfile
あと最後の方にトラプルシューティングの章も設けたので必要があれば参照してください。
それではサンプルプロジェクトを使って説明していきます。
サンプルプロジェクトのIntelliJ設定
何はともあれサンプルプロジェクトのコンテナが動くようにする。
$ git clone git@github.com:takc923/rails-docker-compose-rubymine-example.git
$ cd rails-docker-compose-rubymine-example
$ cp .env.development .env
$ docker-compose up -d
$ docker-compose exec web bundle exec rake db:migrate
$ docker-compose stop web
次にIntelliJでのプロジェクト設定を行っていく。
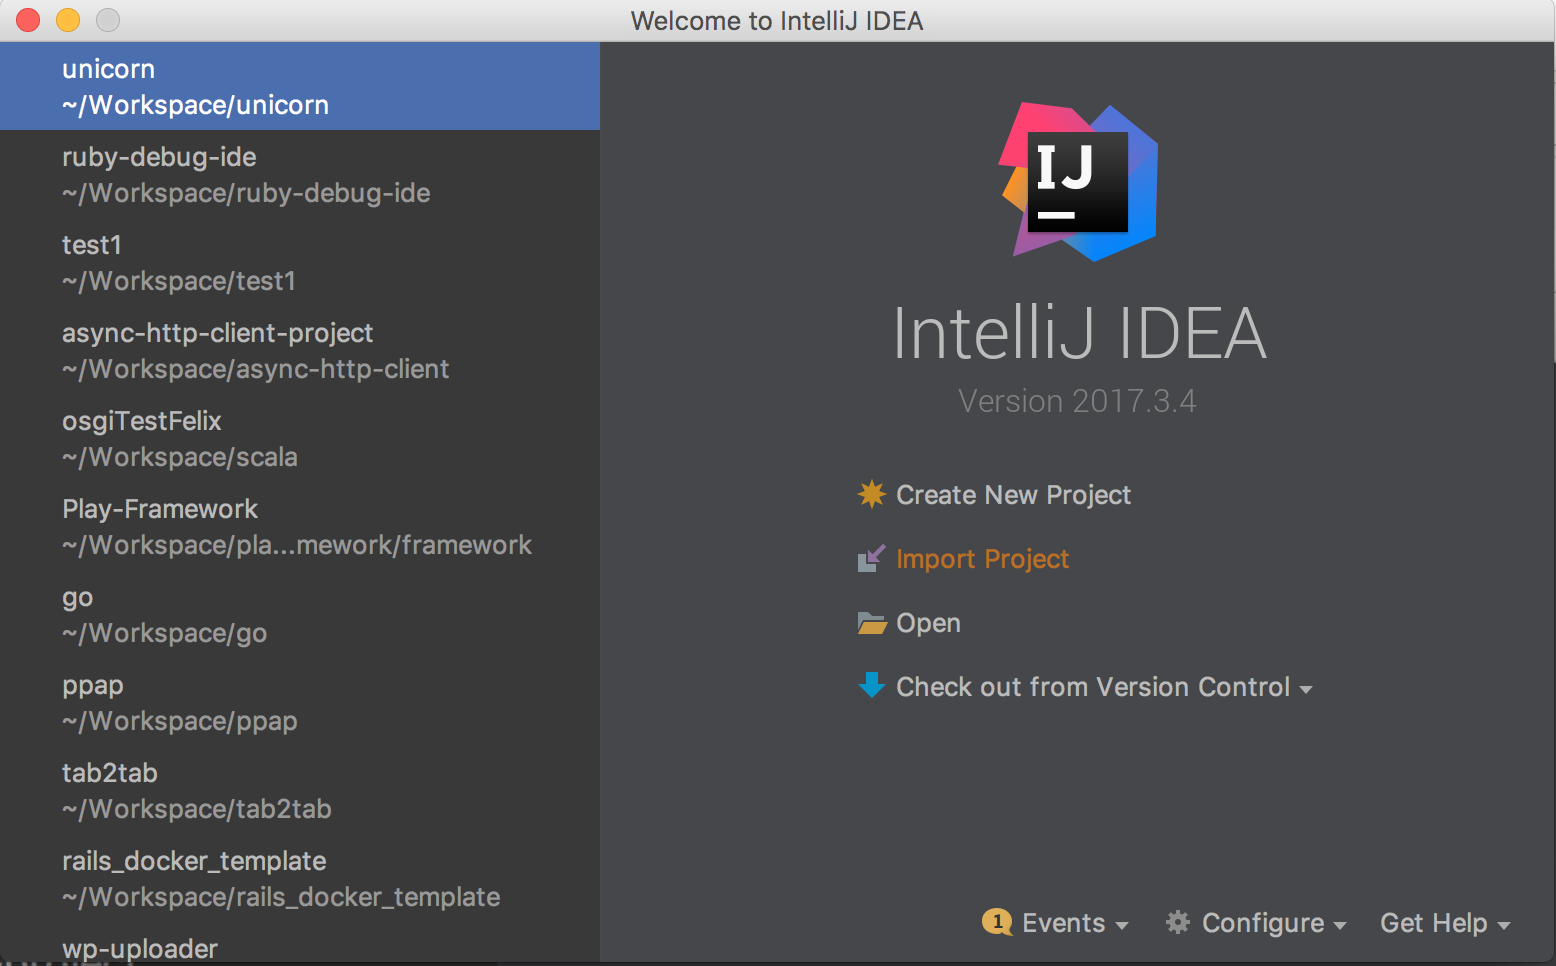
↓のImport Projectから↑のディレクトリ開いてあとはデフォルトでOK押していってプロジェクトを開く。
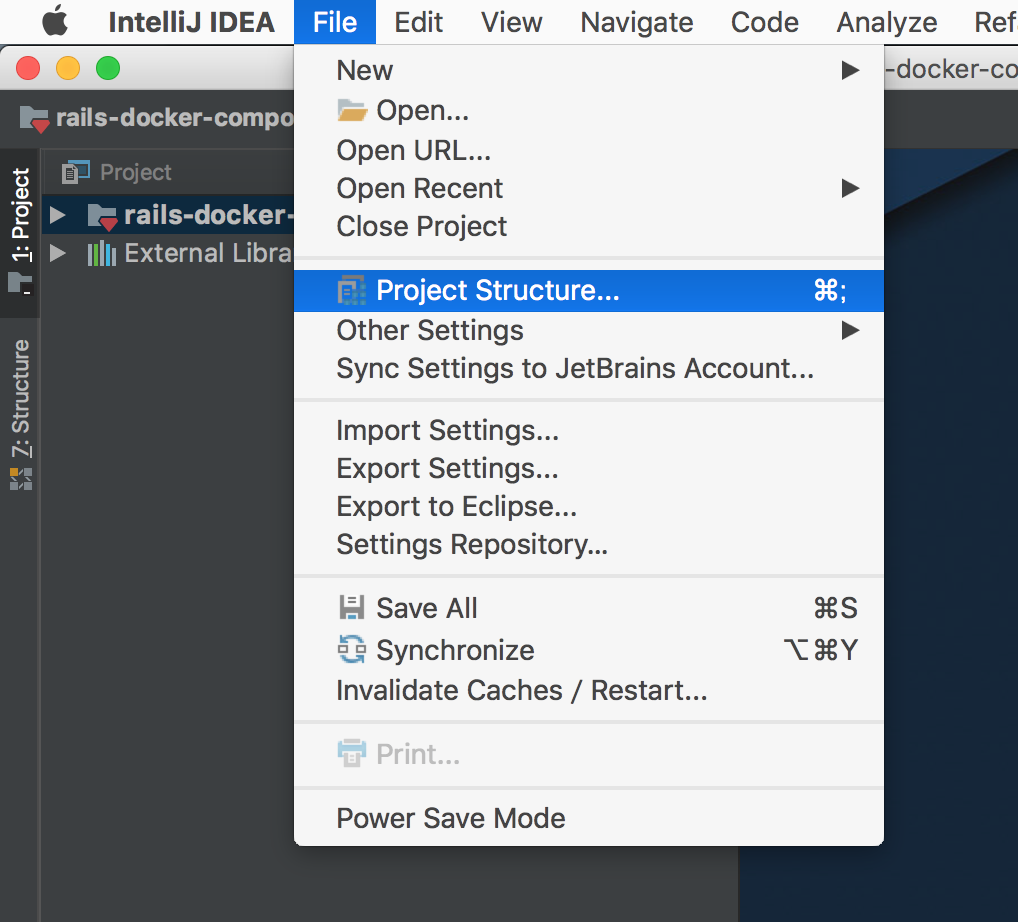
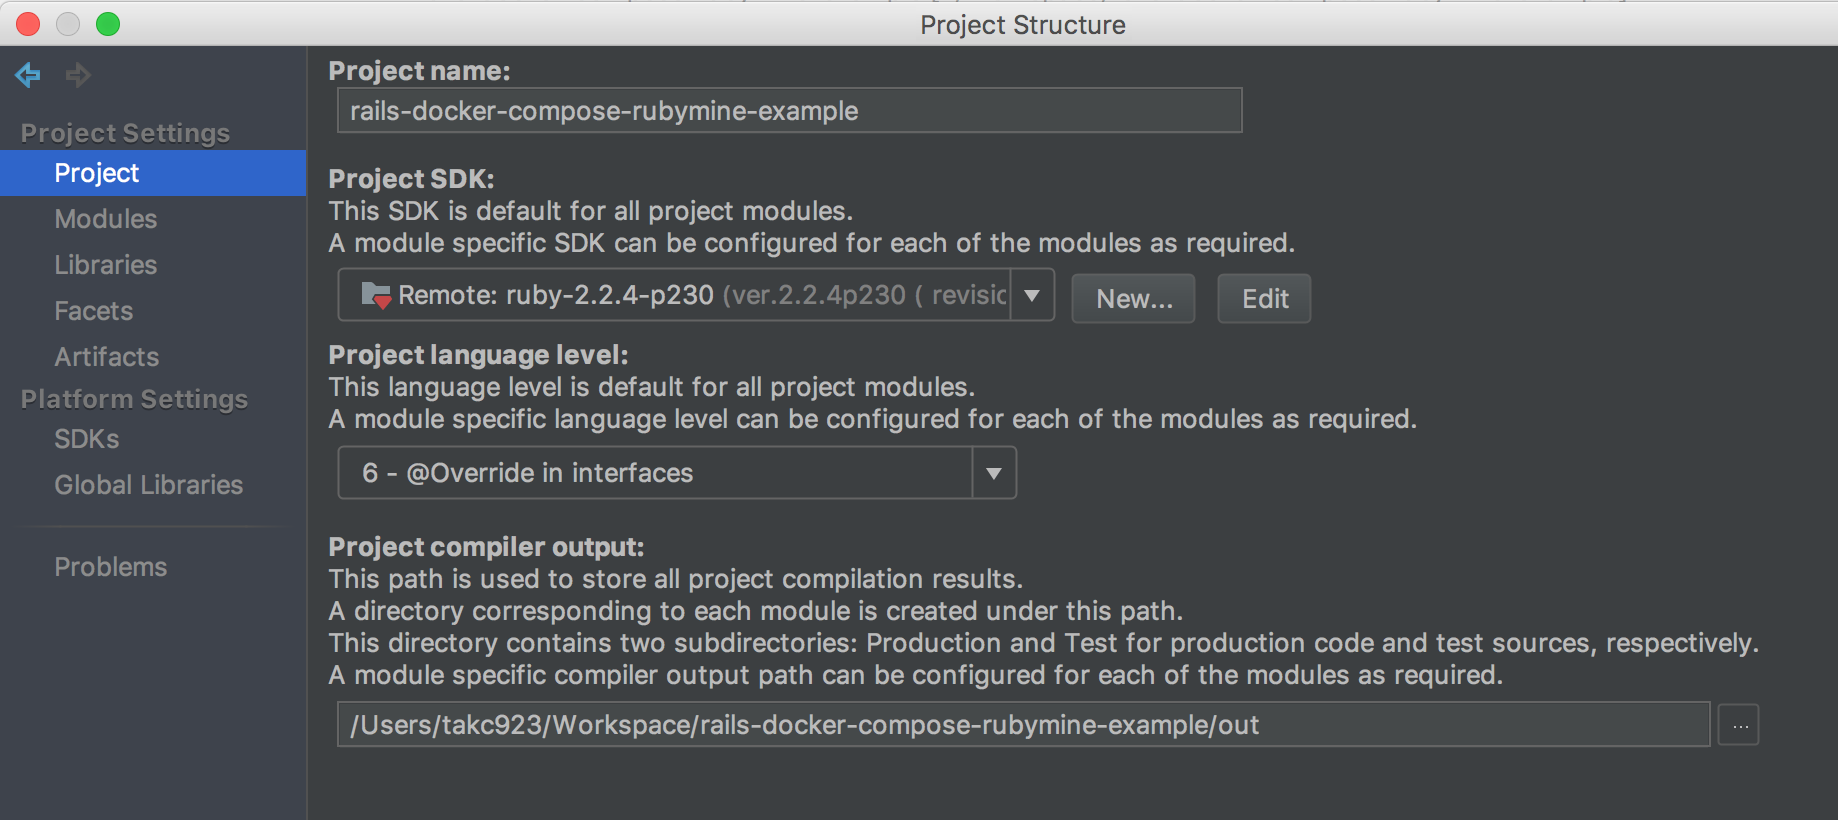
Project Structureを開く。
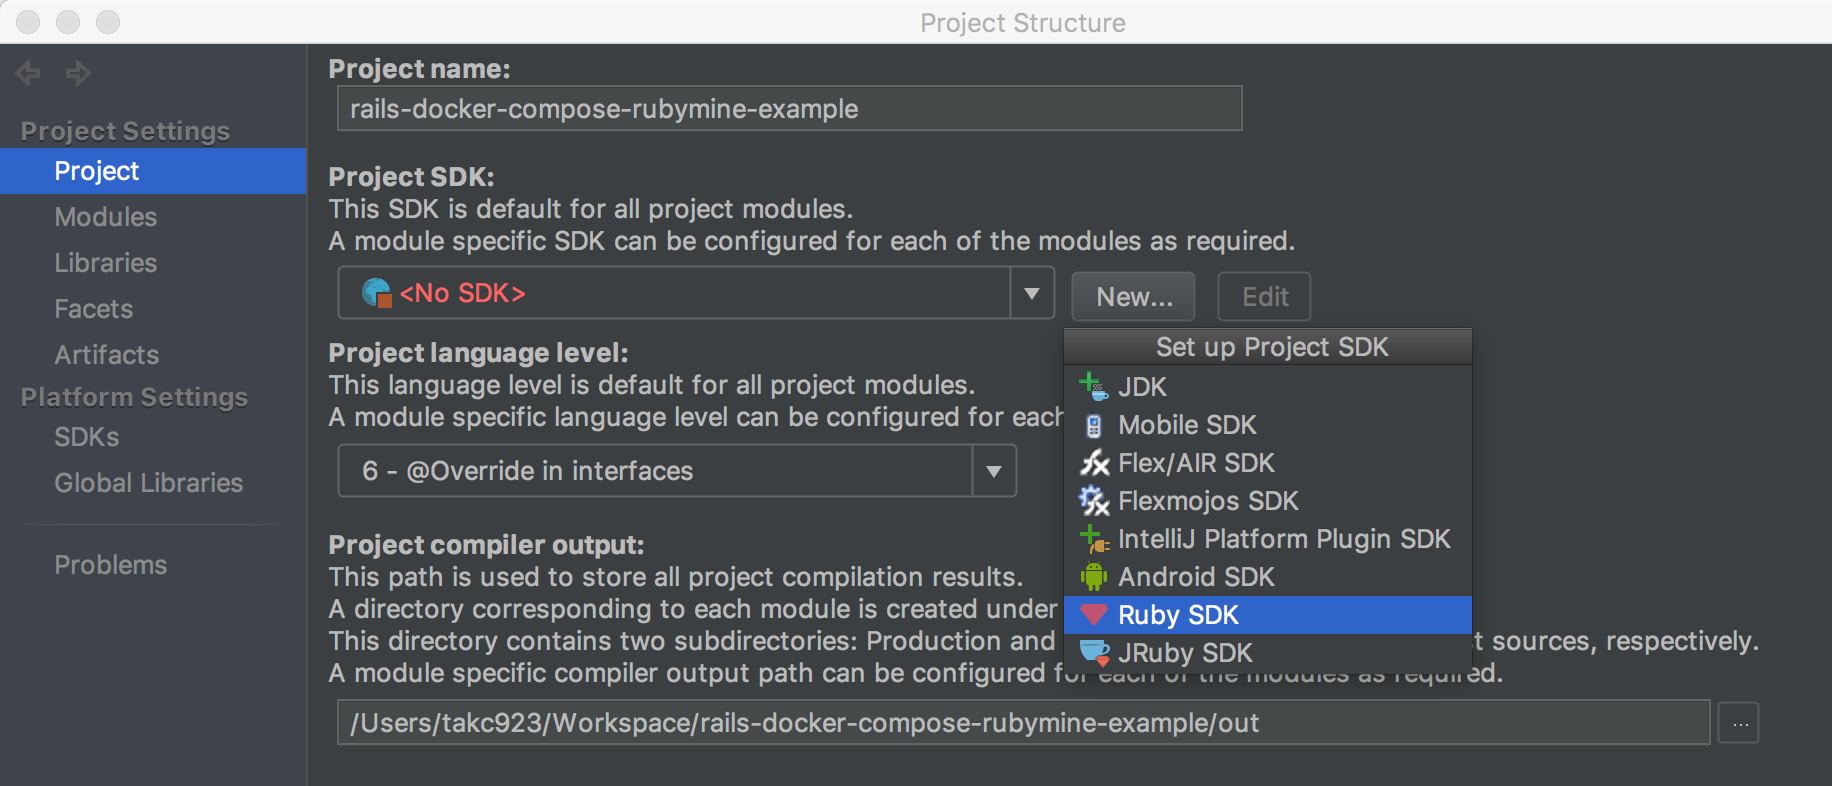
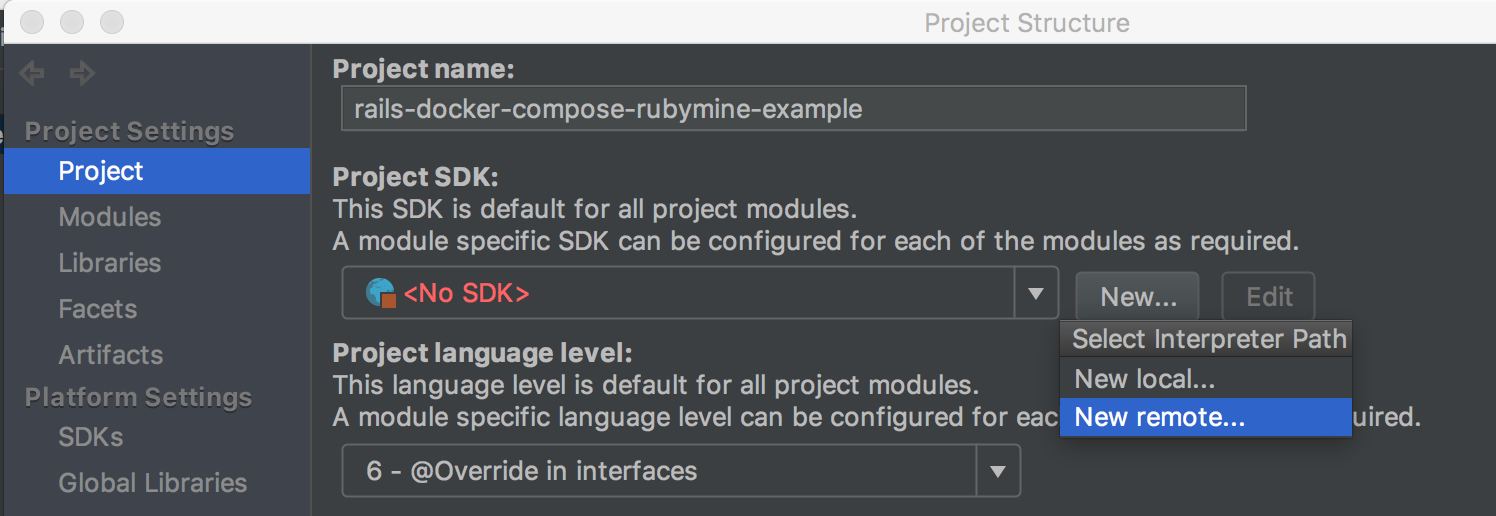
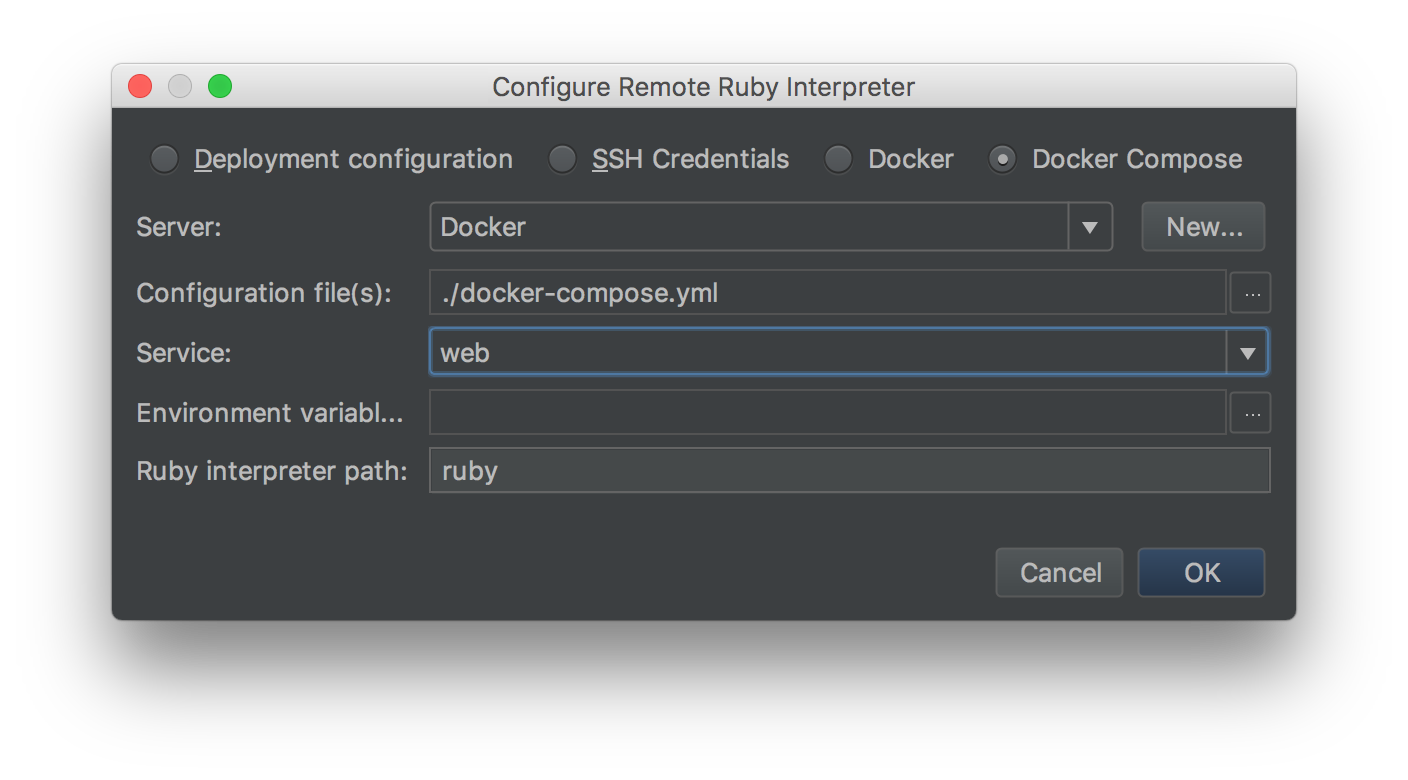
Project → Project SDKのNew → Ruby SDK → New remote
Docker composeを選択し、ServiceをwebにセットしてOK。OKを押すと、docker-compose upってウィンドウと設定画面が交互に出るバグっぽい挙動をするが、落ち着くまで待つ。
今作ったSDKがセットされていることを確認してOK
そしたらもう一度Project Structureを開き、Modules → rails-docker-compose-rubymine-example → Ruby SDK and Gemsでさっき作ったSDKを選択しOK。ここら辺でもdocker-compose upのウィンドウでたりするかもしれないけど同様に落ち着くまで待つ。
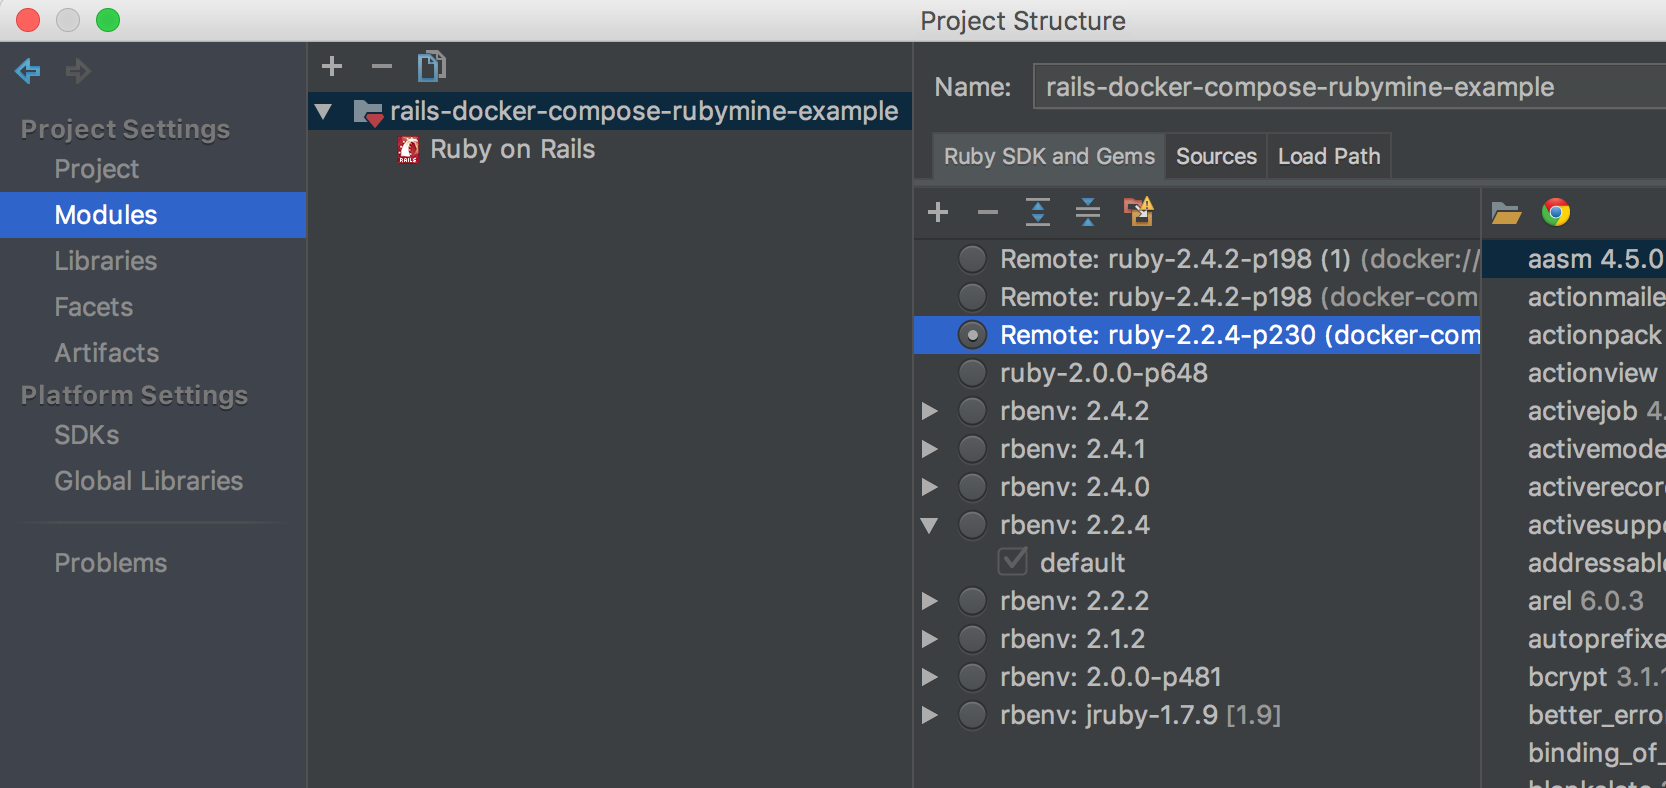
多分Indexingが走るので、落ち着くまで放置。これで必要な準備が整った。
”はじめに” で説明したようにこの次では"IntelliJから直接デバッグする"方法と、"Dockerをリモートサーバとしてデバッグする"方法とを説明する。
IntelliJから直接デバッグする
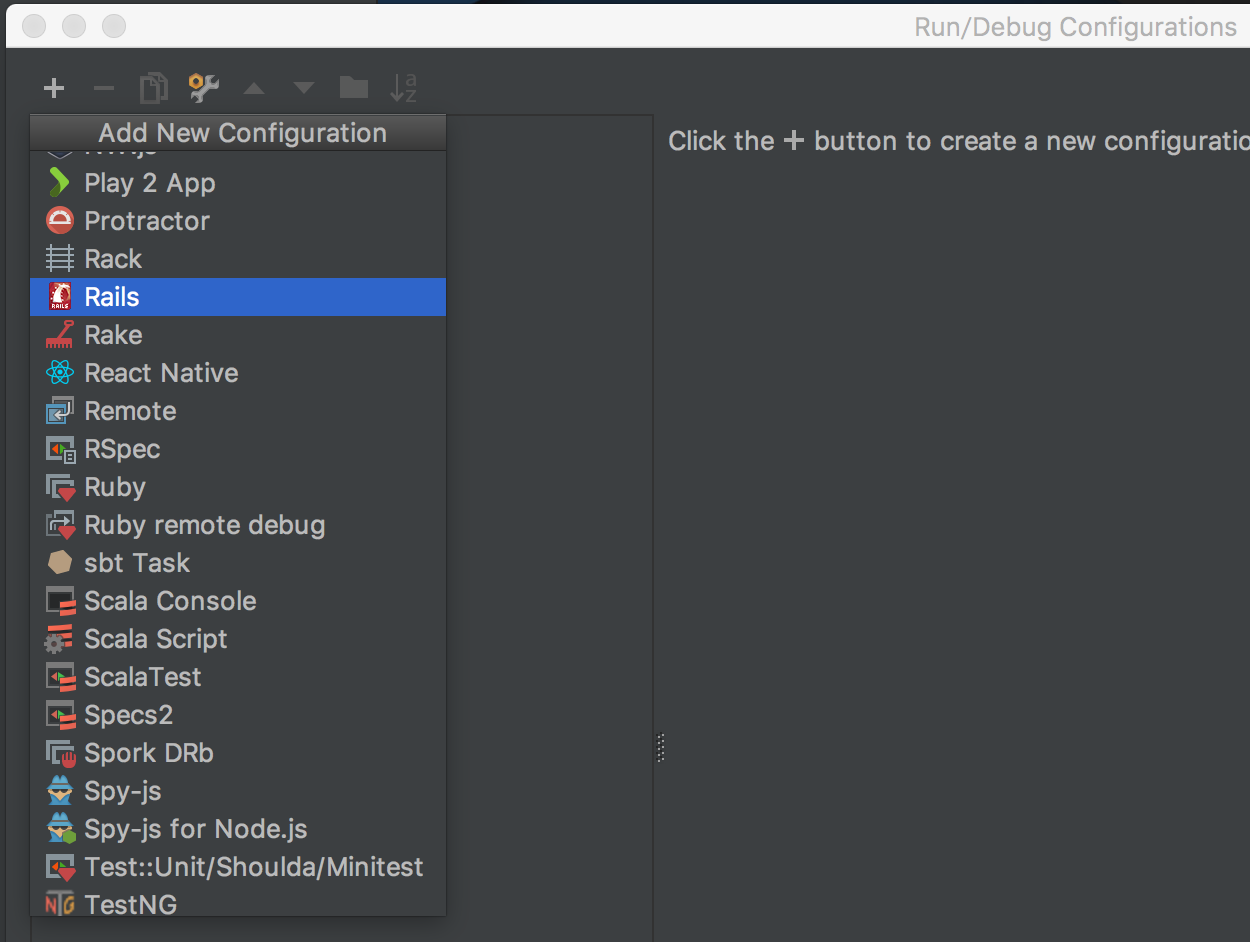
普通にRailsのRun configuration作ってデバッグ実行すれば良い。
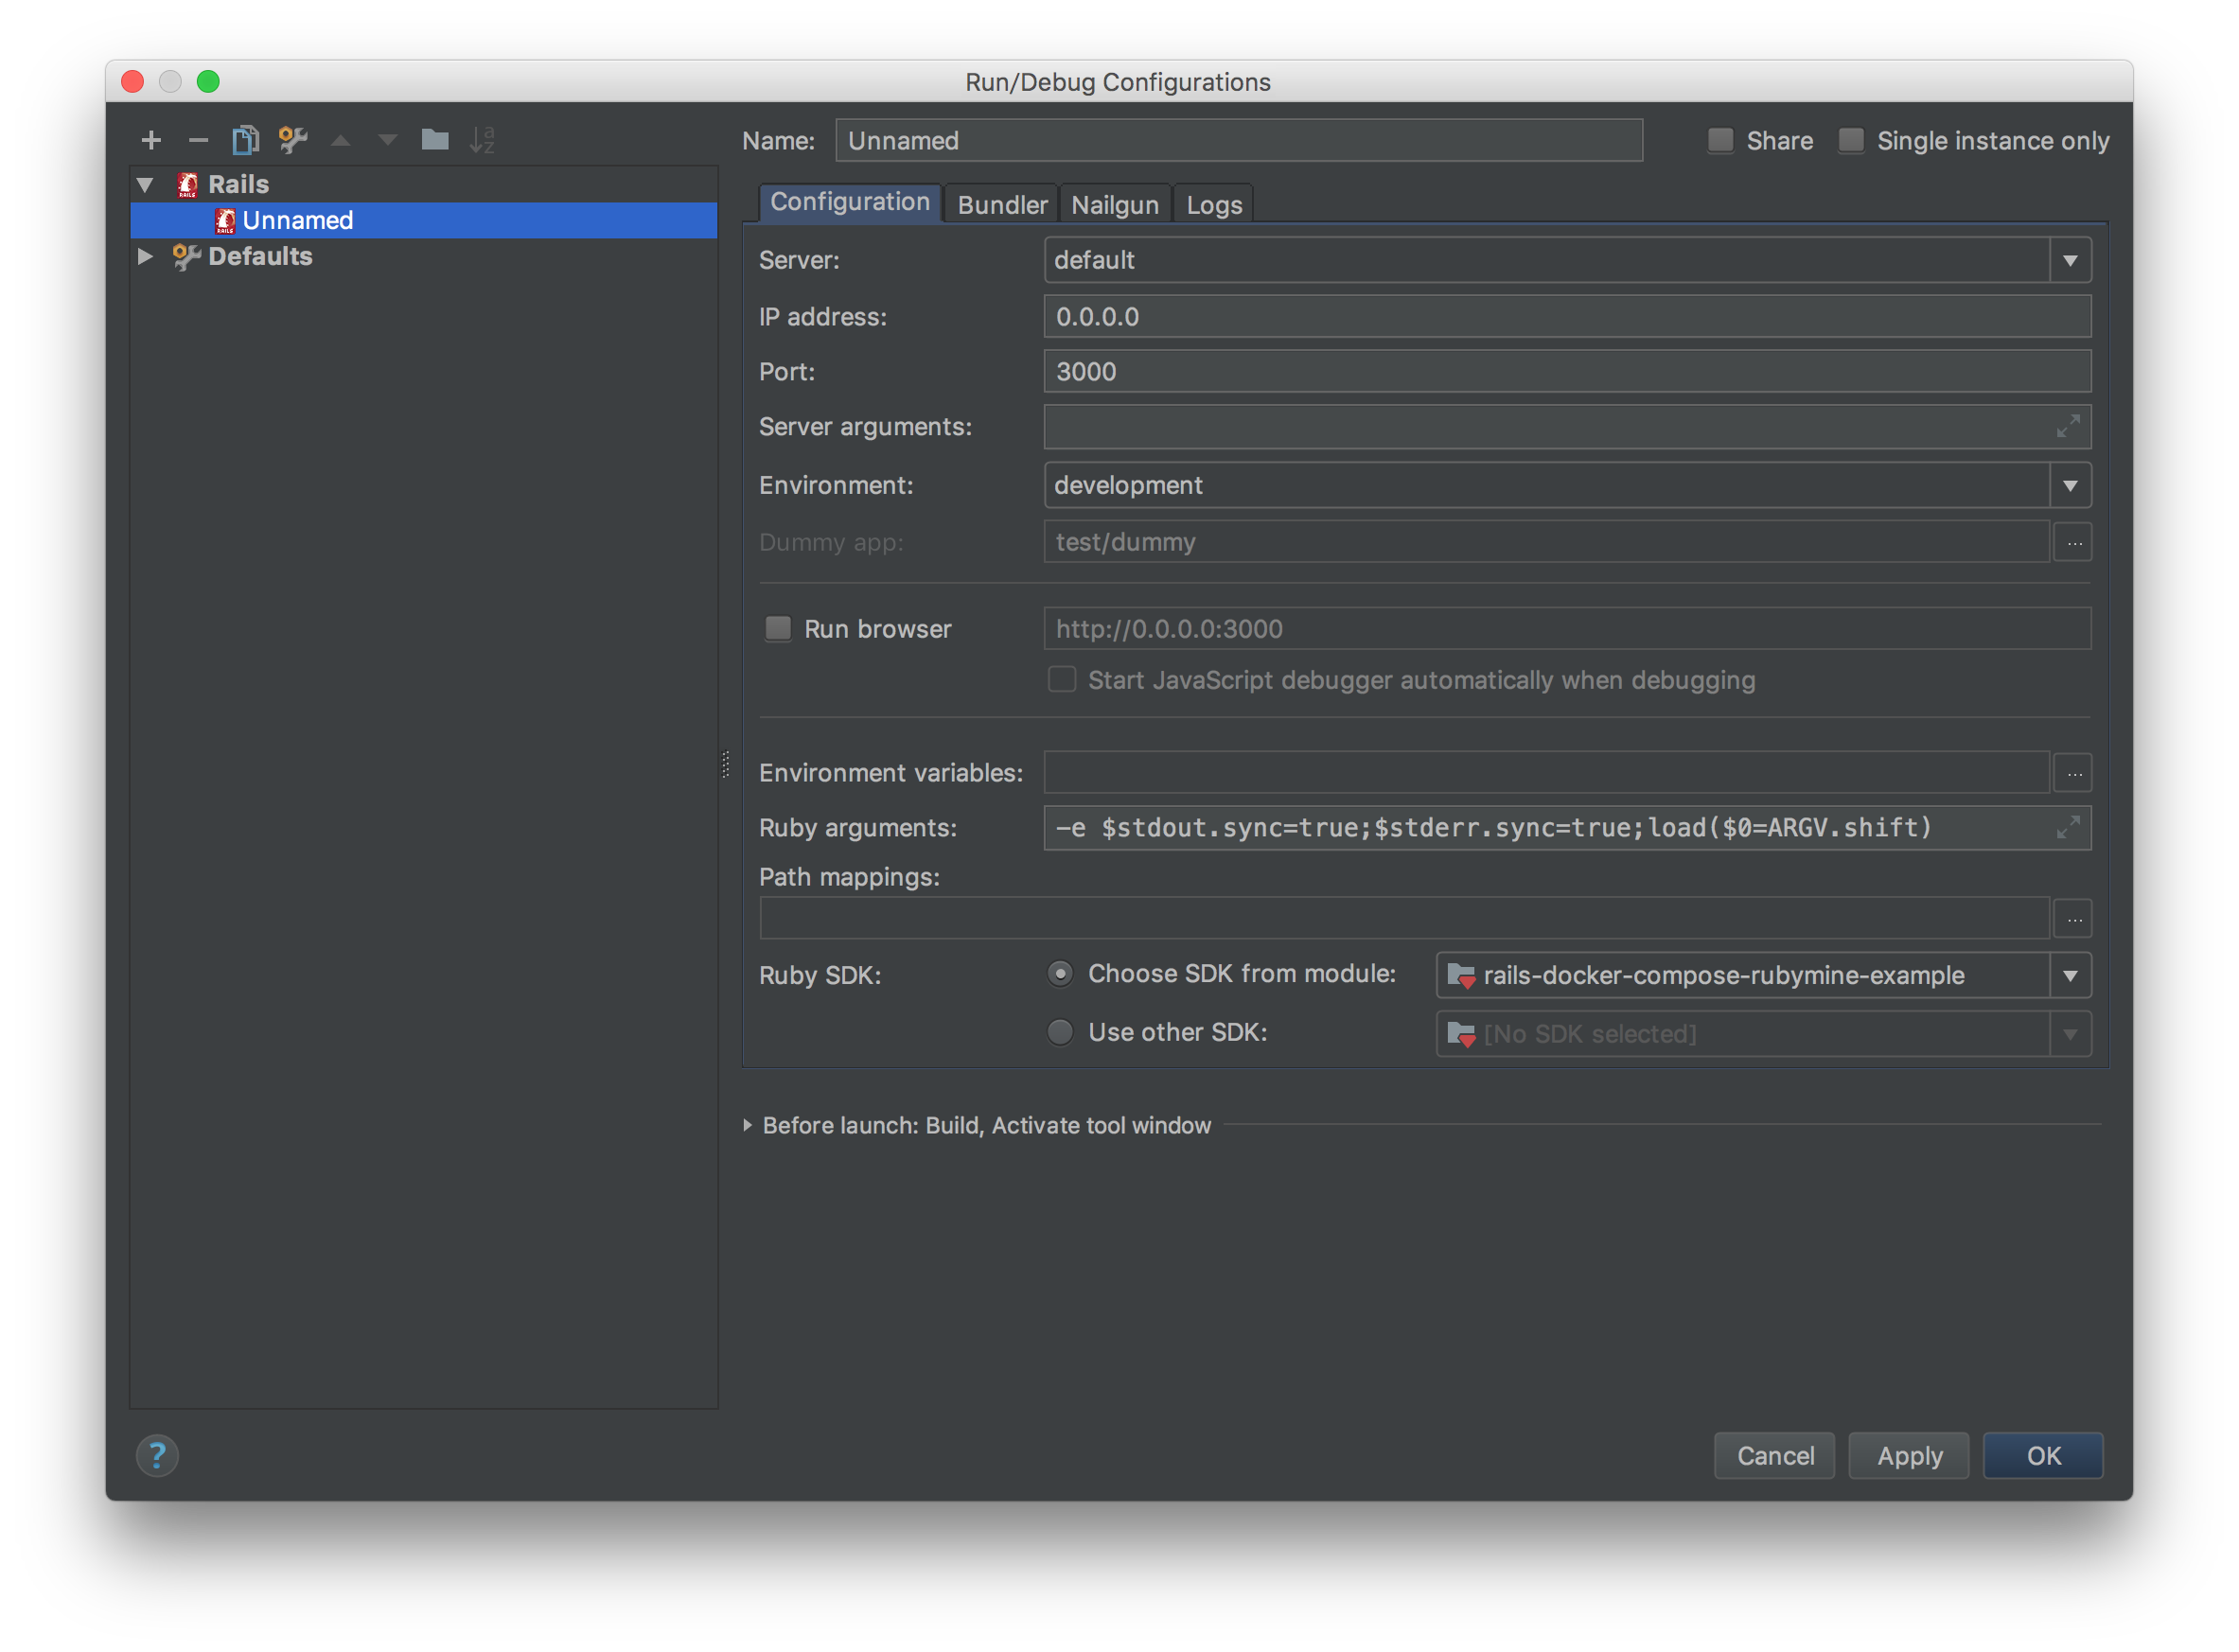
これでブレイクポイントつけたりできる。
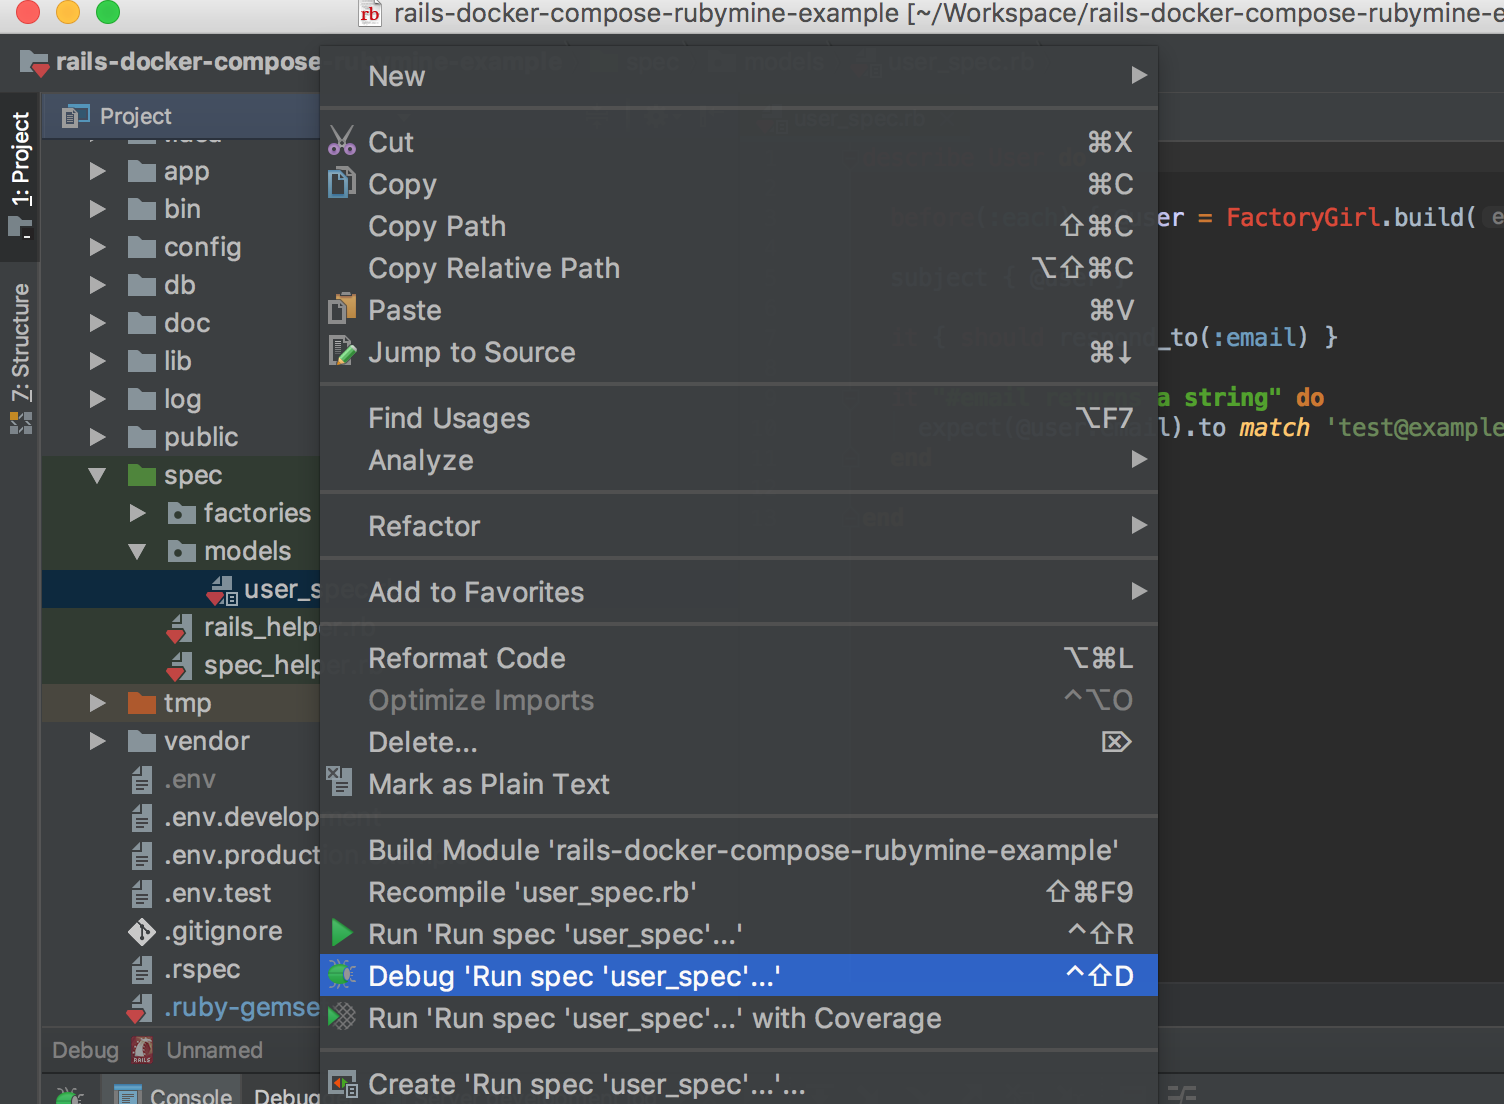
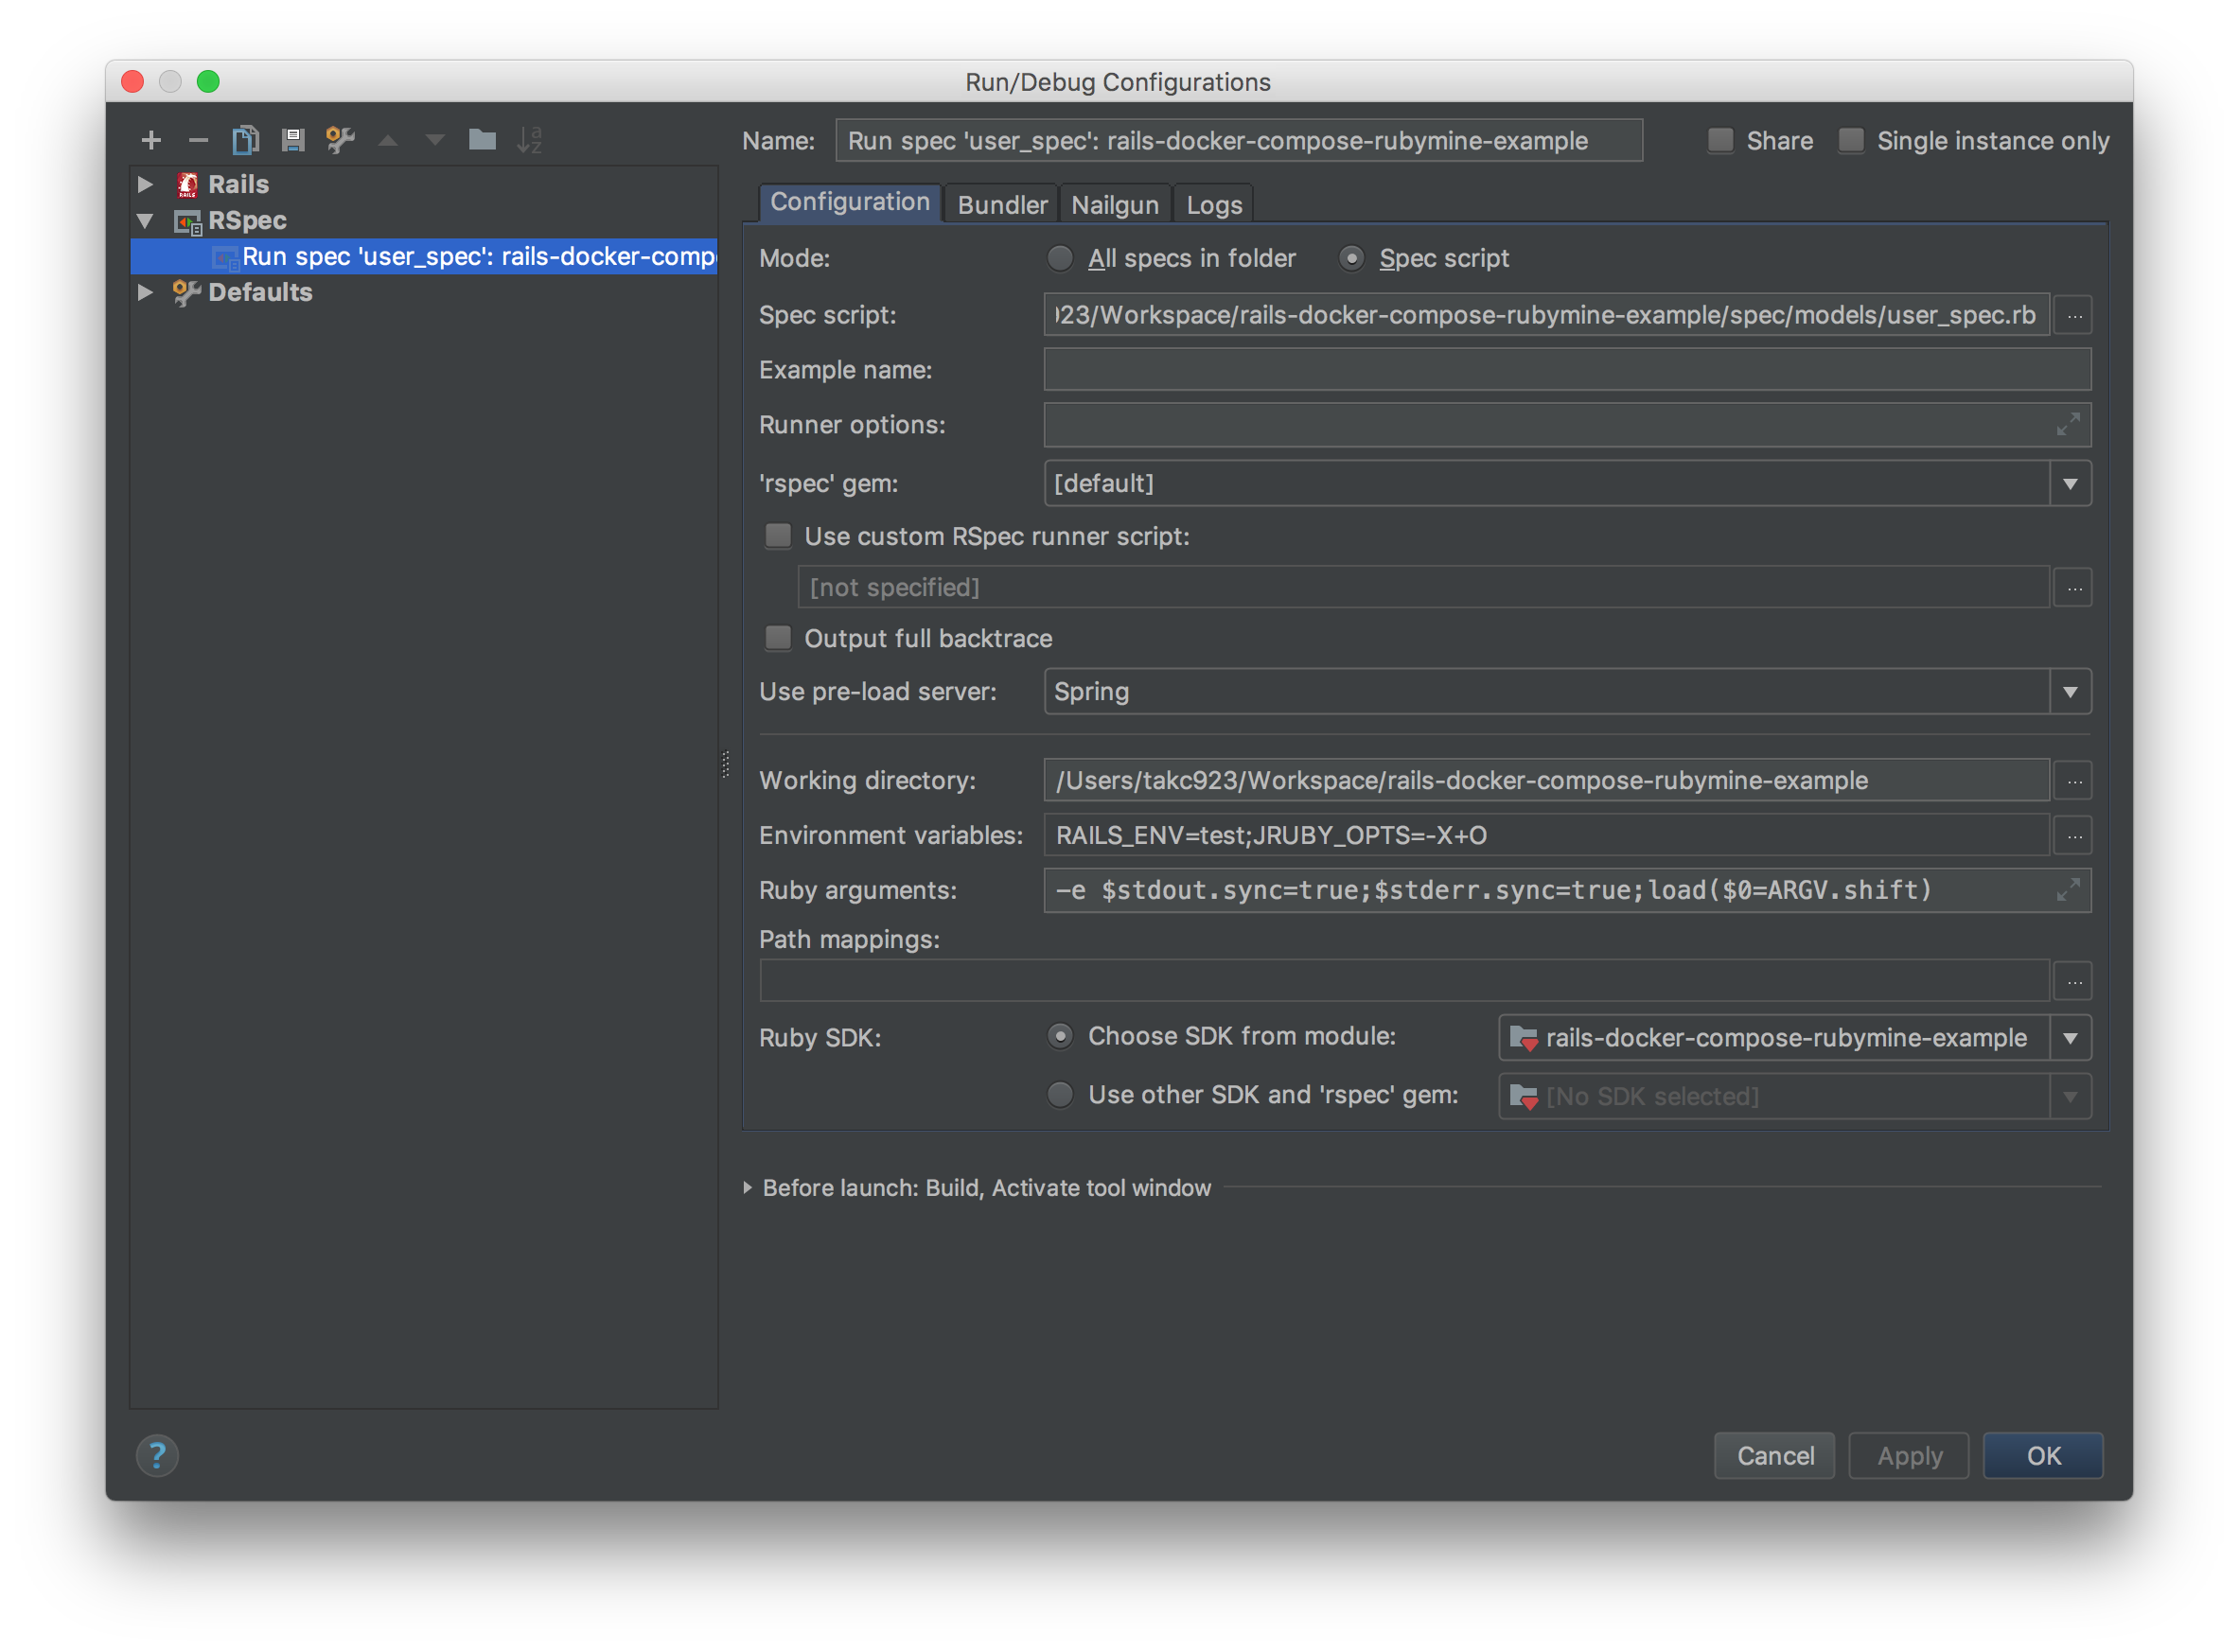
テストの実行もDockerじゃない時と同じように、テストファイルを右クリックからdebugとかでできる。
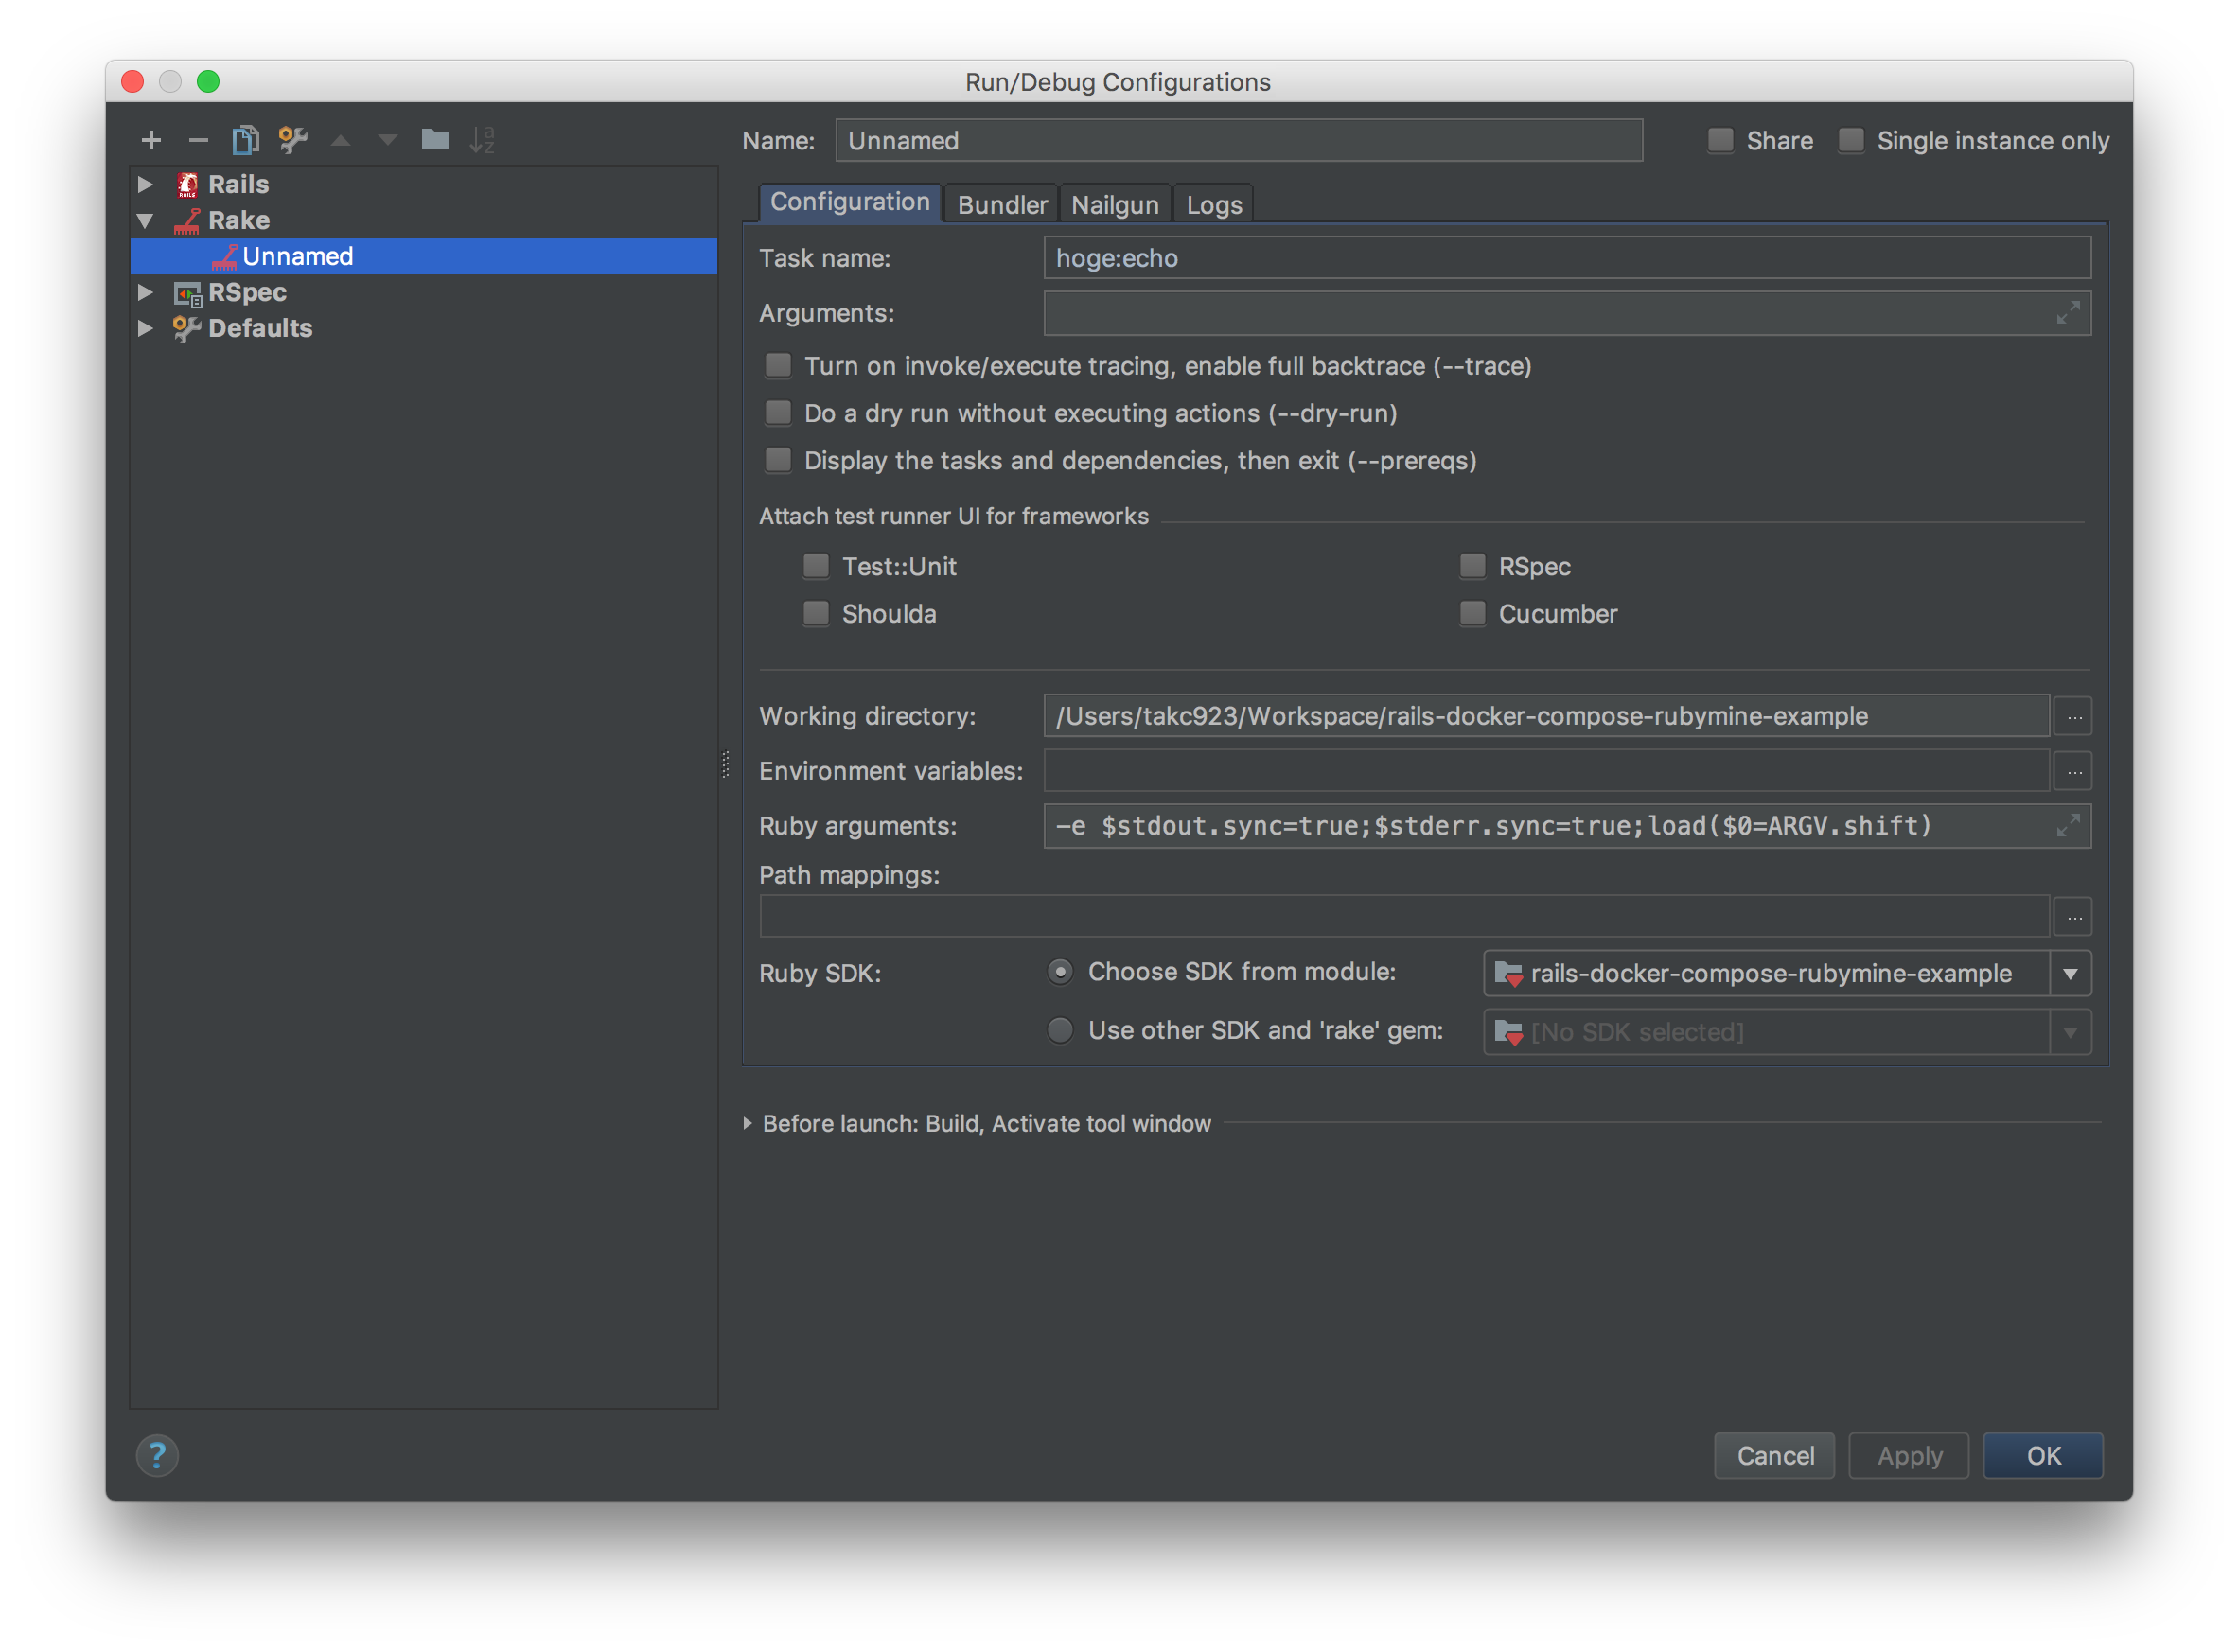
rake taskも普通に行ける。
Dockerをリモートサーバとしてデバッグする
上記のやり方で済むならそれで良い。上記のやり方だとうまくいかない場合、すごく遅い場合、複数同時に実行したい場合2などは本項のやり方を試すと良い。
ただしこの方法だと僕の環境だとrails serverは何故かこの方法だとブレイクポイントで止まってくれなかった...
やり方は、例えばrake hoge:echoをデバッグしたい場合、以下のコマンドを実行(別のものをデバッグしたい場合はコマンドの最後のrakeコマンドのところだけ書き換える。フルパスじゃないと動かないっぽいので注意。)
$ docker-compose run --rm -p 1234:1234 web \
  env IDE_PROCESS_DISPATCHER='docker.for.mac.host.internal:26162' \
  rdebug-ide --disable-int-handler \
  --evaluation-timeout 10 \
  --rubymine-protocol-extensions \
  --port 1234 \
  --host 0.0.0.0 -- /usr/local/bundle/bin/rake hoge:echo
そうするとデバッガの接続を待ち受ける。
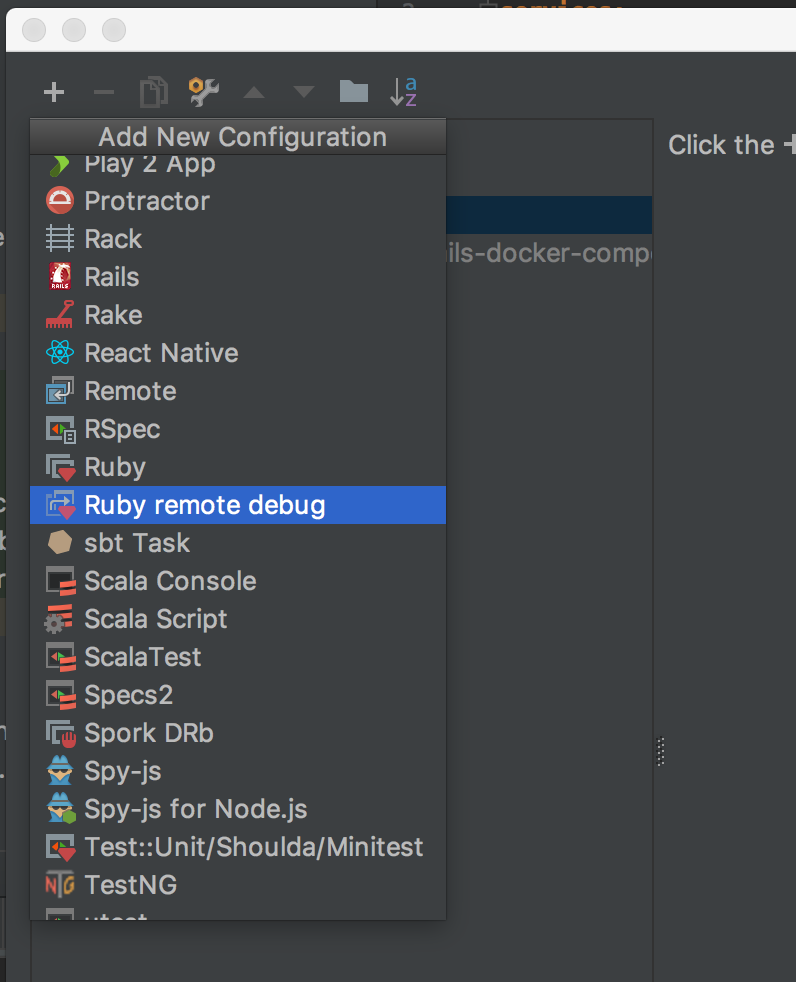
で、IntelliJ側でRuby remote debugのRun configurationを作る。普通にRuby remote debugのRun configurationを作って、Remote root folderとLocal root folderを正しく入力する
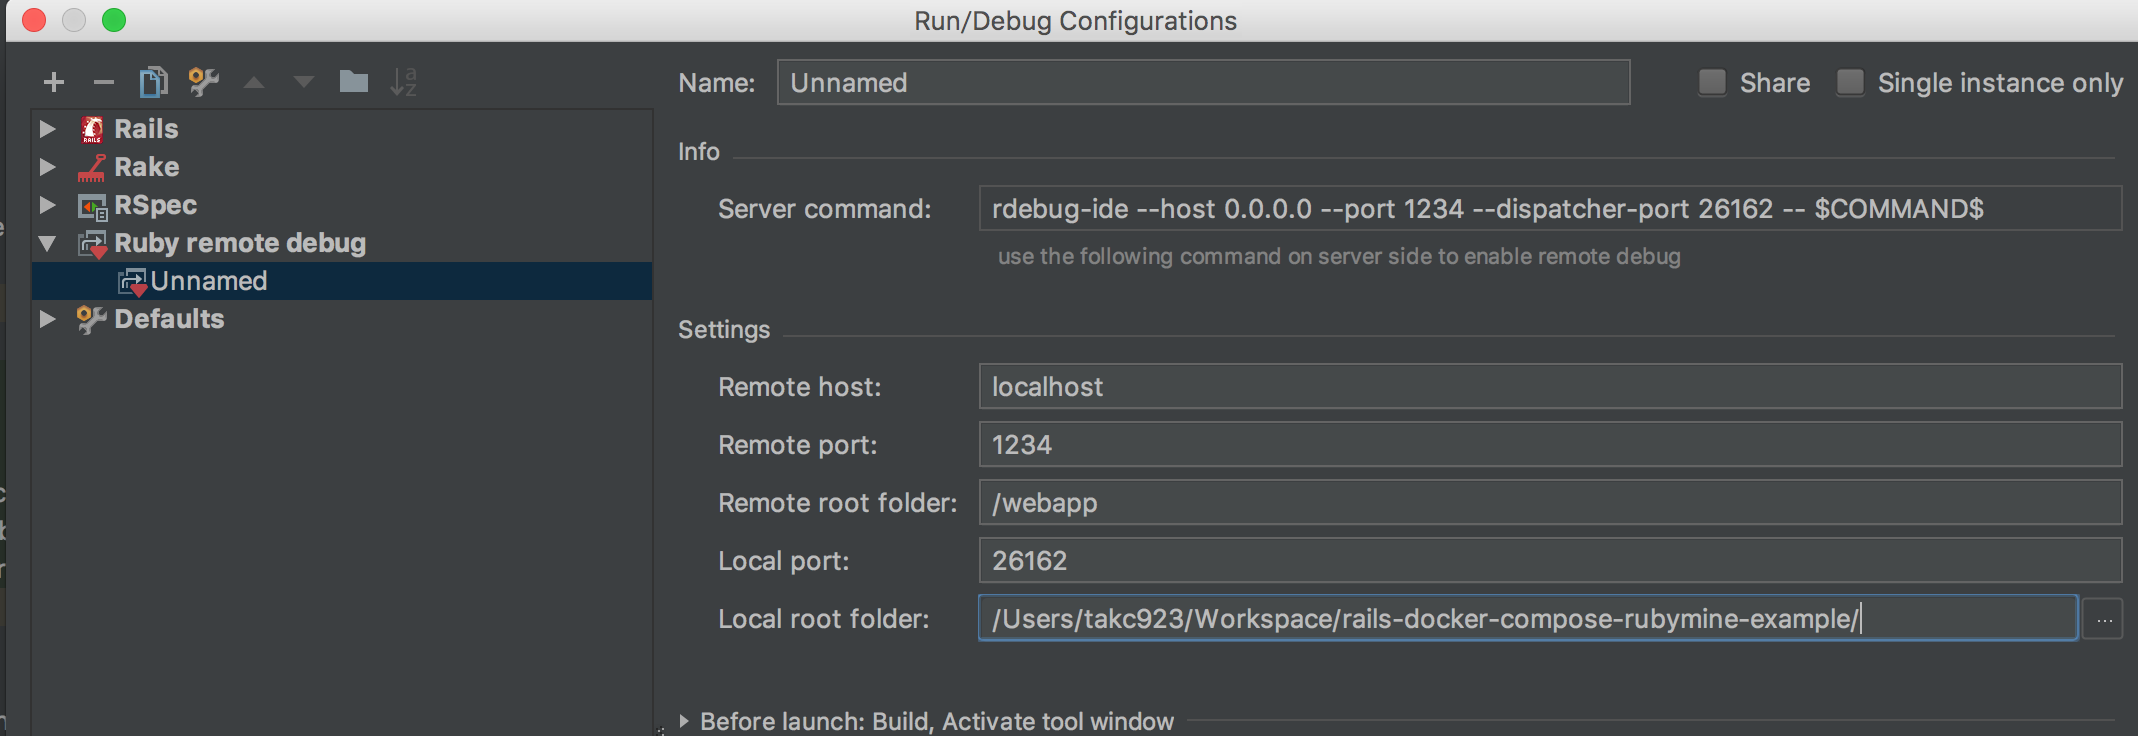
この設定でデバッグ実行すると、IntelliJのデバッガがdockerのプロセスに接続しに行って、デバッグできる。
Mac以外の場合は、試してないけど実行コマンドを以下のように変えたら多分いける(env...の部分がなくなって--dispatcher-port 26162を追加)
$ docker-compose run --rm -p 1234:1234 web \
  rdebug-ide --disable-int-handler \
  --evaluation-timeout 10 \
  --rubymine-protocol-extensions \
  --port 1234 \
  --dispatcher-port 26162 \
  --host 0.0.0.0 -- /usr/local/bundle/bin/rake hoge:echo
トラブルシューティング
"IntelliJから直接デバッグする"でデバッグ実行できない その1
ぼくの環境で起きたんですが、rakeタスクを実行しようとしてこんなエラーが出る場合がありました。
/usr/local/bin/ruby -e at_exit{sleep(1)};$$stdout.sync=true;$$stderr.sync=true;load($$0=ARGV.shift) /opt/project/vendor/bundle/ruby/2.4.0/gems/ruby-debug-ide-0.6.1/bin/rdebug-ide --disable-int-handler --evaluation-timeout 10 --evaluation-control --time-limit 100 --memory-limit 0 --rubymine-protocol-extensions --port 1234 --host 0.0.0.0 --dispatcher-port 26168 -- /opt/project/vendor/bundle/ruby/2.4.0/bin/rails hoge:echo
Fast Debugger (ruby-debug-ide 0.6.1, debase 0.2.2, file filtering is supported) listens on 0.0.0.0:1234
Fast Debugger (ruby-debug-ide 0.6.1, debase 0.2.2, file filtering is supported) listens on 0.0.0.0:41525
1: connection failed(1)
Exception: Connection refused - connect(2) for "172.19.0.1" port 26168
    /opt/project/vendor/bundle/ruby/2.4.0/gems/ruby-debug-ide-0.6.1/lib/ruby-debug-ide.rb:153:in `initialize'
    /opt/project/vendor/bundle/ruby/2.4.0/gems/ruby-debug-ide-0.6.1/lib/ruby-debug-ide.rb:153:in `open'
    /opt/project/vendor/bundle/ruby/2.4.0/gems/ruby-debug-ide-0.6.1/lib/ruby-debug-ide.rb:153:in `block in notify_dispatcher'
    /opt/project/vendor/bundle/ruby/2.4.0/gems/ruby-debug-ide-0.6.1/lib/ruby-debug-ide.rb:151:in `times'
    /opt/project/vendor/bundle/ruby/2.4.0/gems/ruby-debug-ide-0.6.1/lib/ruby-debug-ide.rb:151:in `notify_dispatcher'
    /opt/project/vendor/bundle/ruby/2.4.0/gems/ruby-debug-ide-0.6.1/lib/ruby-debug-ide.rb:116:in `block in start_control'
1: connection failed(2)
Exception: Connection refused - connect(2) for "172.19.0.1" port 26168
    /opt/project/vendor/bundle/ruby/2.4.0/gems/ruby-debug-ide-0.6.1/lib/ruby-debug-ide.rb:153:in `initialize'
    /opt/project/vendor/bundle/ruby/2.4.0/gems/ruby-debug-ide-0.6.1/lib/ruby-debug-ide.rb:153:in `open'
    /opt/project/vendor/bundle/ruby/2.4.0/gems/ruby-debug-ide-0.6.1/lib/ruby-debug-ide.rb:153:in `block in notify_dispatcher'
    /opt/project/vendor/bundle/ruby/2.4.0/gems/ruby-debug-ide-0.6.1/lib/ruby-debug-ide.rb:151:in `times'
    /opt/project/vendor/bundle/ruby/2.4.0/gems/ruby-debug-ide-0.6.1/lib/ruby-debug-ide.rb:151:in `notify_dispatcher'
    /opt/project/vendor/bundle/ruby/2.4.0/gems/ruby-debug-ide-0.6.1/lib/ruby-debug-ide.rb:116:in `block in start_control'
1: connection failed(3)
Exception: Connection refused - connect(2) for "172.19.0.1" port 26168
    /opt/project/vendor/bundle/ruby/2.4.0/gems/ruby-debug-ide-0.6.1/lib/ruby-debug-ide.rb:153:in `initialize'
    /opt/project/vendor/bundle/ruby/2.4.0/gems/ruby-debug-ide-0.6.1/lib/ruby-debug-ide.rb:153:in `open'
    /opt/project/vendor/bundle/ruby/2.4.0/gems/ruby-debug-ide-0.6.1/lib/ruby-debug-ide.rb:153:in `block in notify_dispatcher'
    /opt/project/vendor/bundle/ruby/2.4.0/gems/ruby-debug-ide-0.6.1/lib/ruby-debug-ide.rb:151:in `times'
    /opt/project/vendor/bundle/ruby/2.4.0/gems/ruby-debug-ide-0.6.1/lib/ruby-debug-ide.rb:151:in `notify_dispatcher'
    /opt/project/vendor/bundle/ruby/2.4.0/gems/ruby-debug-ide-0.6.1/lib/ruby-debug-ide.rb:116:in `block in start_control'
これ、ぼくの理解で何が起きてるか解説しようとすると、デバッグとMacのdockerの仕組みを知る必要があります。デバッグは多分以下のような仕組みで実行されてます。
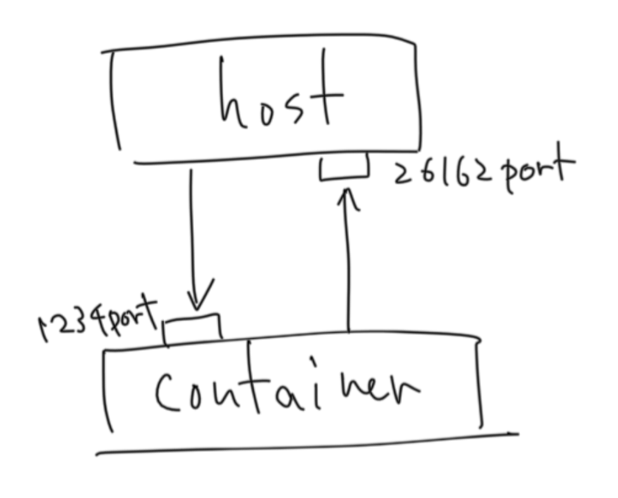
ですが、Macの場合、Dockerが軽量Linux内で実行されているので、間に1層増えます。
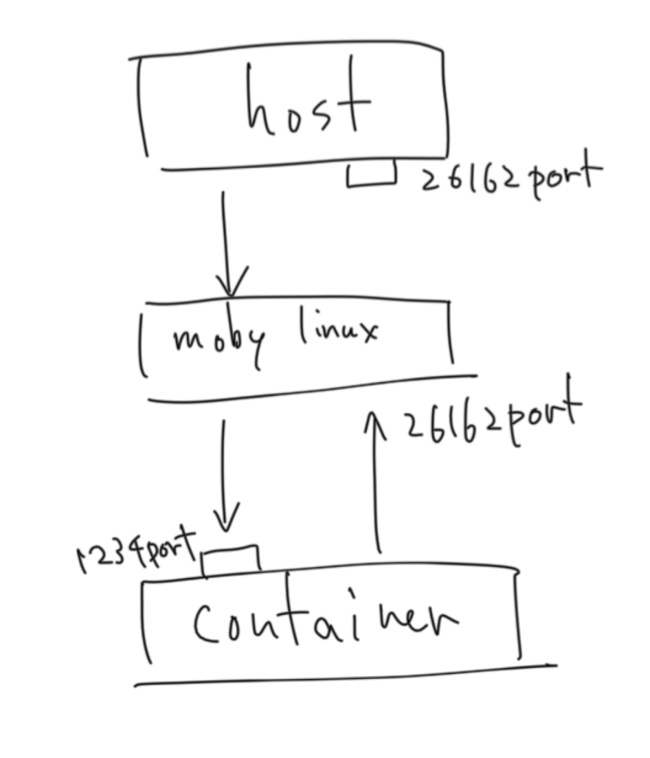
この時containerがhostにつなぎに行こうとするんですが、containerは1234portに繋ぎに来たIPアドレスの26162portめがけてリクエストを飛ばすが、それはmoby linuxのIPアドレスになっていてhostにまで届かない、ということで上記のようなエラーになってるようなんです。
で、rdebug-ideのオプションを見ても、hostに繋ぎに行く時のIPアドレスまで指定できなさそうだったんですが、rdebug-ideのソースコードを読んでみるとオプションとは別に環境変数からIPアドレスとportを取得しているのを見つけたので、"Dockerをリモートサーバとしてデバッグする"時のコマンドが... env IDE_PROCESS_DISPATCHER='docker.for.mac.host.internal:26162' rdebug-ide ...となってるわけです。で、仕組みが分かったところでどうしたらいいんだってなると、今の所"IntelliJから直接デバッグする"を諦めて"Dockerをリモートサーバとしてデバッグする"で妥協する以外わからないです。
あとじゃあなんで他は上手くいくのか、っていうのもよくわかんなかったです。
参考: https://docs.docker.com/docker-for-mac/networking/#known-limitations-use-cases-and-workarounds
"IntelliJから直接デバッグする"でデバッグ実行できない その2
こんなエラーになる場合
/usr/local/bin/ruby -e at_exit{sleep(1)};$$stdout.sync=true;$$stderr.sync=true;load($$0=ARGV.shift) /opt/project/vendor/bundle/ruby/2.2.0/gems/ruby-debug-ide-0.6.0/bin/rdebug-ide --disable-int-handler --evaluation-timeout 10 --evaluation-control --time-limit 100 --memory-limit 0 --rubymine-protocol-extensions --port 1234 --host 0.0.0.0 --dispatcher-port 26168 -- /opt/project/bin/rails server -b 0.0.0.0 -p 3000 -e development
Using ruby-debug-base 0.2.2
Usage: rdebug-ide is supposed to be called from RDT, NetBeans, RubyMine, or
       the IntelliJ IDEA Ruby plugin.  The command line interface to
       ruby-debug is rdebug.

Options:
    -h, --host HOST                  Host name used for remote debugging
    -p, --port PORT                  Port used for remote debugging
        --dispatcher-port PORT       Port used for multi-process debugging dispatcher
        --evaluation-timeout TIMEOUT evaluation timeout in seconds (default: 10)
        --stop                       stop when the script is loaded
    -x, --trace                      turn on line tracing
    -l, --load-mode                  load mode (experimental)
    -d, --debug                      Debug self - prints information for debugging ruby-debug itself
        --xml-debug                  Debug self - sends information <message>s for debugging ruby-debug itself
    -I, --include PATH               Add PATH to $LOAD_PATH
        --keep-frame-binding         Keep frame bindings
        --disable-int-handler        Disables interrupt signal handler
        --rubymine-protocol-extensions
                                     Enable all RubyMine-specific incompatible protocol extensions
        --catchpoint-deleted-event   Enable chatchpointDeleted event
        --value-as-nested-element    Allow to pass variable's value as nested element instead of attribute

Common options:
    -v, --version                    Show version

invalid option: --evaluation-control

Process finished with exit code 1
ruby-debug-ideのバージョンが古いので0.6.1にあげる。
ブレイクポイントでエラーになる
ブレイクポイントでこんなエラーが出る場合
NoMethodError (undefined method `+' for nil:NilClass):
  app/controllers/visitors_controller.rb:3:in `index'


  Rendered /usr/local/bundle/gems/actionpack-4.2.5/lib/action_dispatch/middleware/templates/rescues/_source.erb (29.6ms)
  Rendered /usr/local/bundle/gems/actionpack-4.2.5/lib/action_dispatch/middleware/templates/rescues/_trace.html.erb (6.9ms)
  Rendered /usr/local/bundle/gems/actionpack-4.2.5/lib/action_dispatch/middleware/templates/rescues/_request_and_response.html.erb (25.3ms)
  Rendered /usr/local/bundle/gems/actionpack-4.2.5/lib/action_dispatch/middleware/templates/rescues/diagnostics.html.erb within rescues/layout (104.0ms)
byebug系とrdebug-ideの相性が悪いっぽいので、byebug系のgem(特にpry-byebug)をGemfileから削除する。