はじめに
この記事では、2022年MLB大谷翔平投手のSweeper投球データをPythonを用いて加工、可視化を行います。
Sweeperは大谷投手の最も得意な変化球の一つであり、今回はそのSweeperの球速と横の変化量を分析していきます。
必要なライブラリのインポート
まず、必要なライブラリをインポートします。
import pandas as pd
import matplotlib.pyplot as plt
import numpy as np
データの読み込み
次に、分析に使用するデータを読み込みます。データはCSV形式で既に取得済みであることを前提とします。
df_2022_ohtani_pitch = pd.read_csv('data/2022_MLB_大谷翔平投手の投球データ.csv')
データの前処理
データを分析するために、必要なカラムを選択し、読みやすい単位に変換します。ここでは、player_name(投手名)、game_date(試合日時)、events(イベント)、pfx_x(横の変化量[cm])、release_speed(球速[km/h])、pitch_name(変化球名)のカラムを選択し、pfx_xをインチからセンチに、release_speedをマイルからキロという単位に変換を行います。
df_2022_ohtani_selected_pitch = df_2022_ohtani_pitch[["player_name","game_date","events","pfx_x","release_speed","pitch_name"]]
df_2022_ohtani_selected_pitch = df_2022_ohtani_selected_pitch.rename(columns={"player_name": "投手名", "game_date": "試合日時", "events": "イベント", "pfx_x": "横の変化量[cm]", "release_speed": "球速[km/h]", "pitch_name": "変化球名"})

# インチをセンチに変換
df_2022_ohtani_selected_pitch["横の変化量[cm]"] = df_2022_ohtani_selected_pitch["横の変化量[cm]"] * 30.48
# マイルをキロに変換
df_2022_ohtani_selected_pitch["球速[km/h]"] = df_2022_ohtani_selected_pitch["球速[km/h]"] * 1.60934
以下のコードを実行します。
df_2022_ohtani_selected_pitch.head()
加工したデータフレームの中身は以下のようになっている想定です。
| 投手名 | 試合日時 | イベント | 横の変化量[cm] | 球速[km/h] | 変化球名 |
|---|---|---|---|---|---|
| Ohtani, Shohei | 2022-10-05 | strikeout | 38.1000 | 136.311098 | Sweeper |
| Ohtani, Shohei | 2022-10-05 | NaN | 42.9768 | 135.023626 | Sweeper |
| Ohtani, Shohei | 2022-10-05 | NaN | 38.4048 | 135.828296 | Sweeper |
| Ohtani, Shohei | 2022-10-05 | sac_fly | 28.3464 | 119.573962 | Curveball |
| Ohtani, Shohei | 2022-10-05 | double | 32.9184 | 137.759504 | Sweeper |
データの可視化
以下のコードで可視化を行います。今回は変化球がSweeperのときを分析するので、変化球名が"Sweeper"のみデータを抽出し、イベントがホームラン、三塁打、二塁打、一塁打、およびその他(イベントがアウト)のときのデータをプロットします。
# Sweeperのデータを抽出
df_sweeper = df_2022_ohtani_selected_pitch[df_2022_ohtani_selected_pitch['変化球名'] == 'Sweeper']

# ホームラン、三塁打、二塁打、一塁打以外のイベントを含むデータを抽出
df_cleaned = df_sweeper.dropna(subset=['イベント'])

df_other_events = df_cleaned[~df_cleaned['イベント'].isin(['home_run', 'triple', 'double', 'single', 'caught_stealing_2b', 'fielders_choice_out', 'field_error', 'walk', 'hit_by_pitch'])]

# グラフの作成
plt.scatter(df_cleaned[df_cleaned['イベント'] == 'home_run']['球速[km/h]'], df_cleaned[df_cleaned['イベント'] == 'home_run']['横の変化量[cm]'], marker='s', color='red', label='ホームラン')
plt.scatter(df_cleaned[df_cleaned['イベント'] == 'triple']['球速[km/h]'], df_cleaned[df_cleaned['イベント'] == 'triple']['横の変化量[cm]'], marker='s', color='orange', label='三塁打')
plt.scatter(df_cleaned[df_cleaned['イベント'] == 'double']['球速[km/h]'], df_cleaned[df_cleaned['イベント'] == 'double']['横の変化量[cm]'], marker='^', color='blue', label='二塁打')
plt.scatter(df_cleaned[df_cleaned['イベント'] == 'single']['球速[km/h]'], df_cleaned[df_cleaned['イベント'] == 'single']['横の変化量[cm]'], marker='v', color='green', label='一塁打')

# その他のイベントを含むマーカーでプロット(小さめの点)
plt.scatter(df_other_events['球速[km/h]'], df_other_events['横の変化量[cm]'], marker='o', color='gray', s=8, label='その他(アウト)')

# 横の変化量の中央値を計算
median_horizontal_movement = df_cleaned['横の変化量[cm]'].median()

# 四分位数を計算
q1 = np.percentile(df_cleaned['横の変化量[cm]'], 25)
q3 = np.percentile(df_cleaned['横の変化量[cm]'], 75)

# 中央値と四分位数をグラフ上に表示
plt.text(0.95, 0.85, f'Median: {median_horizontal_movement:.2f} cm',
         horizontalalignment='right', verticalalignment='top', transform=plt.gca().transAxes)
plt.text(0.95, 0.80, f'Q1: {q1:.2f} cm',
         horizontalalignment='right', verticalalignment='top', transform=plt.gca().transAxes)
plt.text(0.95, 0.75, f'Q3: {q3:.2f} cm',
         horizontalalignment='right', verticalalignment='top', transform=plt.gca().transAxes)

# 中央値と四分位数に対応する線を引く
plt.axhline(y=median_horizontal_movement, color='black', linestyle='--')
plt.axhline(y=q1, color='gray', linestyle='--')
plt.axhline(y=q3, color='gray', linestyle='--')

plt.xlabel('球速[km/h]')
plt.ylabel('横の変化量[cm]')
plt.title('2022年MLB大谷翔平投手のSweeper投球データ')
plt.legend()
plt.show()
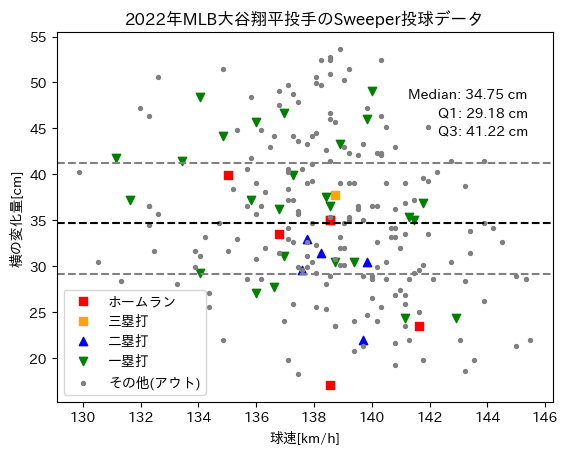
上記のコードを実行すると、以下のグラフが描画されます。ホームラン、三塁打、二塁打、一塁打を含むデータをそれぞれ異なる色やマーカーでプロットしました。また、分布の四分位数(Q1、中央値、Q3)を計算し、グラフ上に表示しました。

分布のQ3(第3四分位数)にあたる横の変化量は41cmくらいですが、やはりSweeperの横の変化量が大きくなると、この範囲には長打はなく、ヒットしかありません。また、アウトが多く、あまり打たれていないことがわかります。
終わりに
今回実施した結果から、Sweeperの横の変化量と被打率の因果推論を行いたいと思いました。そのときに使えそうな手法として傾向マッチングという手法が適当できそうであったので、次回はそれをPythonで実施していきます。