■はじめに
最近、仕事場で見える化が話題になっているので、自宅で技術検証してみました。
【参考】
・[http://acro-engineer.hatenablog.com/entry/2016/10/27/165342]
■環境
・CentOS7.4
→SELinuxとFirewalldは無効
・elasticsearch-5.6.8
・kibana-5.6.8
・logstash-5.6.8-1
■インストール
・リポジトリ登録
# vi /etc/yum.repos.d/elastic.repo
[elasticsearch-5.x]
name=Elasticsearch repository for 5.x packages
baseurl=https://artifacts.elastic.co/packages/5.x/yum
gpgcheck=1
gpgkey=https://artifacts.elastic.co/GPG-KEY-elasticsearch
enabled=1
autorefresh=1
type=rpm-md
・インストール
# yum install java-1.8.0-openjdk-devel
# rpm --import https://artifacts.elastic.co/GPG-KEY-elasticsearch
# yum install elasticsearch
# yum install kibana
# yum install logstash
■初期設定
・kibanaの外部接続を許可
vi /etc/kibana/kibana.yml
server.host: "0.0.0.0"
・自動起動
systemctl start elasticsearch
systemctl start kibana
systemctl start logstash
systemctl enable elasticsearch
systemctl enable kibana
systemctl enable logstash
■デモ(apacheのログ解析)
・設定
# vi /etc/logstash/conf.d/10_apache_access_log.conf
input {
 file {
 path => "/var/log/httpd/access_log"
 start_position => "beginning"
 }
}

filter {
 grok {
 match => { "message" => "%{COMBINEDAPACHELOG}" }
 }
 date {
 match => ["timestamp", "dd/MMM/YYYY:HH:mm:ss Z"]
 }
 geoip {
 source => ["clientip"]
 }
}

output {
 elasticsearch {
 hosts => ["localhost:9200"]
 index => "access_log-%{+YYYYMMdd}"
 }
}
・取り込み
# /usr/share/logstash/bin/logstash -f /etc/logstash/conf.d/10_apache_access_log.conf
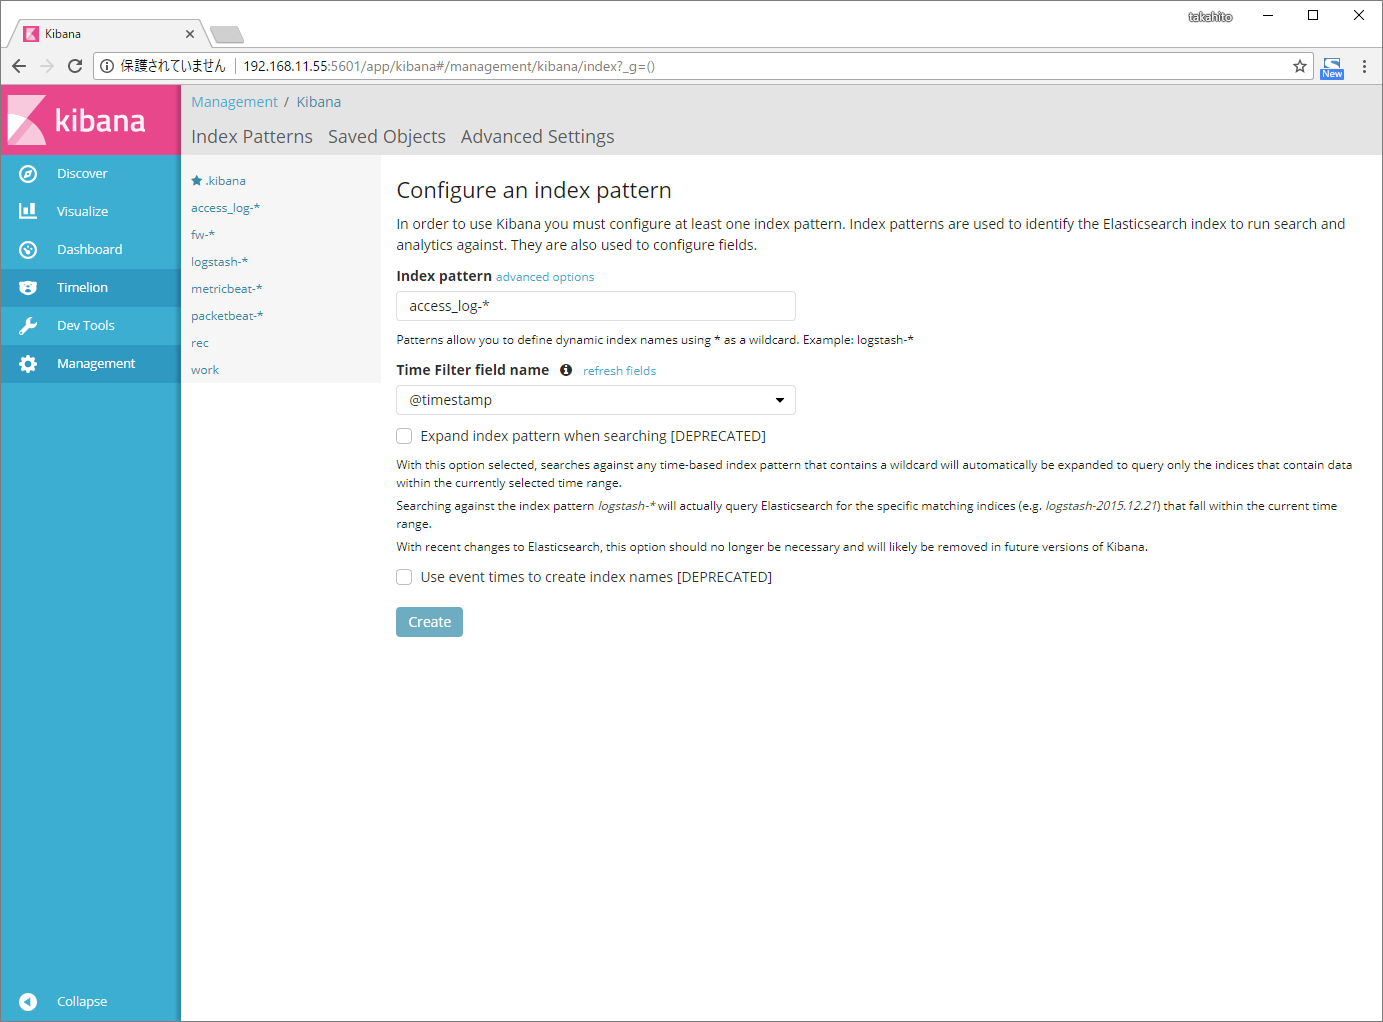
・インデックス登録
1.kibanaを開く
http://<サーバーIP>:5601
2.「management」「Index Patterns」「Create Index Pattern」と順に開く
3.次を入力して「create」をクリック
| 項目 | 値 |
|---|---|
| Index pattern | access_log-* |
| Time Filter field name | @timestamp |
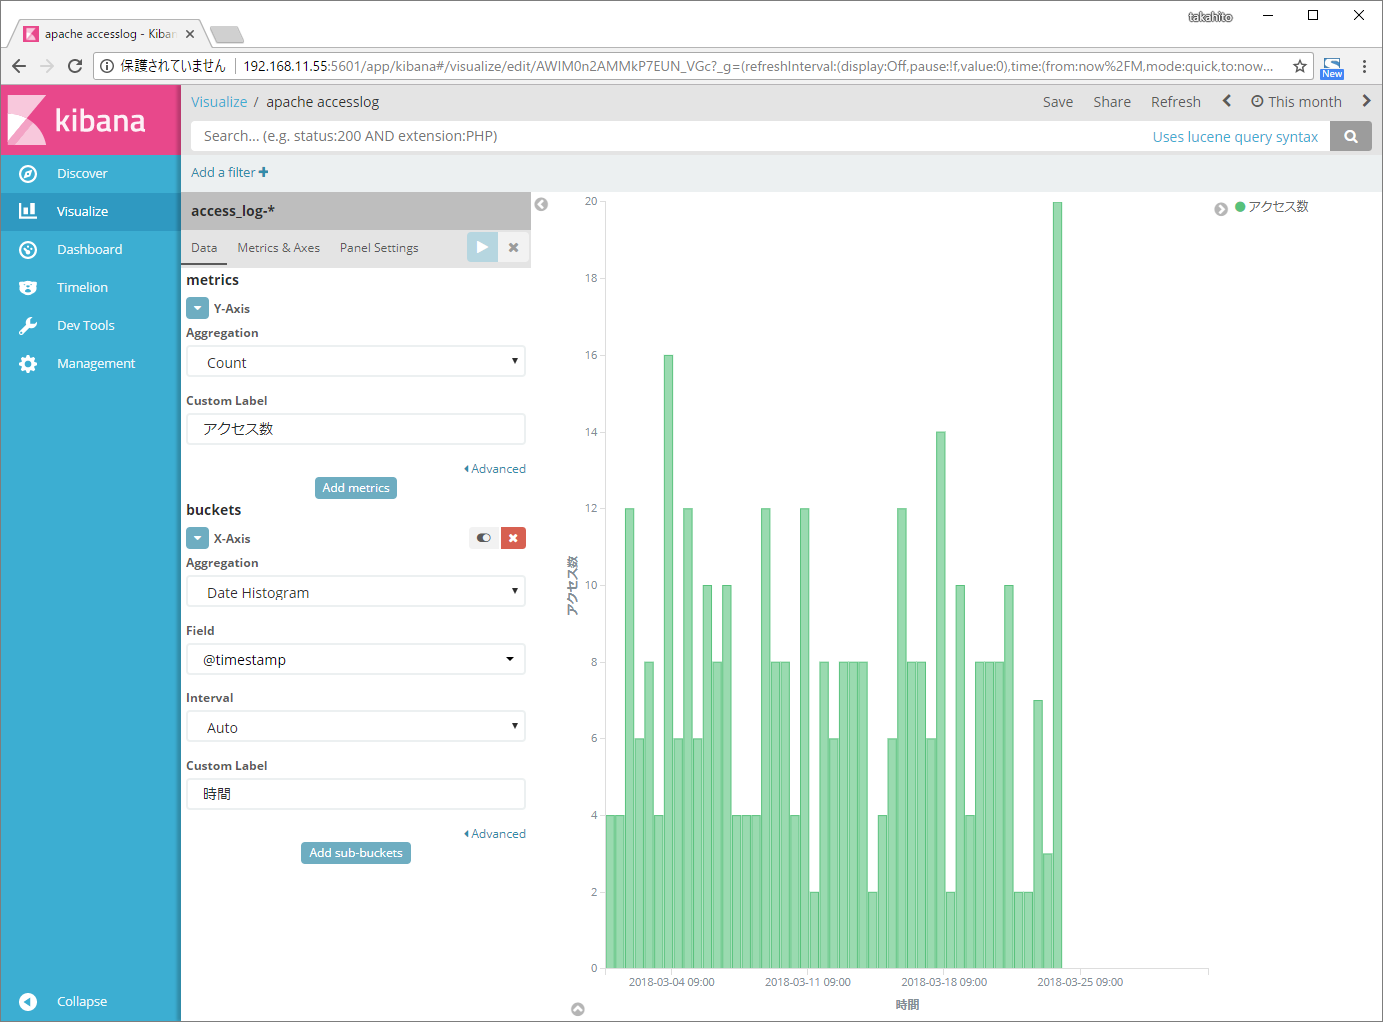
・グラフ作成
1.「Visualize」「+」「Vertical Bar」「access_log-* 」と順に開く
2.次を入力してすると・・・・グラフの完成
| 大項目 | 中項目 | 値 |
|---|---|---|
| Y-Axis | Aggregation | Count |
| Custom Label | アクセス数 | |
| X-Axis | Aggregation | Date Histogram |
| Field | @timestamp | |
| Interval | Auto | |
| Custom Label | 時間 |
以上です。