サポートベクターマシン
タイタニック生存
import pandas as pd
from pandas import DataFrame
import numpy as np
import matplotlib.pyplot as plt
import seaborn as sns
%matplotlib inline
# データの確認
titanic_df = pd.read_csv('data/titanic_train.csv')
titanic_df.head()
| PassengerId | Survived | Pclass | Name | Sex | Age | SibSp | Parch | Ticket | Fare | Cabin | Embarked | |
|---|---|---|---|---|---|---|---|---|---|---|---|---|
| 0 | 1 | 0 | 3 | Braund, Mr. Owen Harris | male | 22.0 | 1 | 0 | A/5 21171 | 7.2500 | NaN | S |
| 1 | 2 | 1 | 1 | Cumings, Mrs. John Bradley (Florence Briggs Th... | female | 38.0 | 1 | 0 | PC 17599 | 71.2833 | C85 | C |
| 2 | 3 | 1 | 3 | Heikkinen, Miss. Laina | female | 26.0 | 0 | 0 | STON/O2. 3101282 | 7.9250 | NaN | S |
| 3 | 4 | 1 | 1 | Futrelle, Mrs. Jacques Heath (Lily May Peel) | female | 35.0 | 1 | 0 | 113803 | 53.1000 | C123 | S |
| 4 | 5 | 0 | 3 | Allen, Mr. William Henry | male | 35.0 | 0 | 0 | 373450 | 8.0500 | NaN | S |
titanic_df.info()
<class 'pandas.core.frame.DataFrame'>
RangeIndex: 891 entries, 0 to 890
Data columns (total 12 columns):
PassengerId    891 non-null int64
Survived       891 non-null int64
Pclass         891 non-null int64
Name           891 non-null object
Sex            891 non-null object
Age            714 non-null float64
SibSp          891 non-null int64
Parch          891 non-null int64
Ticket         891 non-null object
Fare           891 non-null float64
Cabin          204 non-null object
Embarked       889 non-null object
dtypes: float64(2), int64(5), object(5)
memory usage: 83.6+ KB
# 不要(と思われる)列の削除
titanic_df.drop(['PassengerId', 'Name', 'Ticket', 'Cabin'], axis=1, inplace=True)
titanic_df.head()
| Survived | Pclass | Sex | Age | SibSp | Parch | Fare | Embarked | |
|---|---|---|---|---|---|---|---|---|
| 0 | 0 | 3 | male | 22.0 | 1 | 0 | 7.2500 | S |
| 1 | 1 | 1 | female | 38.0 | 1 | 0 | 71.2833 | C |
| 2 | 1 | 3 | female | 26.0 | 0 | 0 | 7.9250 | S |
| 3 | 1 | 1 | female | 35.0 | 1 | 0 | 53.1000 | S |
| 4 | 0 | 3 | male | 35.0 | 0 | 0 | 8.0500 | S |
# Ageカラムのnullを中央値で補完
titanic_df['AgeFill'] = titanic_df['Age'].fillna(titanic_df['Age'].mean())
titanic_df['Gender'] = titanic_df['Sex'].map({'female': 0, 'male': 1}).astype(int)
titanic_df['Pclass_Gender'] = titanic_df['Pclass'] + titanic_df['Gender']
titanic_df.head()
| Survived | Pclass | Sex | Age | SibSp | Parch | Fare | Embarked | AgeFill | Gender | Pclass_Gender | |
|---|---|---|---|---|---|---|---|---|---|---|---|
| 0 | 0 | 3 | male | 22.0 | 1 | 0 | 7.2500 | S | 22.0 | 1 | 4 |
| 1 | 1 | 1 | female | 38.0 | 1 | 0 | 71.2833 | C | 38.0 | 0 | 1 |
| 2 | 1 | 3 | female | 26.0 | 0 | 0 | 7.9250 | S | 26.0 | 0 | 3 |
| 3 | 1 | 1 | female | 35.0 | 1 | 0 | 53.1000 | S | 35.0 | 0 | 1 |
| 4 | 0 | 3 | male | 35.0 | 0 | 0 | 8.0500 | S | 35.0 | 1 | 4 |
titanic_df = titanic_df.drop(['Pclass', 'Sex', 'Gender','Age'], axis=1)
titanic_df.head()
| Survived | SibSp | Parch | Fare | Embarked | AgeFill | Pclass_Gender | |
|---|---|---|---|---|---|---|---|
| 0 | 0 | 1 | 0 | 7.2500 | S | 22.0 | 4 |
| 1 | 1 | 1 | 0 | 71.2833 | C | 38.0 | 1 |
| 2 | 1 | 0 | 0 | 7.9250 | S | 26.0 | 3 |
| 3 | 1 | 1 | 0 | 53.1000 | S | 35.0 | 1 |
| 4 | 0 | 0 | 0 | 8.0500 | S | 35.0 | 4 |
data2 = titanic_df.loc[:, ["AgeFill", "Pclass_Gender"]].values
label2 = titanic_df.loc[:,["Survived"]].values
from sklearn import svm
svm = svm.LinearSVC()
svm.fit(data2, label2)
C:\Users\taka0\Anaconda3\lib\site-packages\sklearn\utils\validation.py:761: DataConversionWarning: A column-vector y was passed when a 1d array was expected. Please change the shape of y to (n_samples, ), for example using ravel().
  y = column_or_1d(y, warn=True)
C:\Users\taka0\Anaconda3\lib\site-packages\sklearn\svm\base.py:922: ConvergenceWarning: Liblinear failed to converge, increase the number of iterations.
  "the number of iterations.", ConvergenceWarning)


LinearSVC(C=1.0, class_weight=None, dual=True, fit_intercept=True,
     intercept_scaling=1, loss='squared_hinge', max_iter=1000,
     multi_class='ovr', penalty='l2', random_state=None, tol=0.0001,
     verbose=0)
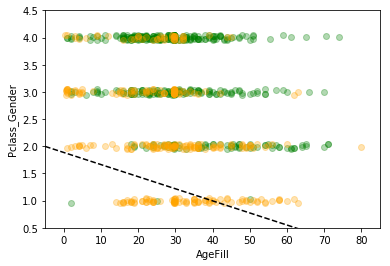
print(svm.__dict__)
{'dual': True, 'tol': 0.0001, 'C': 1.0, 'multi_class': 'ovr', 'fit_intercept': True, 'intercept_scaling': 1, 'class_weight': None, 'verbose': 0, 'random_state': None, 'max_iter': 1000, 'penalty': 'l2', 'loss': 'squared_hinge', 'classes_': array([0, 1], dtype=int64), 'coef_': array([[-0.0222477 , -0.55251333]]), 'intercept_': array([1.88600009]), 'n_iter_': 1000}
h = 0.02
xmin, xmax = -5, 85
ymin, ymax = 0.5, 4.5

index_survived = titanic_df[titanic_df["Survived"]==0].index
index_notsurvived = titanic_df[titanic_df["Survived"]==1].index

fig, ax = plt.subplots()
levels = np.linspace(0, 1.0)

sc = ax.scatter(titanic_df.loc[index_survived, 'AgeFill'],
                titanic_df.loc[index_survived, 'Pclass_Gender']+(np.random.rand(len(index_survived))-0.5)*0.1,
                color='g', label='Not Survived', alpha=0.3)
sc = ax.scatter(titanic_df.loc[index_notsurvived, 'AgeFill'],
                titanic_df.loc[index_notsurvived, 'Pclass_Gender']+(np.random.rand(len(index_notsurvived))-0.5)*0.1,
                color='orange', label='Survived', alpha=0.3)

ax.set_xlabel('AgeFill')
ax.set_ylabel('Pclass_Gender')
ax.set_xlim(xmin, xmax)
ax.set_ylim(ymin, ymax)
# fig.colorbar(contour)

x1 = xmin
x2 = xmax
y1= (svm.intercept_[0] + svm.coef_[0][0]*xmin)
y2=(svm.intercept_[0] + svm.coef_[0][0]*xmax)

ax.plot([x1, x2] ,[y1, y2], 'k--')
[<matplotlib.lines.Line2D at 0x254ff8cad68>]
import numpy as np
import matplotlib.pyplot as plt
from sklearn import svm, datasets

def make_meshgrid(x, y, h=.02):
    """Create a mesh of points to plot in

    Parameters
    ----------
    x: data to base x-axis meshgrid on
    y: data to base y-axis meshgrid on
    h: stepsize for meshgrid, optional

    Returns
    -------
    xx, yy : ndarray
    """
    x_min, x_max = x.min() - 1, x.max() + 1
    y_min, y_max = y.min() - 1, y.max() + 1
    xx, yy = np.meshgrid(np.arange(x_min, x_max, h),
                         np.arange(y_min, y_max, h))
    return xx, yy


def plot_contours(ax, clf, xx, yy, **params):
    """Plot the decision boundaries for a classifier.

    Parameters
    ----------
    ax: matplotlib axes object
    clf: a classifier
    xx: meshgrid ndarray
    yy: meshgrid ndarray
    params: dictionary of params to pass to contourf, optional
    """
    Z = clf.predict(np.c_[xx.ravel(), yy.ravel()])
    Z = Z.reshape(xx.shape)
    out = ax.contourf(xx, yy, Z, **params)
    return out


# import some data to play with
iris = datasets.load_iris()
# Take the first two features. We could avoid this by using a two-dim dataset
X = data2
y = label2

# we create an instance of SVM and fit out data. We do not scale our
# data since we want to plot the support vectors
C = 1.0  # SVM regularization parameter
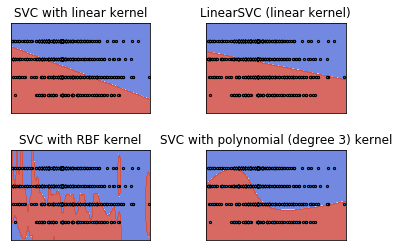
models = (svm.SVC(kernel='linear', C=C),
          svm.LinearSVC(C=C),
          svm.SVC(kernel='rbf', gamma=0.7, C=C),
          svm.SVC(kernel='poly', degree=3, C=C))
models = (clf.fit(X, y) for clf in models)

# title for the plots
titles = ('SVC with linear kernel',
          'LinearSVC (linear kernel)',
          'SVC with RBF kernel',
          'SVC with polynomial (degree 3) kernel')

# Set-up 2x2 grid for plotting.
fig, sub = plt.subplots(2, 2)
plt.subplots_adjust(wspace=0.4, hspace=0.4)

X0, X1 = X[:, 0], X[:, 1]
xx, yy = make_meshgrid(X0, X1)

for clf, title, ax in zip(models, titles, sub.flatten()):
    plot_contours(ax, clf, xx, yy, cmap=plt.cm.coolwarm, alpha=0.8)
   # ax.scatter(X0, X1, c=y, cmap=plt.cm.coolwarm, s=20, edgecolors='k')
    ax.scatter(X0, X1, s=5, edgecolors='k')
    ax.set_xlim(xx.min(), xx.max())
    ax.set_ylim(yy.min(), yy.max())
#     ax.set_xlabel('Sepal length')
#     ax.set_ylabel('Sepal width')
    ax.set_xticks(())
    ax.set_yticks(())
    ax.set_title(title)

plt.show()
C:\Users\taka0\Anaconda3\lib\site-packages\sklearn\utils\validation.py:761: DataConversionWarning: A column-vector y was passed when a 1d array was expected. Please change the shape of y to (n_samples, ), for example using ravel().
  y = column_or_1d(y, warn=True)
C:\Users\taka0\Anaconda3\lib\site-packages\sklearn\utils\validation.py:761: DataConversionWarning: A column-vector y was passed when a 1d array was expected. Please change the shape of y to (n_samples, ), for example using ravel().
  y = column_or_1d(y, warn=True)
C:\Users\taka0\Anaconda3\lib\site-packages\sklearn\svm\base.py:922: ConvergenceWarning: Liblinear failed to converge, increase the number of iterations.
  "the number of iterations.", ConvergenceWarning)
C:\Users\taka0\Anaconda3\lib\site-packages\sklearn\utils\validation.py:761: DataConversionWarning: A column-vector y was passed when a 1d array was expected. Please change the shape of y to (n_samples, ), for example using ravel().
  y = column_or_1d(y, warn=True)
C:\Users\taka0\Anaconda3\lib\site-packages\sklearn\utils\validation.py:761: DataConversionWarning: A column-vector y was passed when a 1d array was expected. Please change the shape of y to (n_samples, ), for example using ravel().
  y = column_or_1d(y, warn=True)
C:\Users\taka0\Anaconda3\lib\site-packages\sklearn\svm\base.py:196: FutureWarning: The default value of gamma will change from 'auto' to 'scale' in version 0.22 to account better for unscaled features. Set gamma explicitly to 'auto' or 'scale' to avoid this warning.
  "avoid this warning.", FutureWarning)
MNIST
from sklearn import datasets, model_selection, svm, metrics

mnist = datasets.fetch_mldata('MNIST original', data_home='./data/')

print(type(mnist))
print(mnist.keys())
<class 'sklearn.utils.Bunch'>
dict_keys(['DESCR', 'COL_NAMES', 'target', 'data'])


C:\Users\taka0\Anaconda3\lib\site-packages\sklearn\utils\deprecation.py:77: DeprecationWarning: Function fetch_mldata is deprecated; fetch_mldata was deprecated in version 0.20 and will be removed in version 0.22
  warnings.warn(msg, category=DeprecationWarning)
C:\Users\taka0\Anaconda3\lib\site-packages\sklearn\utils\deprecation.py:77: DeprecationWarning: Function mldata_filename is deprecated; mldata_filename was deprecated in version 0.20 and will be removed in version 0.22
  warnings.warn(msg, category=DeprecationWarning)
mnist_data = mnist.data / 255
mnist_label = mnist.target
data_train, data_test, label_train, label_test = model_selection.train_test_split(mnist_data, mnist_label, test_size=0.2)
clf = svm.SVC(gamma='auto')
clf.fit(data_train, label_train)
pre = clf.predict(data_test)

ac_score = metrics.accuracy_score(label_test, pre)
print(ac_score)
0.9399285714285714
IRIS Dataset
import numpy as np
import matplotlib.pyplot as plt
from sklearn import svm

# we create 40 separable points
np.random.seed(0)
X = np.r_[np.random.randn(20, 2) - [2, 2], np.random.randn(20, 2) + [2, 2]]
Y = [0] * 20 + [1] * 20

# figure number
fignum = 1

# fit the model
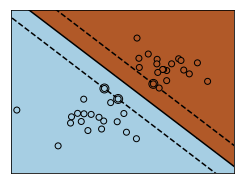
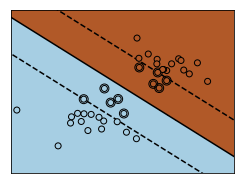
for name, penalty in (('unreg', 1), ('reg', 0.05)):

    clf = svm.SVC(kernel='linear', C=penalty)
    clf.fit(X, Y)

    # get the separating hyperplane
    w = clf.coef_[0]
    a = -w[0] / w[1]
    xx = np.linspace(-5, 5)
    yy = a * xx - (clf.intercept_[0]) / w[1]

    # plot the parallels to the separating hyperplane that pass through the
    # support vectors (margin away from hyperplane in direction
    # perpendicular to hyperplane). This is sqrt(1+a^2) away vertically in
    # 2-d.
    margin = 1 / np.sqrt(np.sum(clf.coef_ ** 2))
    yy_down = yy - np.sqrt(1 + a ** 2) * margin
    yy_up = yy + np.sqrt(1 + a ** 2) * margin

    # plot the line, the points, and the nearest vectors to the plane
    plt.figure(fignum, figsize=(4, 3))
    plt.clf()
    plt.plot(xx, yy, 'k-')
    plt.plot(xx, yy_down, 'k--')
    plt.plot(xx, yy_up, 'k--')

    plt.scatter(clf.support_vectors_[:, 0], clf.support_vectors_[:, 1], s=80,
                facecolors='none', zorder=10, edgecolors='k')
    plt.scatter(X[:, 0], X[:, 1], c=Y, zorder=10, cmap=plt.cm.Paired,
                edgecolors='k')

    plt.axis('tight')
    x_min = -4.8
    x_max = 4.2
    y_min = -6
    y_max = 6

    XX, YY = np.mgrid[x_min:x_max:200j, y_min:y_max:200j]
    Z = clf.predict(np.c_[XX.ravel(), YY.ravel()])

    # Put the result into a color plot
    Z = Z.reshape(XX.shape)
    plt.figure(fignum, figsize=(4, 3))
    plt.pcolormesh(XX, YY, Z, cmap=plt.cm.Paired)

    plt.xlim(x_min, x_max)
    plt.ylim(y_min, y_max)

    plt.xticks(())
    plt.yticks(())
    fignum = fignum + 1

plt.show()
import numpy as np
import matplotlib.pyplot as plt
from matplotlib.colors import Normalize

from sklearn.svm import SVC
from sklearn.preprocessing import StandardScaler
from sklearn.datasets import load_iris
from sklearn.model_selection import StratifiedShuffleSplit
from sklearn.model_selection import GridSearchCV


# Utility function to move the midpoint of a colormap to be around
# the values of interest.

class MidpointNormalize(Normalize):

    def __init__(self, vmin=None, vmax=None, midpoint=None, clip=False):
        self.midpoint = midpoint
        Normalize.__init__(self, vmin, vmax, clip)

    def __call__(self, value, clip=None):
        x, y = [self.vmin, self.midpoint, self.vmax], [0, 0.5, 1]
        return np.ma.masked_array(np.interp(value, x, y))

# #############################################################################
# Load and prepare data set
#
# dataset for grid search

iris = load_iris()
X = iris.data
y = iris.target

# Dataset for decision function visualization: we only keep the first two
# features in X and sub-sample the dataset to keep only 2 classes and
# make it a binary classification problem.

X_2d = X[:, :2]
X_2d = X_2d[y > 0]
y_2d = y[y > 0]
y_2d -= 1

# It is usually a good idea to scale the data for SVM training.
# We are cheating a bit in this example in scaling all of the data,
# instead of fitting the transformation on the training set and
# just applying it on the test set.

scaler = StandardScaler()
X = scaler.fit_transform(X)
X_2d = scaler.fit_transform(X_2d)

# #############################################################################
# Train classifiers
#
# For an initial search, a logarithmic grid with basis
# 10 is often helpful. Using a basis of 2, a finer
# tuning can be achieved but at a much higher cost.

C_range = np.logspace(-2, 10, 13)
gamma_range = np.logspace(-9, 3, 13)
param_grid = dict(gamma=gamma_range, C=C_range)
cv = StratifiedShuffleSplit(n_splits=5, test_size=0.2, random_state=42)
grid = GridSearchCV(SVC(), param_grid=param_grid, cv=cv)
grid.fit(X, y)

print("The best parameters are %s with a score of %0.2f"
      % (grid.best_params_, grid.best_score_))

# Now we need to fit a classifier for all parameters in the 2d version
# (we use a smaller set of parameters here because it takes a while to train)

C_2d_range = [1e-2, 1, 1e2]
gamma_2d_range = [1e-1, 1, 1e1]
classifiers = []
for C in C_2d_range:
    for gamma in gamma_2d_range:
        clf = SVC(C=C, gamma=gamma)
        clf.fit(X_2d, y_2d)
        classifiers.append((C, gamma, clf))

# #############################################################################
# Visualization
#
# draw visualization of parameter effects

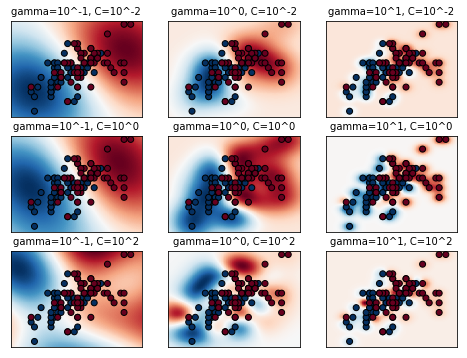
plt.figure(figsize=(8, 6))
xx, yy = np.meshgrid(np.linspace(-3, 3, 200), np.linspace(-3, 3, 200))
for (k, (C, gamma, clf)) in enumerate(classifiers):
    # evaluate decision function in a grid
    Z = clf.decision_function(np.c_[xx.ravel(), yy.ravel()])
    Z = Z.reshape(xx.shape)

    # visualize decision function for these parameters
    plt.subplot(len(C_2d_range), len(gamma_2d_range), k + 1)
    plt.title("gamma=10^%d, C=10^%d" % (np.log10(gamma), np.log10(C)),
              size='medium')

    # visualize parameter's effect on decision function
    plt.pcolormesh(xx, yy, -Z, cmap=plt.cm.RdBu)
    plt.scatter(X_2d[:, 0], X_2d[:, 1], c=y_2d, cmap=plt.cm.RdBu_r,
                edgecolors='k')
    plt.xticks(())
    plt.yticks(())
    plt.axis('tight')

scores = grid.cv_results_['mean_test_score'].reshape(len(C_range),
                                                     len(gamma_range))

# Draw heatmap of the validation accuracy as a function of gamma and C
#
# The score are encoded as colors with the hot colormap which varies from dark
# red to bright yellow. As the most interesting scores are all located in the
# 0.92 to 0.97 range we use a custom normalizer to set the mid-point to 0.92 so
# as to make it easier to visualize the small variations of score values in the
# interesting range while not brutally collapsing all the low score values to
# the same color.

plt.figure(figsize=(8, 6))
plt.subplots_adjust(left=.2, right=0.95, bottom=0.15, top=0.95)
plt.imshow(scores, interpolation='nearest', cmap=plt.cm.hot,
           norm=MidpointNormalize(vmin=0.2, midpoint=0.92))
plt.xlabel('gamma')
plt.ylabel('C')
plt.colorbar()
plt.xticks(np.arange(len(gamma_range)), gamma_range, rotation=45)
plt.yticks(np.arange(len(C_range)), C_range)
plt.title('Validation accuracy')
plt.show()
The best parameters are {'C': 1.0, 'gamma': 0.1} with a score of 0.97
