今日は、論文で使えるような表を作っていく。
Excelでもできるはずだが、Rだと計算→表作成がほぼ同時にできるので、慣れれば楽だと思う。
(R3.6.2使用)
サンプルデータの取得##
またまたirisデータでやります。
# irisの取り込み
data <- iris
# 確認
head(iris)
 Sepal.Length Sepal.Width Petal.Length Petal.Width Species
1          5.1         3.5          1.4         0.2  setosa
2          4.9         3.0          1.4         0.2  setosa
3          4.7         3.2          1.3         0.2  setosa
4          4.6         3.1          1.5         0.2  setosa
5          5.0         3.6          1.4         0.2  setosa
6          5.4         3.9          1.7         0.4  setosa
パッケージの読み込み##
if (!require(qwraps2))install.packages('qwraps2')
if (!require(sjPlot))install.packages('sjPlot')
if (!require(tidyr))install.packages('tidyr')
if (!require(dplyr))install.packages('dplyr')
library(qwraps2)
library(sjPlot)
library(tidyr)
library(dplyr)
表の作成##
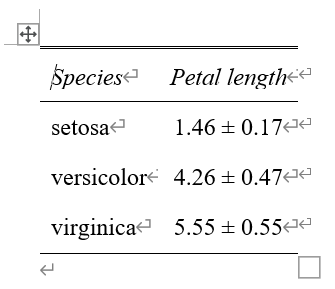
まずは1因子の表から。
Speciesでグループ分けして、平均と標準誤差を出す。dplyrのgroup_by関数とsummarise関数(この2つはネットに情報けっこう有)、qwraps2のmean_sd関数(比較的マイナーかも)を組み合わせる。
# 平均と標準誤差の計算
sdtable <- data %>%
  dplyr::group_by(Species) %>% #Speciesでグループ分け
  dplyr::summarise("Petal length" = mean_sd(Petal.Length, #Petal.Lengthを用いた
                                            denote_sd = "pm", #pmは±の意味
                                            markup = getOption("qwraps2_markup", "markdown"))) #記法の指定(詳細は趣旨とずれるので割愛)

# Wordに出力
tab_df(sdtable,  file = "1way.doc")
ちなみに、"pm"のところを"paren"にすると、1.46 (0.17)のような表記になる。
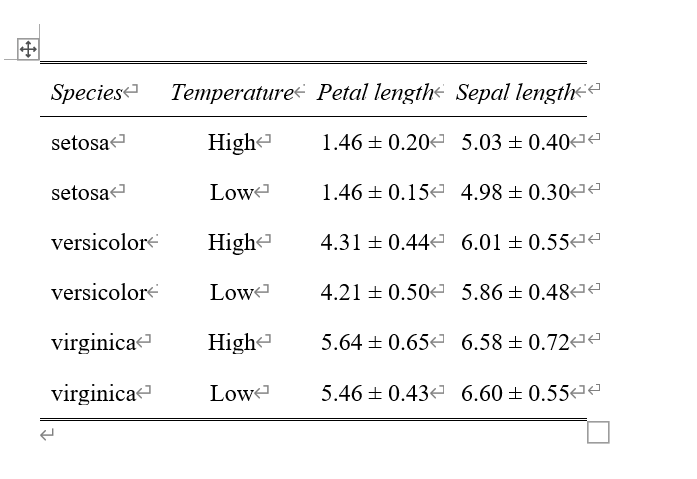
続いて2因子の表を作る。Two-way的な表。
irisデータはSpecies以外に因子となりうるものがないので、ここは説明のために架空のTemperatureというデータの列を作る。
各Species(50サンプルずつ)につき、25個をHigh、もう25個をLowとした(テキトーで特に意味はない)。
# Temperatureの作成
data$Temperature <- c(rep("High", 25), rep("Low", 25), rep("High", 25), rep("Low", 25), rep("High", 25), rep("Low", 25))

# さっきのの応用
sdtable <- data %>%
  dplyr::group_by(Species, Temperature) %>%
  dplyr::summarise("Petal length" = mean_sd(Petal.Length,
                                            denote_sd = "pm",
                                            markup = getOption("qwraps2_markup", "markdown")),
                   "Sepal length" = mean_sd(Sepal.Length,
                                            denote_sd = "pm",
                                            markup = getOption("qwraps2_markup", "markdown")))

# Wordに出力
tab_df(sdtable, , file = "2waytable.doc")
ついでにSepal.Lengthの列も増やしておいたので、もしデータをたくさん並べたい時はこれでできることがわかる。
良い感じではあるが、ちょっと見づらい。
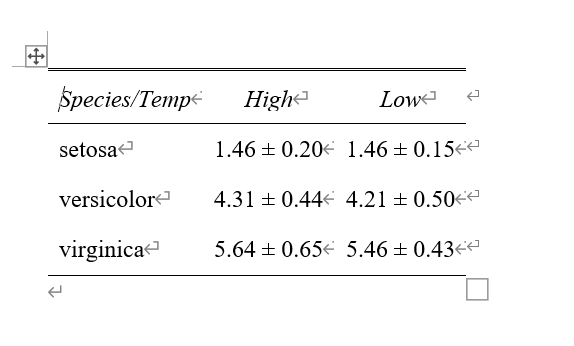
SpeciesとTemperatureを行列に分けることで、見やすくなる。(ややこしいので次は値はPetal.Lengthだけにしておく)。
sdtablespread <-
  sdtable %>%
  data.frame %>%
  pivot_wider(id_cols = Species,
              names_from = Temperature,
              values_from = c("Petal.length")
              )
tab_df(sdtablespread,
       col.header = c("Species/Temp", "High", "Low"),
       file = "2way.doc"
       )
ちょっとすっきりした。
Two-way ANOVAの結果を表にする(APAスタイル)
APAスタイルとは、多くの学術論文がこの方法に従って書くようにしてほしいというような、決まりごとのことである。アパホテルではない笑
Wikipedia
まずはパッケージの読み込み
if (!require(apaTables))install.packages('apaTables')
library(apaTables)
if (!require(MBESS))install.packages('MBESS')
library(MBESS)
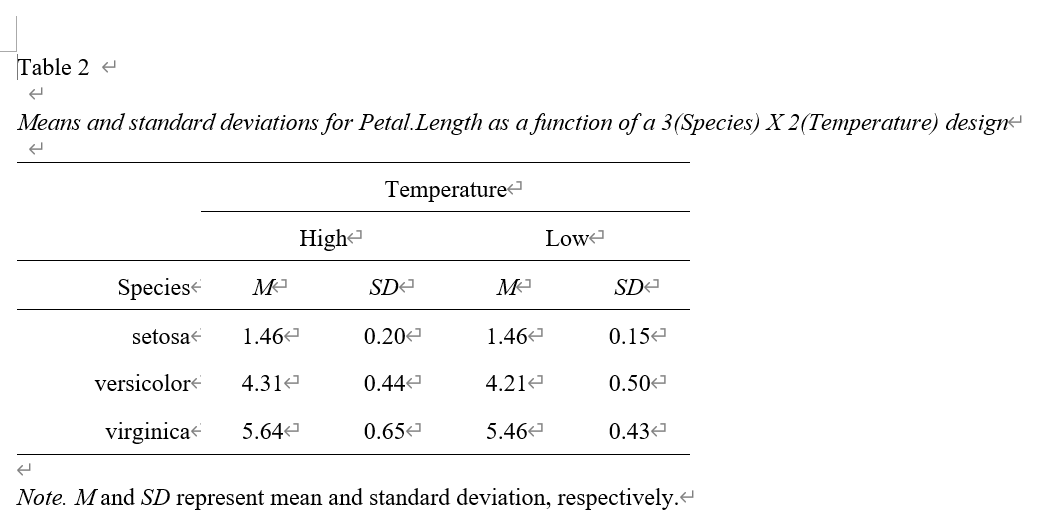
続いて、平均と標準誤差の計算と表の作成(Wordに出力)を一発でやる(Excelより便利じゃないでしょうか?)
apa.2way.table(Species, Temperature, Petal.Length, data,
               filename = "2way2.doc",
               table.number = 2, #出力時のTable番号を指定できる
               show.marginal.means = FALSE #TRUEにすれば、各要素に分けた際の平均を出してくれる
               )
クールですねぇ。Word上では何もいじらずにこんな感じで出てきてくれる。
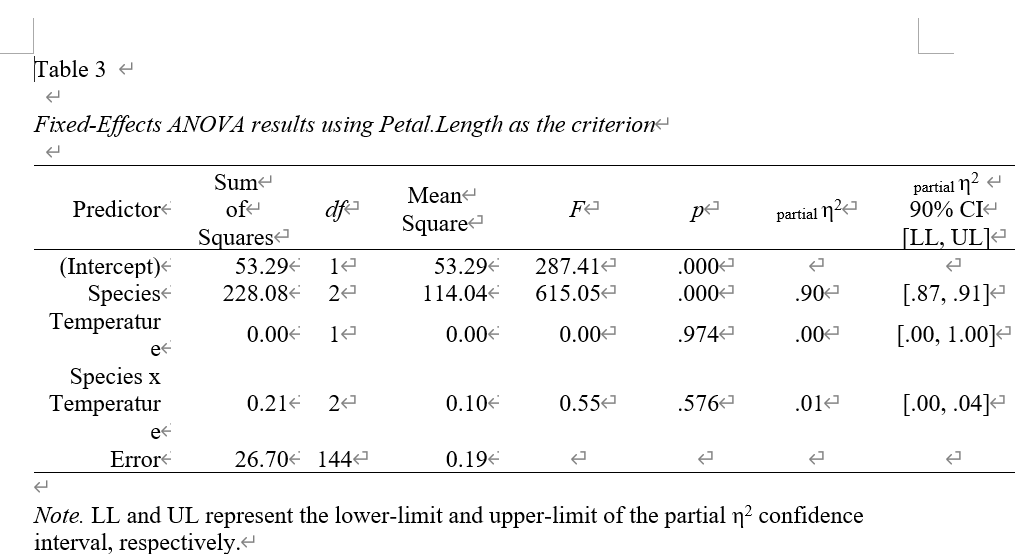
最後に、もろもろのTwo-way ANOVAの計算値を出力させてみる。
# aovでTwo-way ANOVAの計算
dataanova <- aov(Petal.Length ~ Species * Temperature, data = data)

# Wordに出力
apa.aov.table(dataanova,
              file = "aov.doc",
              table.number = 3
              )
Predictorのところの文字(Temperatureとか)が入り切ってないが笑、そのへんはWordでフォントの調整を行うといいと思う。
