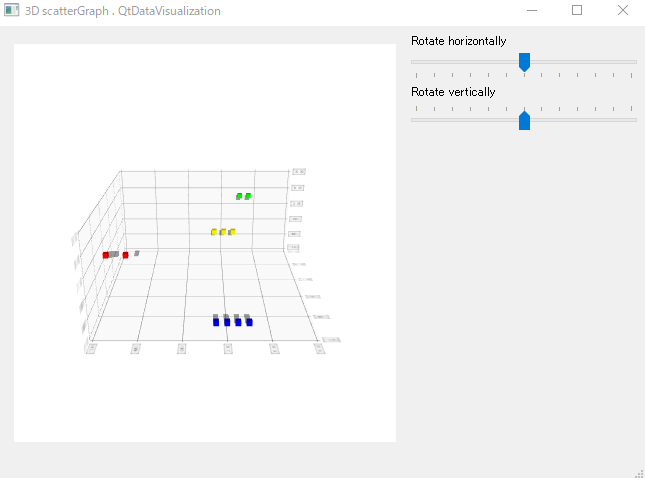
実行サンプル
x, y, z の3次元座標の3Dグラフ 散布図(scatter)を表示する。
各点で、それぞれ違う色にする。
※プログラムのベースは記事:「Qt C++ 3Dグラフ表示 QtDataVisualization」 の通り
https://qiita.com/taiko1/items/8f696e3a58f9ebadf944
※マウス操作でズームのみ可能。
※視点移動(=グラフ回転)はスライダーでする。(マウス操作はできない。)
※今時点のソースコードでは、スライダーを動かすと先にズームしていたのものが
初期の位置に戻ってしまう。
これから調べて、方法がわかれば修正するが
それまでは、まず回転をスライダーでする→ズームするの順番で見たい位置を見る操作になる。
実行環境
windows10
Qt5.9
VisualStudio2019
実行手順
通常通り QtCreatorでコード作成して、実行する。
ソースコード
コードのポイント
■ MainWindow.cpp でのreset でデータ追加され、その後色設定する。
    m_graph->seriesList().at(0)->dataProxy()->resetArray(dataArray);
    m_graph->seriesList().at(0)->setBaseColor(Qt::red); //ポイントの色設定 (単一色の場合)
参考資料
参考:
■ 3D 立方体の自動回転表示 (マウス操作:ズームあり、視点移動なし)
https://github.com/fengfanchen/Qt/tree/master/3D%20move%20rotation
■ 3D objファイルから散布図でデータ表示(マウス操作:ズームあり、視点移動なし)
https://blog.csdn.net/qq78442761/article/details/103678544
https://github.com/fengfanchen/Qt/tree/master/3DScatter%20Demo
■ 参考:Qt付属のExampleコード
・サンプル customplot (マウス操作:ズームあり、視点移動なし?)
・サンプル bars (視点移動=グラフ回転)
↑スライダーで視点移動(マウス操作ではない。)
■ 散布図で各点、色違いでの表示
https://stackoverflow.com/questions/44329125/q3dscatter-how-to-add-a-point-with-a-different-color-to-a-point-cloud
今後の参考予定
■ マウス操作での視点移動のサンプル
見つかっていない。これから調べる。
■ グラフ表示を参考にする
Qt公式 サンプル surface
■ 1つのグラフ領域(Axis)に2つ以上のグラフを描く
→https://forum.qt.io/topic/92510/overlapped-surface3d-and-scatter3d/8
→Qt公式サンプルcustomitems
https://doc.qt.io/archives/qt-5.9/qtdatavisualization-customitems-example.html
→Qt公式サンプルrotation も参考になるかもしれない。