matplotlib 3Dグラフに直方体を描画する
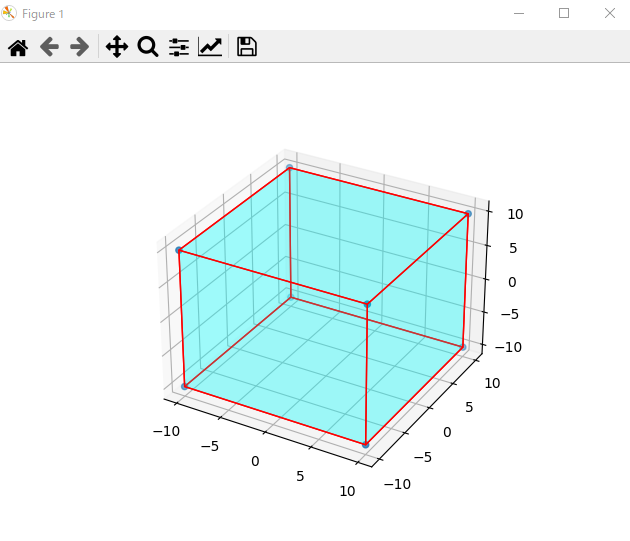
実行サンプル
実行環境
python3.7 window10
実行手順
windowsコマンドラインで python実行
ソースコード
import numpy as np
from mpl_toolkits.mplot3d.art3d import Poly3DCollection, Line3DCollection
import matplotlib.pyplot as plt
points = np.array([[-1, -1, -1],
                  [1, -1, -1 ],
                  [1, 1, -1],
                  [-1, 1, -1],
                  [-1, -1, 1],
                  [1, -1, 1 ],
                  [1, 1, 1],
                  [-1, 1, 1]])
Z = points
Z = 10.0*Z
fig = plt.figure()
ax = fig.add_subplot(111, projection='3d')
r = [-1,1]
X, Y = np.meshgrid(r, r)
ax.scatter3D(Z[:, 0], Z[:, 1], Z[:, 2])
verts = [[Z[0],Z[1],Z[2],Z[3]],
 [Z[4],Z[5],Z[6],Z[7]],
 [Z[0],Z[1],Z[5],Z[4]],
 [Z[2],Z[3],Z[7],Z[6]],
 [Z[1],Z[2],Z[6],Z[5]],
 [Z[4],Z[7],Z[3],Z[0]]]
ax.add_collection3d(Poly3DCollection(verts, facecolors='cyan', linewidths=1, edgecolors='r', alpha=.20))

plt.show()
メモ
matplotlibの以下を使用。
art3d Poly3DCollection
参考資料