目的
- 筆者がjupyter-notebookの使い方を覚えるために記述する
- 様々なデータで応用できるテンプレートとする
- もっと便利なツールあるよね(笑)
内容
実際に使用する際は、parameterとresultの部分を実データに置き換えれば良い
Jupyter-notebookで実行すべし(labでは動かなかった)
setting
import numpy as np
import pandas as pd
import matplotlib.pyplot as plt
from ipywidgets import interact
import seaborn as sns
%matplotlib inline
plt.style.use('bmh')
parameter preparation
# data numbers
n = 10000
# parameter setting
x1 = np.random.randn(n) + 120.0
x2 = 1.3 * np.random.randn(n) + 110.0
x3 = 1.8 * np.random.randn(n) + 100.0
x4 = 0.5 * np.random.randn(n) + 90.0
x5 = 0.2 * np.random.randn(n) + 8.0
x6 = 0.3 * np.random.randn(n) + 70.0
temp_dict = dict(x1=x1, x2=x2, x3=x3, x4=x4, x5=x5, x6=x6)
df = pd.DataFrame(temp_dict)
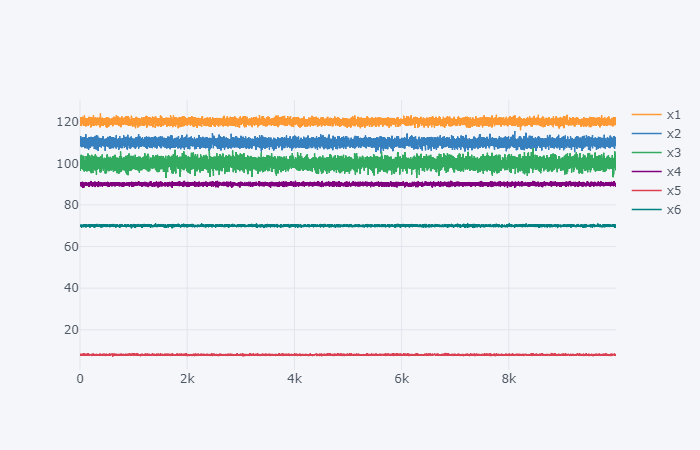
import cufflinks as cf
cf.go_offline()

df.iplot()
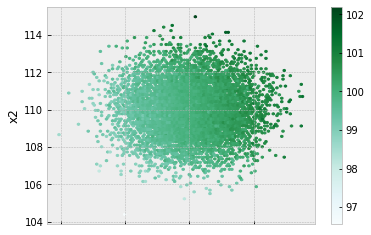
result preparation
result_data = (10 * (x1 - 120) + 0.5 * (x2 - 110) ** 3 - np.exp((x3 - 102)) - 10 * (x4 - 90) + 15 *(x5 - 8.0) + -1 * (x6 - 70.0)) / 30 + 100
sr_res = pd.Series(result_data, name='res')
df_res = df.join(sr_res, how='right')
df_res.plot(kind='hexbin', x='x1', y='x2', C='res')
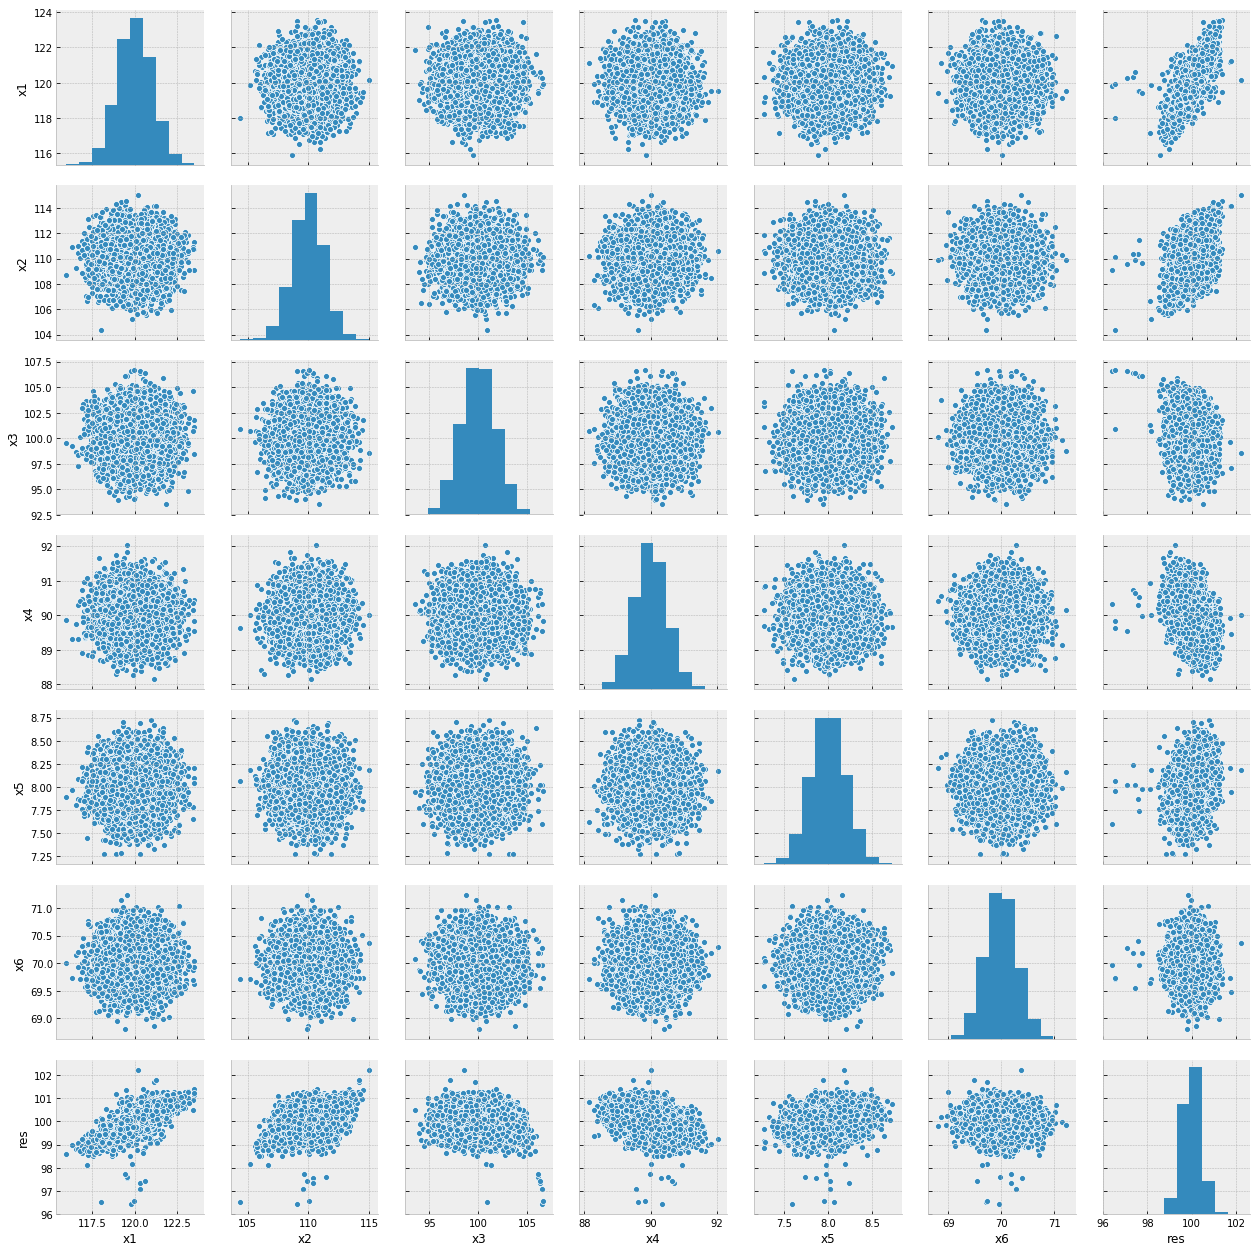
plot
pg = sns.pairplot(df_res)
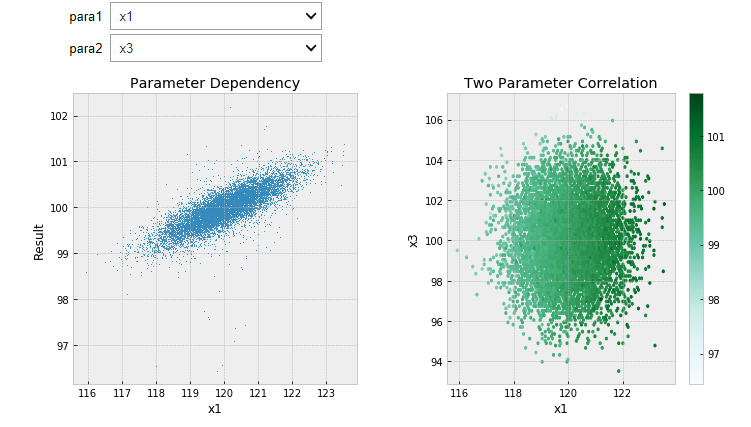
interactive plot
para_list = ['x1', 'x2', 'x3', 'x4', 'x5', 'x6']
import plotly
plotly.offline.init_notebook_mode(connected=False)
@interact(para1=para_list, para2=para_list)
def plot_data(para1, para2):
    fig2, ax = plt.subplots(1,2, figsize=(10,5))
    ax[0].scatter(x=df_res.loc[:, para1], y=df_res.loc[:, 'res'], s=0.3)
    ax[0].set_xlabel(para1)
    ax[0].set_ylabel('Result')
    ax[0].set_title('Parameter Dependency')

    df_res.plot(kind='scatter', x=para1, y=para2, c='res', ax=ax[1], cmap='inferno')
    ax[1].set_xlabel(para1)
    ax[1].set_ylabel(para2)
    ax[1].set_title('Two Parameter Correlation')
    plt.tight_layout(w_pad=5)

    plotly.offline.iplot_mpl(fig2)