はじめに
これはVue Advent Calendar 2019 5日目の記事です。
最近、Vue.jsで集計結果をグラフ描画する機会がありました。
Vue グラフ描画で調べると基本的にCharts.jsが出てきます。
色々、考えt時に、Google chartsが便利だったので紹介したいと思います。
google chartsとは
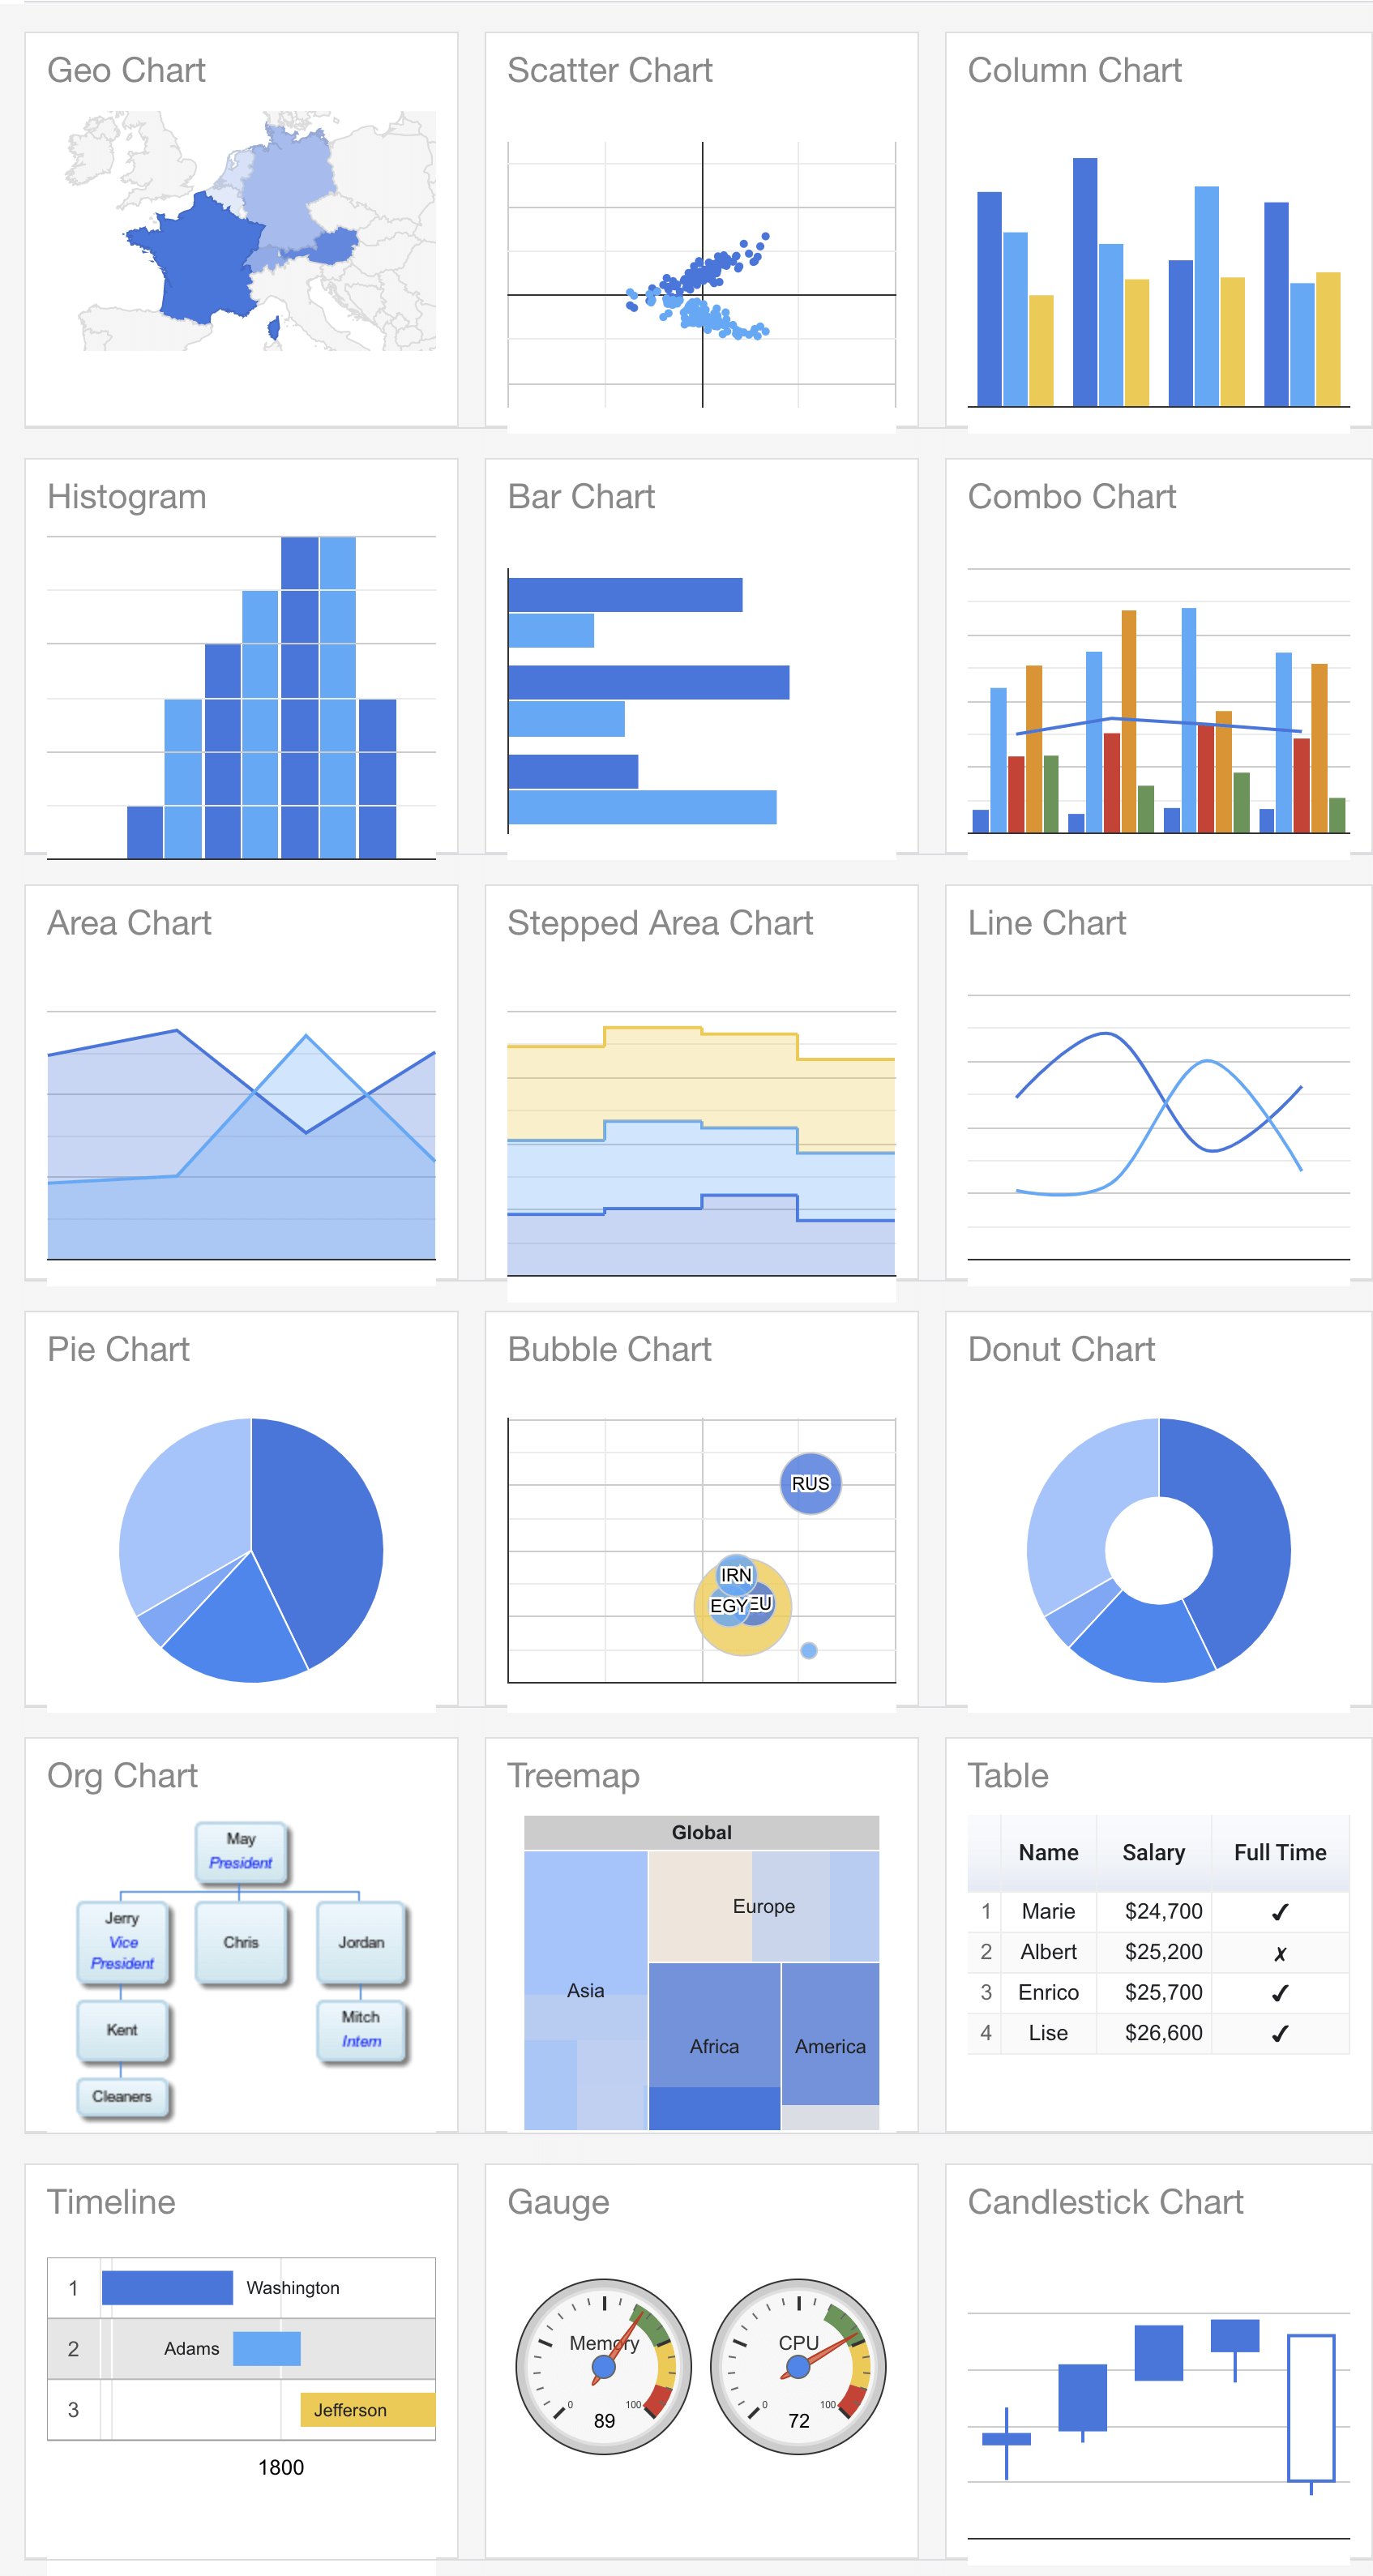
google chartsとは、googleの図表描画ライブラリです。
スプレッドシートとかで使われているグラフを描画できるイメージです。

プロジェクト作成
- 素のVue.jsではなく、Nuxt.jsでやっていたためNuxtでプロジェクト作成
yarn create nuxt-app charts-sample
# yarnを選択
# cssフレームワークはbulmaを選択
cd charts-sample
yarn dev
インストール
Google chartsのVue向けWrapperのvue-google-chartsです。
yarn add vue-google-charts
- iconを読みこませたいので、google iconを追加
nuxt.config.js
(省略)
    link: [
      { rel: 'icon', type: 'image/x-icon', href: '/favicon.ico' },
      // 下記を追加
      { href: 'https://fonts.googleapis.com/icon?family=Material+Icons', rel: 'stylesheet' }
    ]
グラフコンポーネント
- グラフの種類とデータ、オプションを渡してあげると描画してくれるようにしています。

components/atoms/Chart.vue
<template>
  <GChart
    :type="chartType"
    :data="chartData"
    :options="chartOptions"
    :createChart="
      (el, google, type) => {
        return new google.visualization[type](el)
      }
    "
  />
</template>

<script>
import { GChart } from 'vue-google-charts'

export default {
  components: {
    GChart
  },
  props: {
    chartType: {
      type: String,
      default: ''
    },
    chartData: {
      type: Array,
      default: () => {
        return []
      }
    },
    chartOptions: {
      type: Object,
      default: () => {
        return {}
      }
    }
  }
}
</script>
pages/index.vue
<template>
  <div class="container">
    <chart
      :chartType="chartType"
      :chartData="chartData"
      :chartOptions="chartOptions"
    />
  </div>
</template>

<script>
import Chart from '@/components/atoms/Chart.vue'

export default {
  components: {
    Chart,
    Dropdown
  },
  data() {
    return {
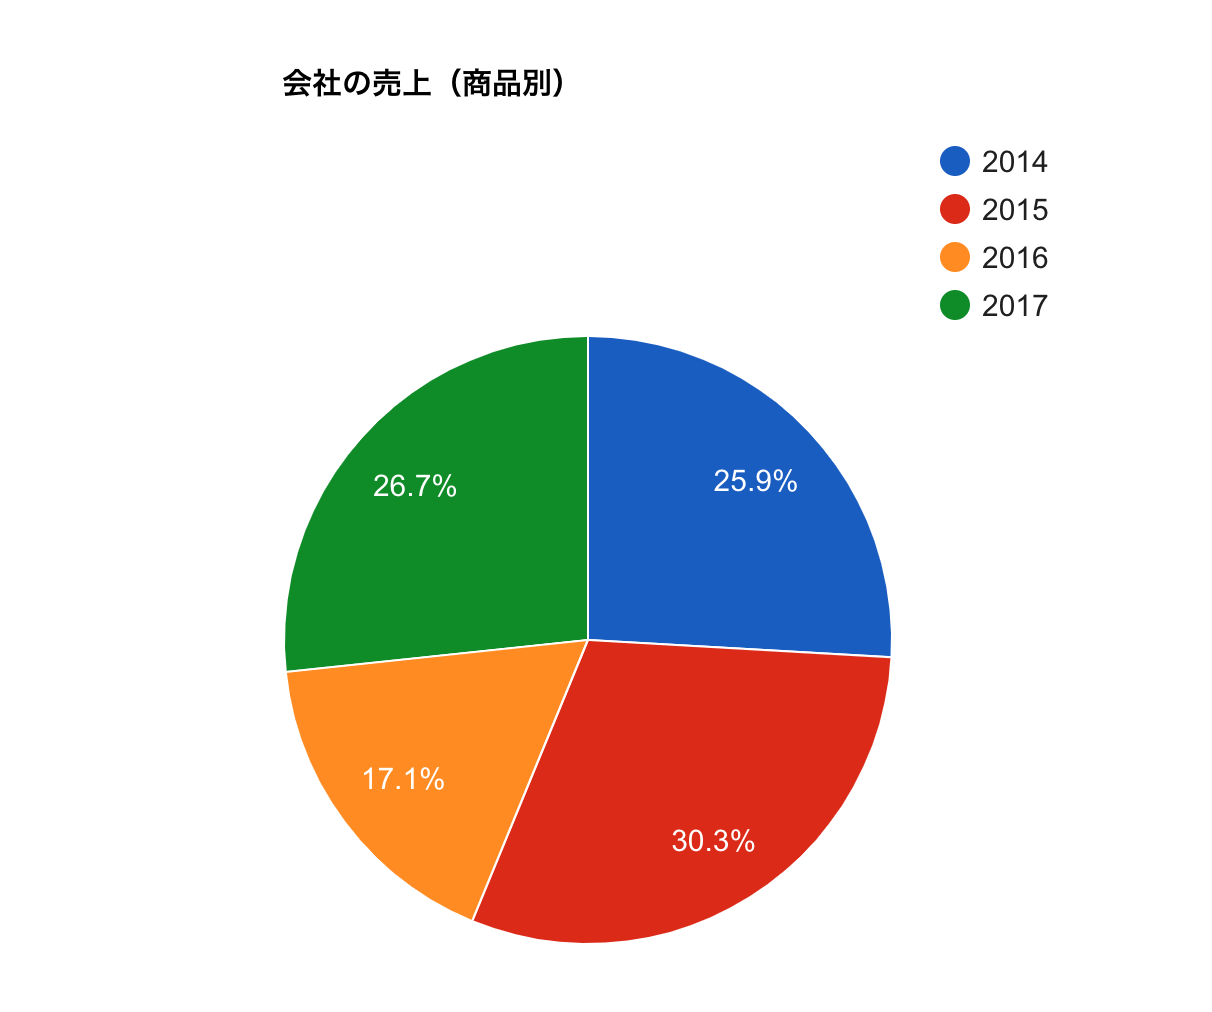
      chartType: 'PieChart',
      chartData: [
        ['年', '売上', '費用', '収益'],
        ['2014', 1000, 400, 200],
        ['2015', 1170, 460, 250],
        ['2016', 660, 1120, 300],
        ['2017', 1030, 540, 350]
      ],
      chartOptions: {
        title: '会社の損益',
        subtitle: '売上',
        width: 500,
        height: 500
      }
    }
  }
}
</script>
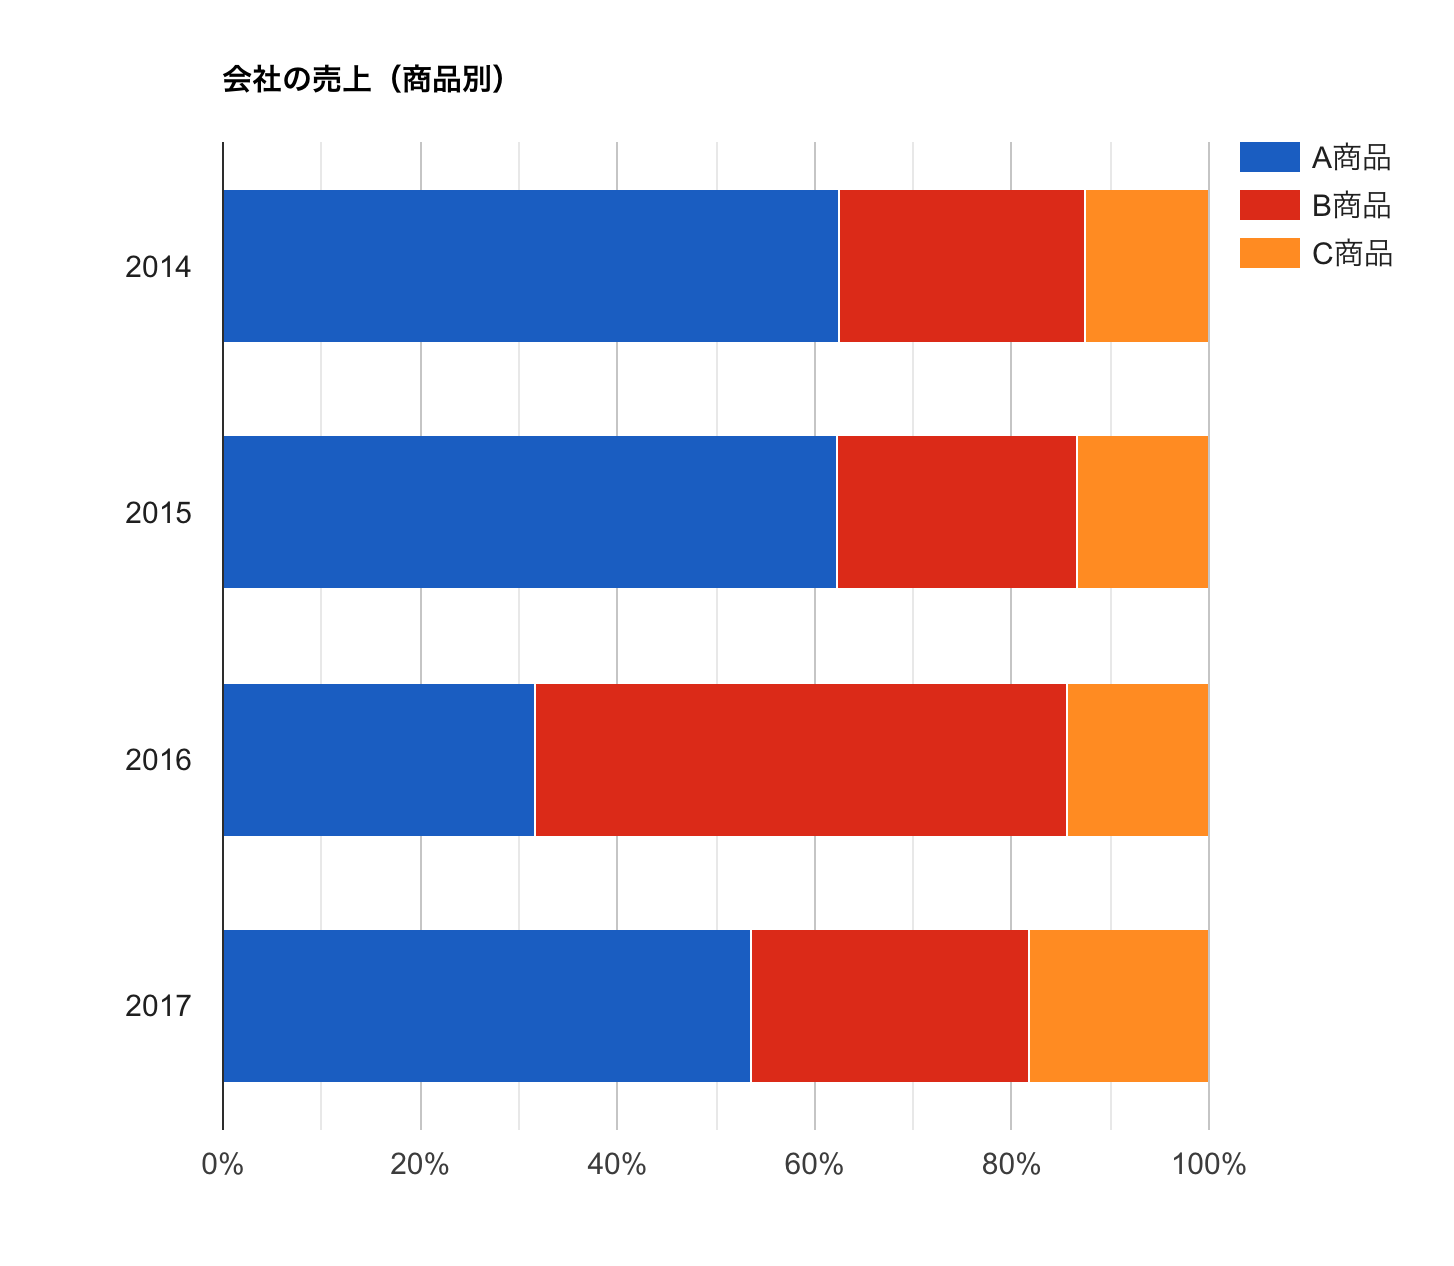
100%積み上げ棒グラフを描画

- chartOptionに
isStacked: 'percent'を追加する
      chartOptions: {
        title: '会社の損益',
        subtitle: '売上',
        width: 500,
        height: 500,
        isStacked: 'percent'
      }
アノテーションを付ける
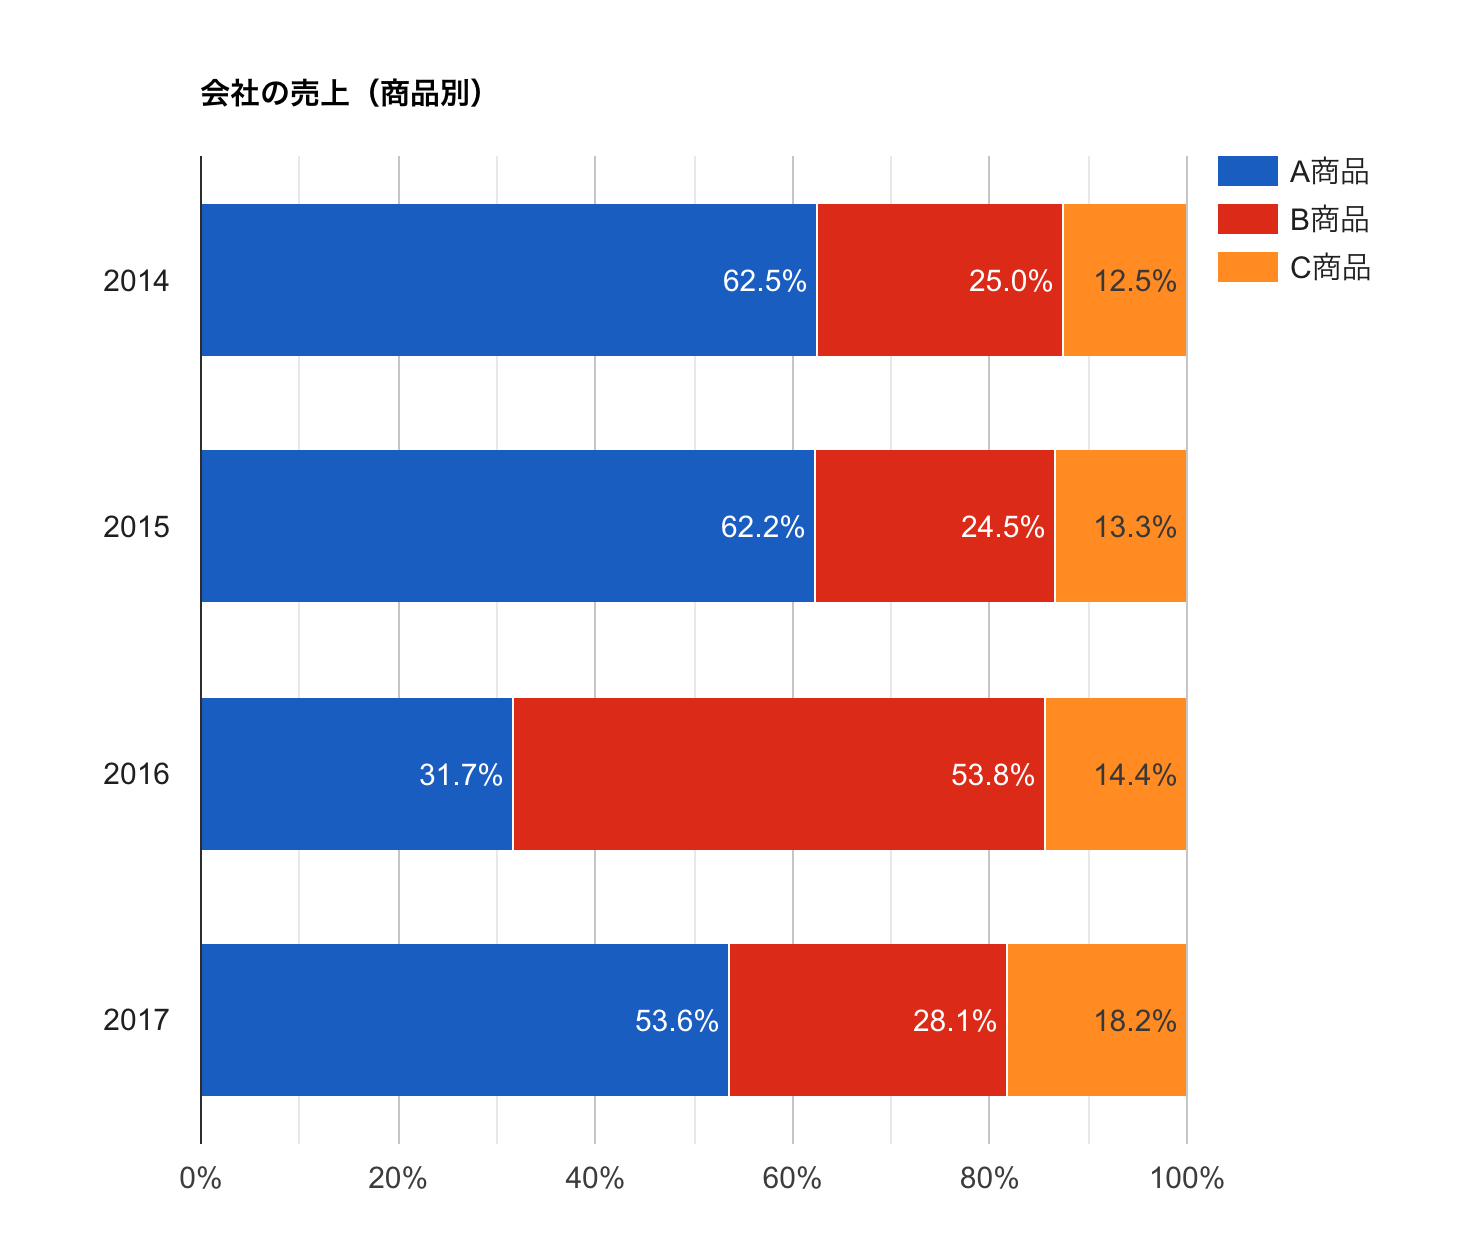
- グラフを描画していると、グラフに数値を表示したくなります。

components/atoms/ChartWithAnnotation.vue
<template>
  <GChart
    :type="chartType"
    :data="data"
    :options="chartOptions"
    :createChart="
      (el, google, type) => {
        return new google.visualization[type](el)
      }
    "
    @ready="onChartReady"
  />
</template>

<script>
import { GChart } from 'vue-google-charts'

export default {
  components: {
    GChart
  },
  props: {
    chartType: {
      type: String,
      default: ''
    },
    chartData: {
      type: Array,
      default: () => {
        return []
      }
    },
    chartOptions: {
      type: Object,
      default: () => {
        return {}
      }
    }
  },
  data() {
    return {
      viewOption: {
        calc: 'stringify',
        type: 'string',
        role: 'annotation'
      },
      data: null
    }
  },
  methods: {
    onChartReady(chart, google) {
      console.log('annotation')
      this.addValueLabel(chart, google)
    },
    addValueLabel(chart, google) {
      const dataArr = this.chartData
      const data = google.visualization.arrayToDataTable(dataArr)

      const formatPercent = new google.visualization.NumberFormat({
        pattern: '#,##0.0%'
      })

      const view = new google.visualization.DataView(data)
      const viewColumn = []
      const sumObj = this.calcTotal(dataArr)
      dataArr[0].forEach((val, i) => {
        viewColumn.push(i)
        if (i !== 0) {
          const viewOption = JSON.parse(JSON.stringify(this.viewOption))
          viewOption.sourceColumn = i

          viewOption.calc = (dt, row) => {
            const amount = dt.getValue(row, i) / sumObj[row]
            return formatPercent.formatValue(amount)
          }
          viewColumn.push(viewOption)
        }
      })
      view.setColumns(viewColumn)
      chart.draw(view, this.chartOptions)
    },
    calcTotal(dataArr) {
      const sumObj = {}
      dataArr.forEach((arr, i) => {
        // 1行目はヘッダーなので飛ばす
        if (i !== 0) {
          sumObj[i - 1] = 0
          arr.forEach((val, j) => {
            // 2行目以降の1カラム目はタイトルなので飛ばす
            if (j !== 0) {
              sumObj[i - 1] += Number(val)
            }
          })
        }
      })
      return sumObj
    }
  }
}
</script>
- アノテーションのフォーマットは、下記のように指定しています。
- パターンを変えれば数値やパーセント表示以外でも表示することが可能です。
      const formatPercent = new google.visualization.NumberFormat({
        pattern: '#,##0.0%'
      })
最後に
- google-chartsの紹介でした。
google chartsの良いところ
- グラフが豊富
- データ構造が同じで複数のグラフを描画できる
- アノテーションなど拡張性が高い(別途拡張用のライブラリとか不要)
主観ですがデザインはデフォルトだと少しダサいなと感じますw
昨今、データの分析結果、集計結果の可視化がトレンドなので、vue × google chartで簡単にグラフ描画が可能なので、触ってみてください。
今回のソースコードは、ここにあがってます。
明日は@daikidsさんです。