はじめに
pandasのDataFrameの特定の列について、何が多く入ってるか知りたい時ありますよね。
そんな時のためのコードです。
環境
- matplotlib:3.5.2
- pandas:1.3.5
- python3:3.7.13
データの準備
fruits.csv
apple,banana,lemon,orange,strawberry,melon,kiwi,grape,peach
メインのコード
main.py
from csv import reader
import random

import matplotlib.pyplot as plt
import pandas as pd

if __name__ == "__main__":
    # データの準備
    prefectures = []
    with open('fruits.csv', 'r') as csv_file:
        csv_reader = reader(csv_file)
        fruits = list(csv_reader)[0]

    fruit_data = [random.choice(fruits) for _ in range(100)]
    df = pd.DataFrame(fruit_data, index=list(range(1, 101)), columns=["fruit"])

    # ヒストグラムを描画する
    fruit_series = df['fruit']
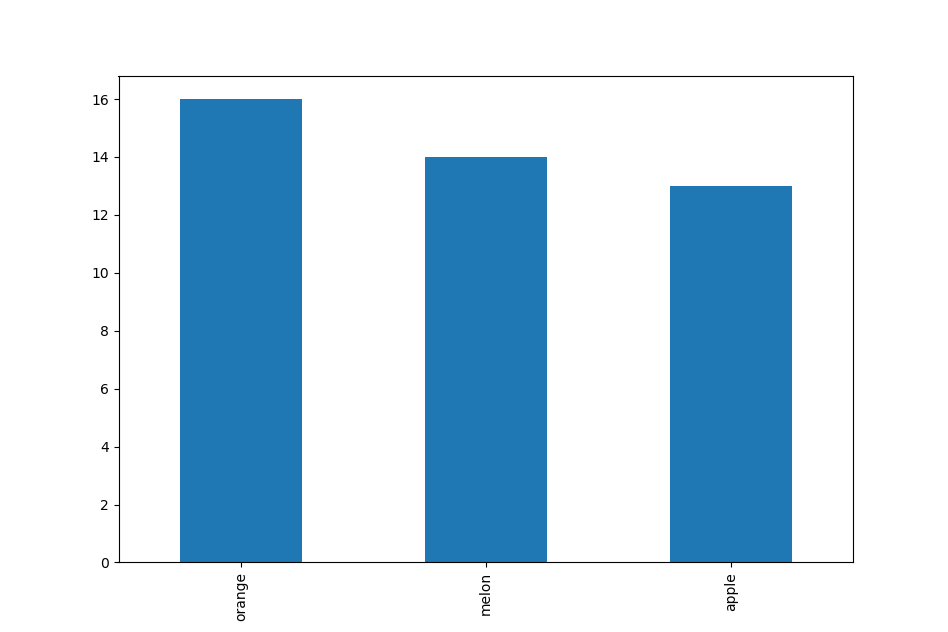
    fruit_series.value_counts().head(3).plot(kind="bar")
    plt.show()
結果
おわりに
少しでも皆様の参考になれば幸いです。
2本目の記事です、コメントお待ちしてます!
@WolfMoonさん
ヒストグラムと棒グラフのご指摘、ありがとうございました。
