Exercise 2は こちらにあります。
Exerciseを始める前に、ヒントをおさらいします。
Converting a pandas.DataFrame into a geopandas.GeoDataFrame
Sometimes, we work with data that are in a non-spatial format (such as Excel or CSV spreadsheets) but contain information on the location of records, for instance, in columns for longitude and latitude values. While geopandas’s read_file() function can read some formats, often, the safest way is to use pandas to read the data set and then convert it to a GeoDataFrame.
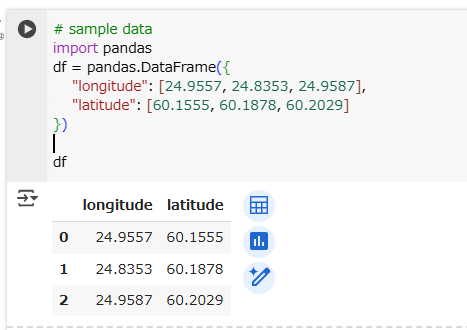
Let’s assume, we read the following table using pandas.read_csv() into a variable df:
longitudeやlatitudeが格納されたExcelファイルやCSVファイルを読み込むことがあります。
geopandasのread_file()で直接読み込めるフォーマットのときもありますが、そうでないかもしれません。
pandasで読み込んだあとにGeoDataFrameへ変換するほうが手堅いです。
まずはお約束のpip install。
! pip install geopandas
次に、pandasのDataFrameを用意します。
# sample data
import pandas
df = pandas.DataFrame({
    "longitude": [24.9557, 24.8353, 24.9587],
    "latitude": [60.1555, 60.1878, 60.2029]
})

df
The geopandas.GeoDataFrame() constructor accepts a pandas.DataFrame as an input, but it does not automatically fill the geometry column. However, the library comes with a handy helper function geopandas.points_from_xy(). As we all know, a spatial data set should always have a coordinate reference system (CRS) defined; we can specify the CRS of the input data, here, too:
GeoDataFrameのコンストラクタは、DataFrameを入力とすることができます。しかし、geometry列は自動で設定されません。
しかし、ヘルパー関数のpoints_from_xy()で、geometry列を設定できます。
その際、CRSも定義します。
import geopandas

gdf = geopandas.GeoDataFrame(
    df,
    geometry=geopandas.points_from_xy(df.longitude, df.latitude),
    crs="EPSG:4326"
)

print(gdf)
print(type(gdf))
print(gdf.crs)
GeoDataFrameを作ったあとに、型やCRSも表示してみました。想定通りです。

Creating a new geopandas.GeoDataFrame: alternative 1
Sometimes, it makes sense to start from scratch with an empty data set and gradually add records. Of course, this is also possible with geopandas’ data frames, that can then be saved as a new geopackage or shapefile.
First, create a completely empty GeoDataFrame:
空のデータセットに徐々にレコードを追加してみましょう。
import geopandas

new_geodataframe = geopandas.GeoDataFrame()

print(new_geodataframe)
print(type(new_geodataframe))
当たり前ですが、new_geodataframeはまだ空です。

Then, create shapely geometry objects and insert them into the data frame. To insert a geometry object into the geometry column, and a name into the name column, in a newly added row, use:
shapelyのgeometryオブジェクトを作って、new_geodataframeに追加しましょう。
geometry列:geometryオブジェクト
name列:"Senaatintori"
の一行を追加します。
import shapely.geometry
polygon = shapely.geometry.Polygon(
    [
        (24.9510, 60.1690),
        (24.9510, 60.1698),
        (24.9536, 60.1698),
        (24.9536, 60.1690)
    ]
)
name = "Senaatintori"

new_geodataframe.loc[
    len(new_geodataframe),  # in which row,
    ["name", "geometry"]    # in which columns to save values
] = [name, polygon]

new_geodataframe.head()
一行追加されました。

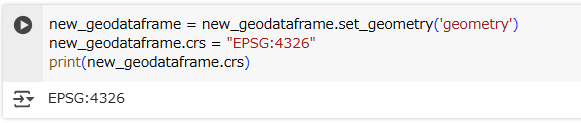
Before saving the newly created dataset, don’t forget to set the geometry column and define a cartographic reference system for it. Otherwise, you will have trouble reusing the file in other programs:
トラブル防止のため、set_geometry()メソッドによるgeometry列の設定と、crsプロパティによるCRSの設定もしましょう。
new_geodataframe = new_geodataframe.set_geometry('geometry')
new_geodataframe.crs = "EPSG:4326"
print(new_geodataframe.crs)
Creating a new geopandas.GeoDataFrame: alternative 2
Often, it is more convenient, and more elegant, to first create a dictionary to collect data, that can then be converted into a data frame all at once.
dictionary型にデータを格納しておき、それを、GeoDataFrameに変換するほうが、より便利かつよりエレガント(?)です。
For this, first define a dict with the column names as keys, and empty lists as values:
Then, fill the dict with data:
空のリストを値としてもつdictionaryを作り、そこにデータを格納します。
import shapely.geometry

data = {
    "name": [],
    "geometry": []
}


data["name"].append("Senaatintori")
data["geometry"].append(
    shapely.geometry.Polygon(
        [
            (24.9510, 60.1690),
            (24.9510, 60.1698),
            (24.9536, 60.1698),
            (24.9536, 60.1690)
        ]
    )
)

data
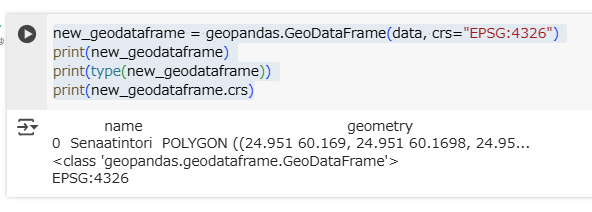
Finally, use this dictionary as input for a new GeoDataFrame. Don’t forget to specify a CRS:
最後に、dictionaryをGeoDataFrameに変換します。CRSの設定も忘れずに。
new_geodataframe = geopandas.GeoDataFrame(data, crs="EPSG:4326")
print(new_geodataframe)
print(type(new_geodataframe))
print(new_geodataframe.crs)