Vector Data I/O
One of the first steps of many analysis workflow is to read data from a file, one of the last steps often writes data to an output file. To the horror of many geoinformatics scholars, there exist many file formats for GIS data: the old and hated but also loved and established ESRI Shapefile, the universal Geopackage (GPKG), and the web-optimised GeoJSON are just a few of the more well-known examples.
データ分析の最初のステップとしてファイルからのデータ読み込み、最終ステップとして、ファイルへのデータの書き込みがあります。
GISデータにはファイルフォーマットがたくさんあります。古くて嫌われると同時に重宝されているShapefile、一般的なGeopackage (GPKG)、Web向けに最適化されたGeoJSON などがよく知られています。
Fear not, Python can read them all (no guarantees, though)!
Most of the current Python GIS packages rely on the GDAL/OGR libraries, for which modern interfaces exist in the form of the fiona and rasterio Python packages.
Today, we’ll concentrate on vector data, so let’s first take a closer look at fiona’s capabilities, and then import and export data using geopandas, which uses fiona under its hood.
が、Pythonでだいたい何とかなります。
PythonのGISライブラリの多くは、C++製のGDAL/OGRライブラリを基盤としており、fiona(ベクター用)や rasterio(ラスターデータ用)といったモダンなPythonインターフェースが提供されています。
とりあえず、 ベクターデータを扱うfionaを見ましょう。fionaはgeopandasが内部で使用しています。
(余談)
なんということでしょう。Vectorは数学だとベクトル、GISだとベクターという謎の使い分けがあります。
ここで前回の復習です。ファイルを置くディレクトリのフルパスを固定値として持っておきましょう。
import pathlib
NOTEBOOK_PATH = pathlib.Path().resolve()
DATA_DIRECTORY = NOTEBOOK_PATH / "data"
File formats
Fiona can read (almost) any geospatial file format, and write many of them. To find out which ones exactly (it might depend on the local installation and version, as well), we can print its list of file format drivers:
Fiona はだいたい全部のGISのフォーマットを読むことができ、多くのフォーマットで書くことができます。
その内訳(リスト)をみることができます。
import fiona
fiona.supported_drivers
はい。エラーになりました。

Fionaがインストールされていないようです。シェルコマンドでインストールしましょう。
! pip install fiona

リストがでました。
r:読み込み可、a:追記可、w:書込可です。

Reading and writing geospatial data
Fiona allows very low-level access to geodata files. This is sometimes necessary, but in typical analysis workflows, it is more convenient to use a higher-level library. The most commonly used one for geospatial vector data is geopandas. As mentioned above, it uses fiona for reading and writing files, and thus supports the same file formats.
To read data from a GeoPackage file into a geopandas.GeoDataFrame (a geospatially-enabled version of a pandas.DataFrame), use geopandas.read_file():
Fiona より geopandasを使うほうが一般的です。
higher-level・low-levelと書いてありますが、ここでのレベルの高い・低いは、使い勝手の良さ、と理解するのが良いでしょう。
(重要)
原則、以降のレッスンで使用するファイルは、https://github.com/Automating-GIS-processes/site にあるものを使います。
colabの所定のディレクトリにアップロードしましょう。

では、このファイル読み込みましょう。
import geopandas
municipalities = geopandas.read_file(
    DATA_DIRECTORY / "finland_municipalities" / "finland_municipalities_2021.gpkg"
)
municipalities.head()
はい。エラーになりました。(二回目)
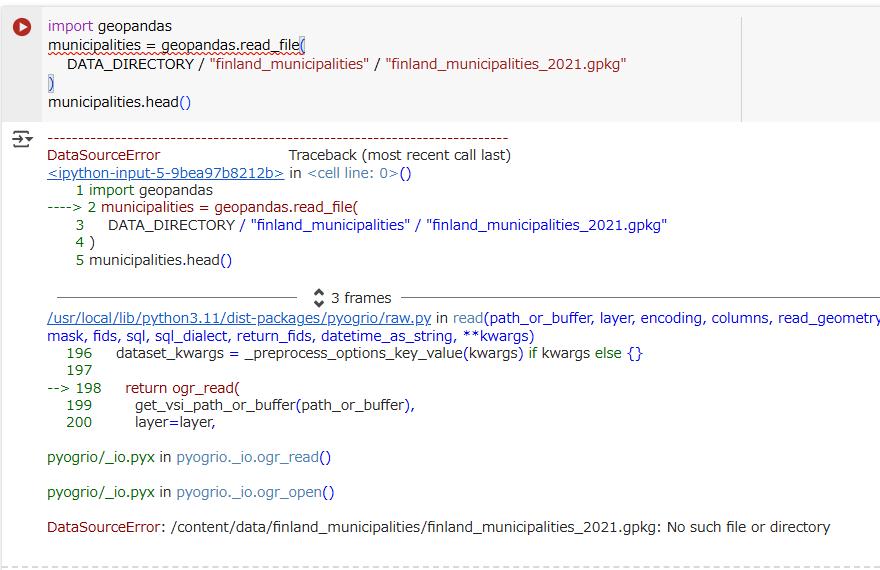
geopandas がインストールされていないようです。シェルコマンドでインストールしましょう。
! pip install geopandas
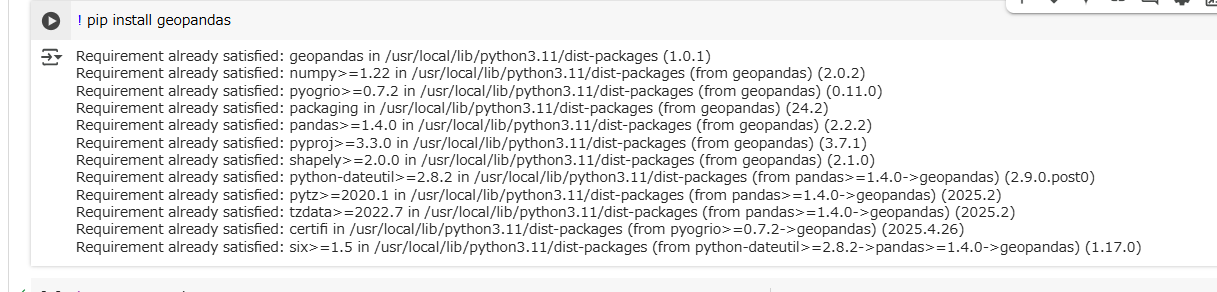
読み込めました。

一番右側の列(見切れていますが)がgeometryの列です。Polygon型ですね。
Reading a local GPKG file is most likely the easiest task for a GIS package. However, in perfect Python ‘Swiss pocket knife’ manner, geopandas can also read Shapefiles inside a ZIP archive, and/or straight from an Internet URL. For example, downloading, unpacking and opening a data set of NUTS regions from the European Union’s GISCO/eurostat download page is one line of code:
Python の‘Swiss pocket knife’、なんでもできちゃう(だいぶ意訳)なところとして、zipファイルに格納されてインターネット上に格納されているShapefileについても、一行コードで読み込みできます。
nuts_regions = geopandas.read_file("https://gisco-services.ec.europa.eu/distribution/v2/nuts/shp/NUTS_RG_60M_2021_3035.shp.zip")
nuts_regions.head()
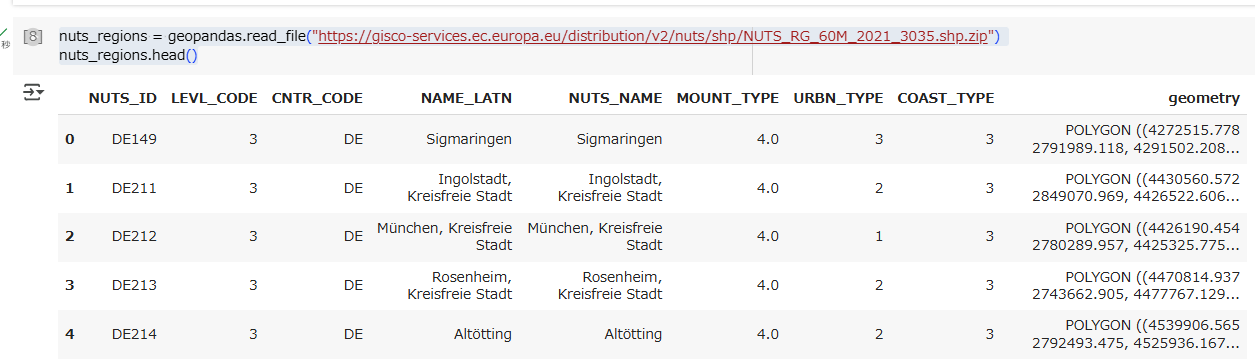
今回読み込みしたのは、https://gisco-services.ec.europa.eu/distribution/v2/nuts/shp のNUTS_RG_60M_2021_3035.shp.zipファイルです。

Writing geospatial data to a file
Writing data to a file is equally straight-forward: simply use the
to_file() method <https://geopandas.org/en/stable/docs/reference/api/geopandas.GeoDataFrame.to_file.html#geopandas.GeoDataFrame.to_file>__ of a GeoDataFrame.
ファイルにデータを書き出しましょう。 to_file()メソッドを呼ぶだけです。
nuts_regions.to_file(DATA_DIRECTORY / "europe_nuts_regions.geojson")
europe_nuts_regions.geojsonファイルが出力されました。中身もよさそうです。

Reading and writing from and to databases (RDBMS)
Fiona allows very low-level access to geodata files. This is sometimes necessary, but in typical analysis workflows, it is more convenient to use a higher-level library. The most commonly used one for geospatial vector data is geopandas. As mentioned above, it uses fiona for reading and writing files, and thus supports the same file formats.
PostgreSQL/PostGIS への読み書きもサポートします。
ただし、colabだとデータベースサーバーがないので、スキップします。
Reading data directly from a WFS (Web feature service) endpoint
Geopandas can also read data directly from a WFS endpoint, such as, for instance the geodata APIs of Helsinki Region Infoshare. Constructing a valid WFS URI (address) is not part of this course (but check, for instance, the properties of a layer added to QGIS).
The following code loads a population grid of Helsinki from 2022. The parameters encoded into the WFS address specify the layer name, a bounding box, and the requested reference system.
WFS (Web feature service) から直接データを読み込むこともできます。
2022年のヘルシンキの人口グリッドに対して、レイヤー名、バウンディングボックス、CRSなどのパラメータを指定して読み込みます。
population_grid = geopandas.read_file(
    "https://kartta.hsy.fi/geoserver/wfs"
    "?service=wfs"
    "&version=2.0.0"
    "&request=GetFeature"
    "&typeName=asuminen_ja_maankaytto:Vaestotietoruudukko_2022"
    "&srsName=EPSG:3879"
    "&bbox=25494767,6671328,25497720,6673701,EPSG:3879",
    crs="EPSG:3879"
)
population_grid.head()
結果です。

せっかく地図データ読み込んだのに、表形式ばかりだと味気ないので。可視化しましょう。
population_grid.plot()

ヘルシンキに土地勘がないと謎ですね。あと縦軸と横軸の数値の意味も謎ですね。今のところ。
続きます。