概要
OpenShift Loggingでは、コンテナ内のアプリケーションが標準出力/標準エラー出力に出力したログを、Vectorで収集してLokiStackに集約することができます。
一方、コンテナ内のアプリケーションが標準出力にログを出力せずに、コンテナ内のアプリケーション固有のログファイルにログを書く場合はLokiStackでログを参照することができません。
この場合はアプリケーションPodのサイドカーとしてfluentdを入れてアプリケーション固有のログファイルを参照し、別途Linuxサーバーに導入したfluentdに転送して収集するなどの方法も考えられます。
また、アプリケーション固有のログファイルもOpenShift LoggingのLokiStackに集約したい場合は、アプリPodのサイドカーでアプリケーション固有のログファイルをtailしてサイドカーコンテナの標準出力に出力させることで、Vectorで収集してLokiStackに集約することができます。
上述のやり方は、Kubernetesのドキュメントのロギングのアーキテクチャに記載されています。
今回はKubernetesのドキュメントのサンプルをそのままOpenShift Loggingでやってみたのでその手順をメモとして残しておきます。
Kubernetes docs / ロギングのアーキテクチャ / ロギングエージェントでサイドカーコンテナを使用する
検証環境
OCP
| OCP | version | notes |
|---|---|---|
| OCP | 4.12.20 |
Operators
| Operator | Channel | 更新承認ストラテジー | CSV | notes |
|---|---|---|---|---|
| Red Hat OpenShift Logging | stable-5.7 |
Manual | cluster-logging.v5.7.2 |
|
| Loki Operator | stable-5.7 |
Manual | loki-operator.v5.7.2 |
手順
Kubernetesのドキュメントのサンプルをそのまま使用します。
サンプルはアプリケーション固有のログファイルが2つあったのでそのままやってます。
一部ログファイル名とログメッセージだけ修正しています。
<概要>
-
counterというPodのcountコンテナと、count-log-1とcount-log-2というサイドカーコンテナは、emptyDirのVolumeを共有します。 - このボリュームをそれぞれ
/var/logとしてマウントします。 -
countコンテナは/var/log/に、test_log_1.logとtest_log_2.logという2つの固有のログファイルを出力します。 - ログファイルは1秒毎に
$i: $(date) test log 1と$i $(date) test log 2という文字列が記録されます。 -
count-log-1とcount-log-2コンテナは、countコンテナが/var/log/に出力したtest_log_1.logとtest_log_2.logというログファイルをtailで標準出力に出力します。 - コンテナのログとして出力されたログがVectorで収集されLokiStackに集約され、OCPコンソールのロギングでログを参照することができます。
サンプルは以下になります。
pod-counter.yaml
apiVersion: v1
kind: Pod
metadata:
  name: counter
spec:
  containers:
  - name: count
    image: busybox
    args:
    - /bin/sh
    - -c
    - >
      i=0;
      while true;
      do
        echo "$i: $(date) test log 1" >> /var/log/test_log_1.log;
        echo "$i: $(date) test log 2" >> /var/log/test_log_2.log;
        i=$((i+1));
        sleep 1;
      done
    volumeMounts:
    - name: varlog
      mountPath: /var/log
  - name: count-log-1
    image: busybox
    args: [/bin/sh, -c, 'tail -n+1 -f /var/log/test_log_1.log']
    volumeMounts:
    - name: varlog
      mountPath: /var/log
  - name: count-log-2
    image: busybox
    args: [/bin/sh, -c, 'tail -n+1 -f /var/log/test_log_2.log']
    volumeMounts:
    - name: varlog
      mountPath: /var/log
  volumes:
  - name: varlog
    emptyDir: {}
デプロイします。
[root@bastion-01 sidecar]# oc apply -f pod-counter.yaml -n test
pod/counter created
[root@bastion-01 sidecar]#
[root@bastion-01 sidecar]# oc get pod -n test counter
NAME      READY   STATUS    RESTARTS   AGE
counter   3/3     Running   0          16s
[root@bastion-01 sidecar]#
コンテナのログに出力されていることを確認します。
それぞれサイドカーコンテナ名を指定して出力します。
[root@bastion-01 sidecar]# oc logs -n test counter -c count-log-1
0: Sun Jun 25 05:35:40 UTC 2023 test log 1
1: Sun Jun 25 05:35:41 UTC 2023 test log 1
2: Sun Jun 25 05:35:42 UTC 2023 test log 1
3: Sun Jun 25 05:35:43 UTC 2023 test log 1
4: Sun Jun 25 05:35:44 UTC 2023 test log 1
5: Sun Jun 25 05:35:45 UTC 2023 test log 1
6: Sun Jun 25 05:35:46 UTC 2023 test log 1
7: Sun Jun 25 05:35:48 UTC 2023 test log 1
8: Sun Jun 25 05:35:49 UTC 2023 test log 1
9: Sun Jun 25 05:35:50 UTC 2023 test log 1
[root@bastion-01 sidecar]# oc logs -n test counter -c count-log-2
0: Sun Jun 25 05:35:40 UTC 2023 test log 2
1: Sun Jun 25 05:35:41 UTC 2023 test log 2
2: Sun Jun 25 05:35:42 UTC 2023 test log 2
3: Sun Jun 25 05:35:43 UTC 2023 test log 2
4: Sun Jun 25 05:35:44 UTC 2023 test log 2
5: Sun Jun 25 05:35:45 UTC 2023 test log 2
6: Sun Jun 25 05:35:46 UTC 2023 test log 2
7: Sun Jun 25 05:35:48 UTC 2023 test log 2
8: Sun Jun 25 05:35:49 UTC 2023 test log 2
9: Sun Jun 25 05:35:50 UTC 2023 test log 2
OCPコンソールのロギングでも参照できました。
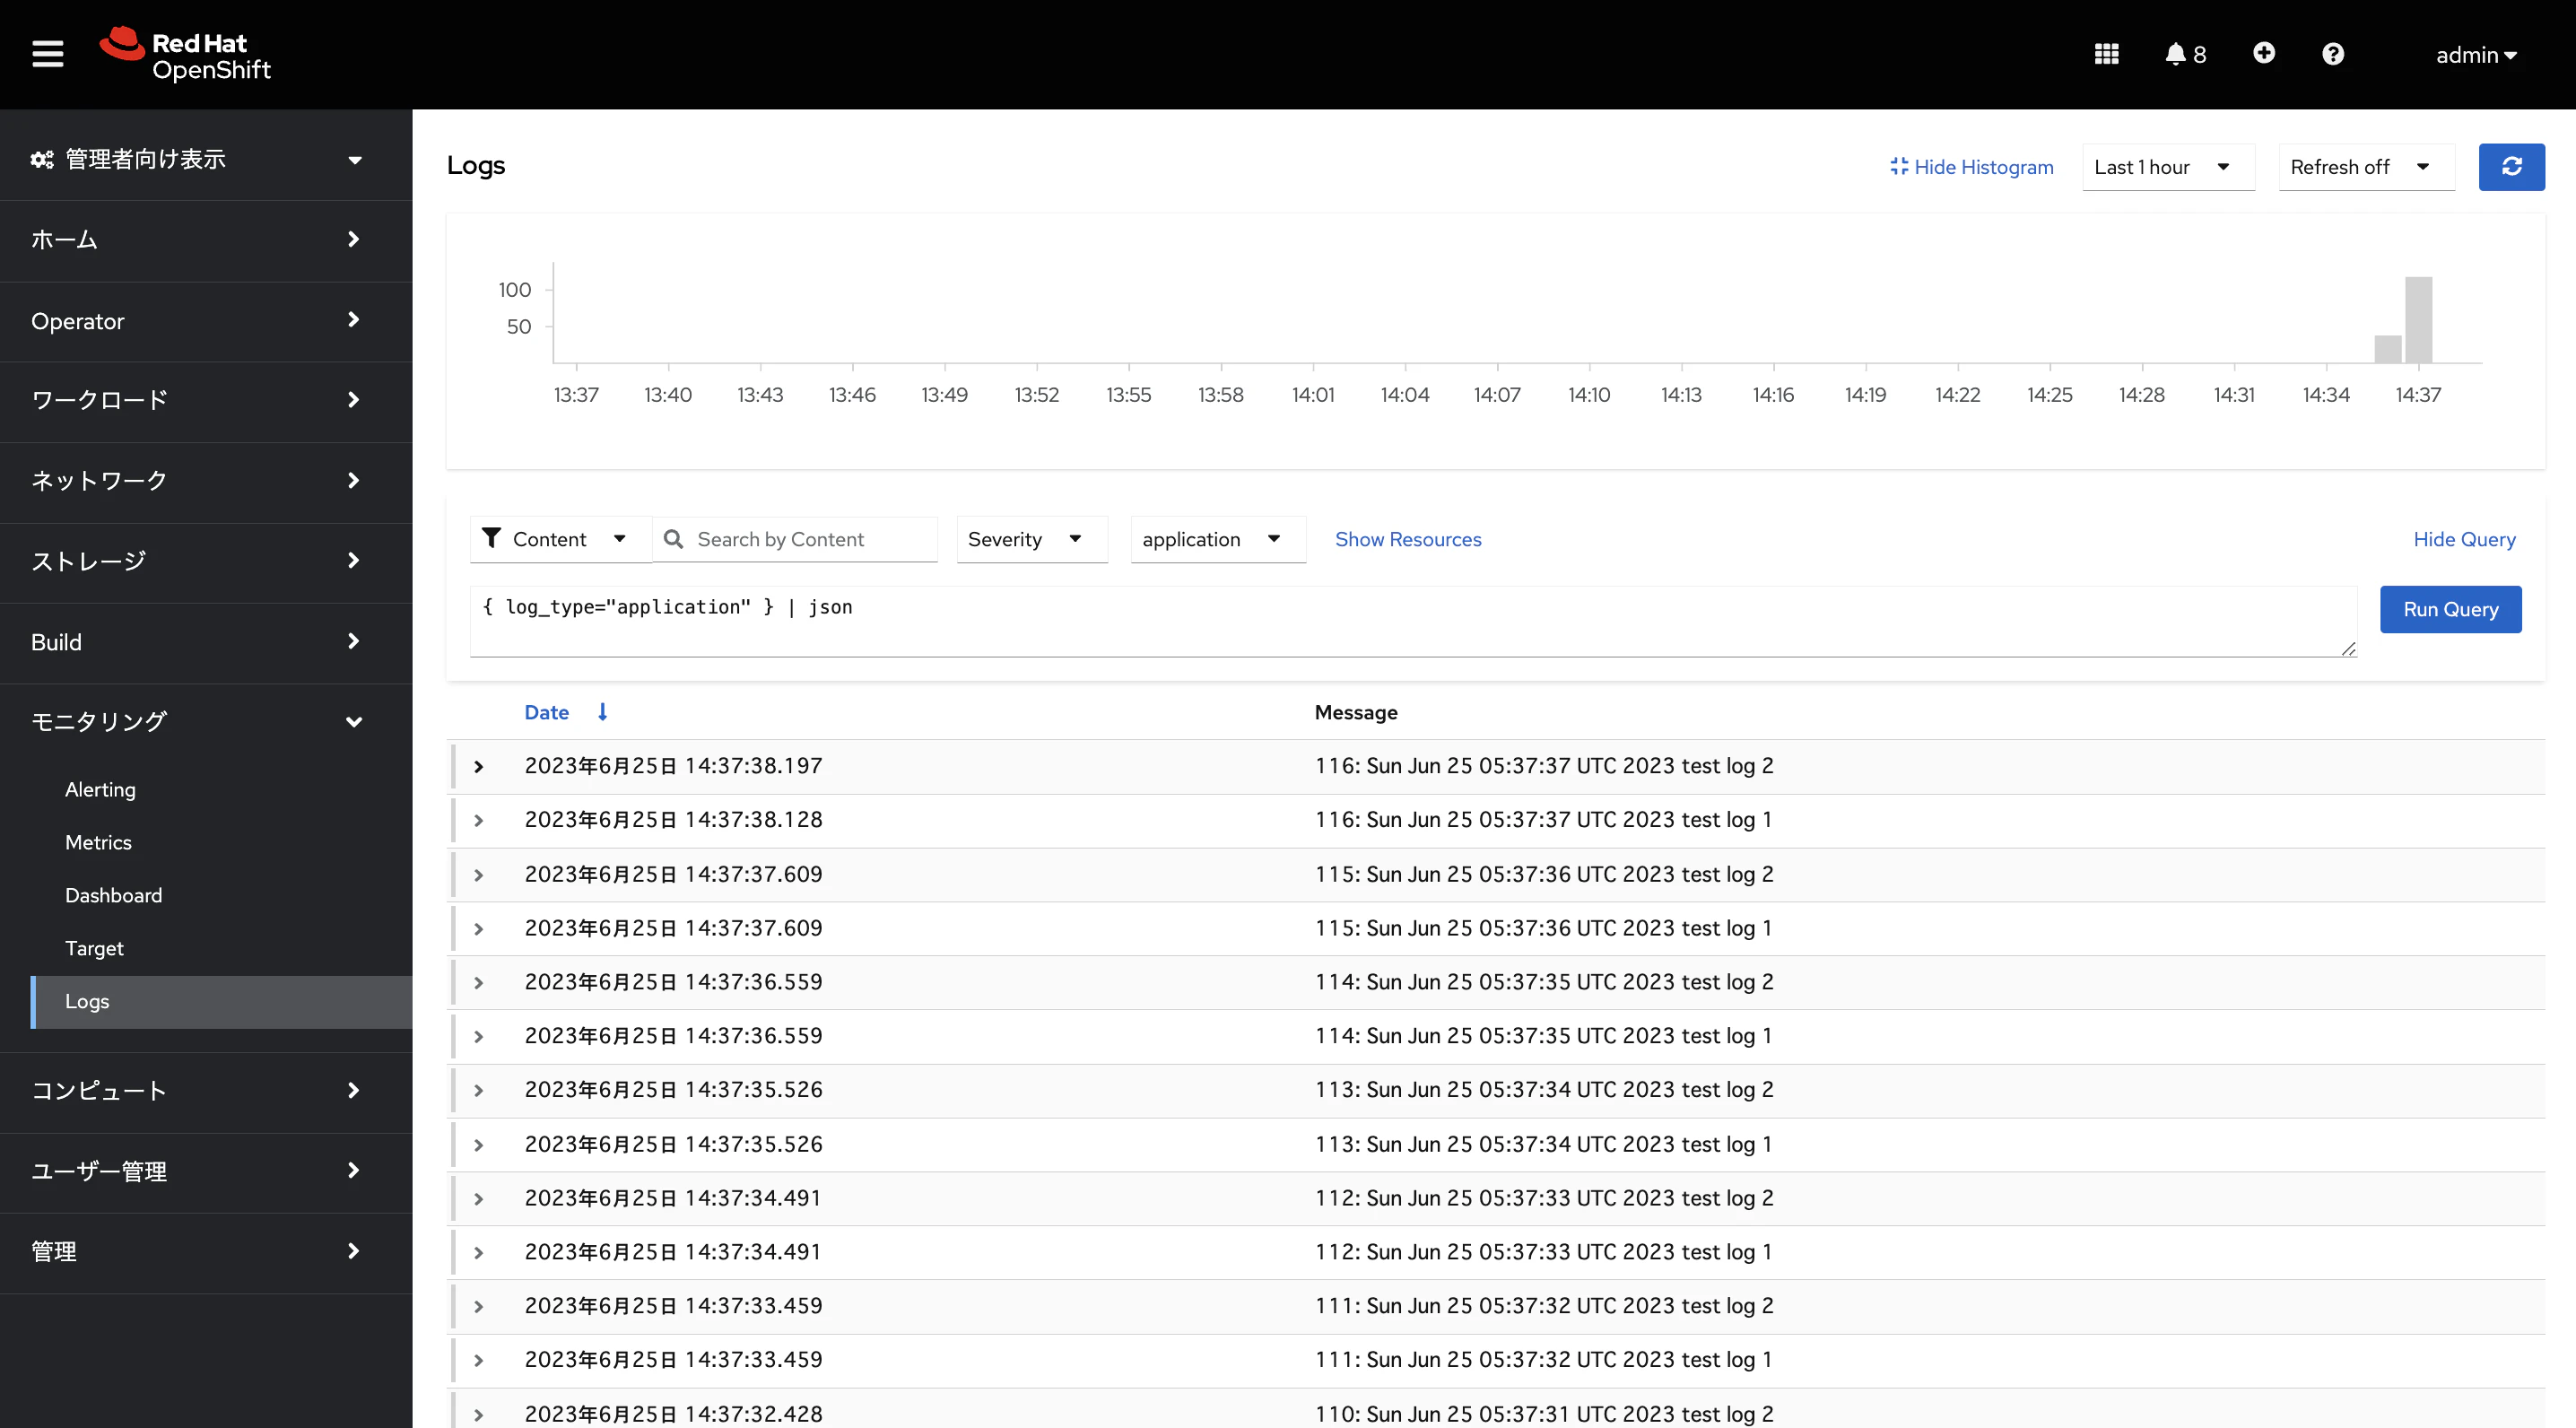
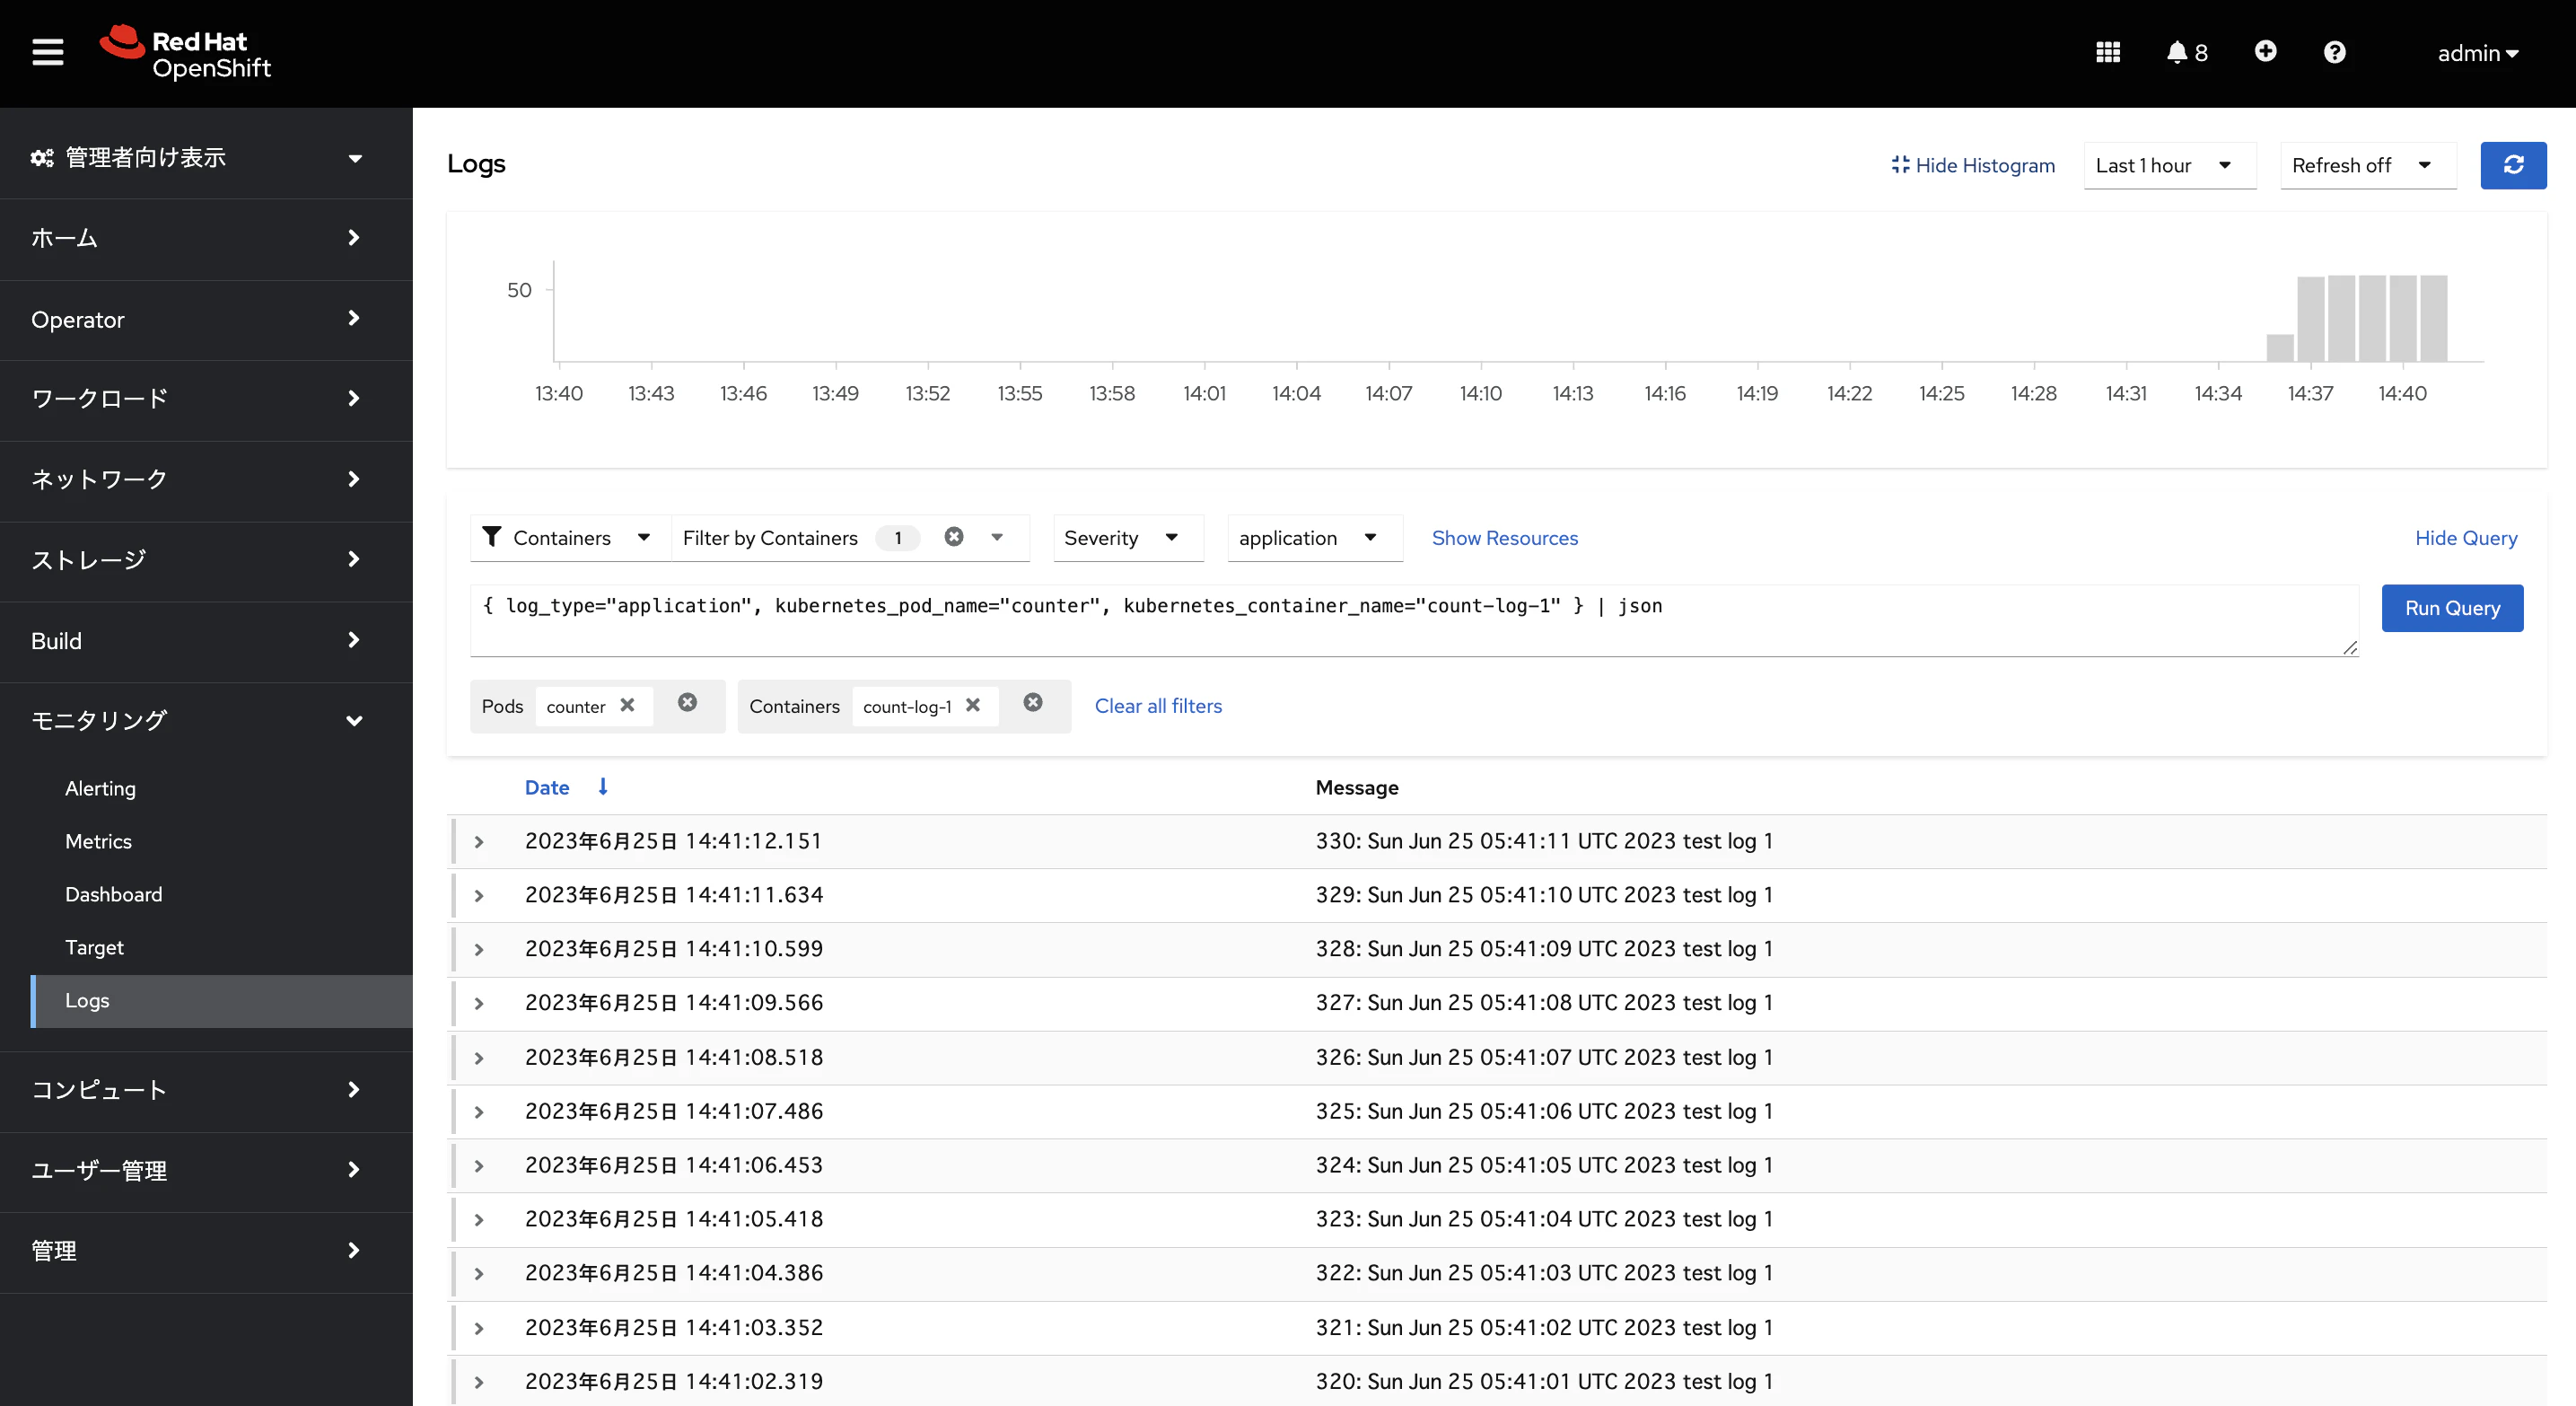
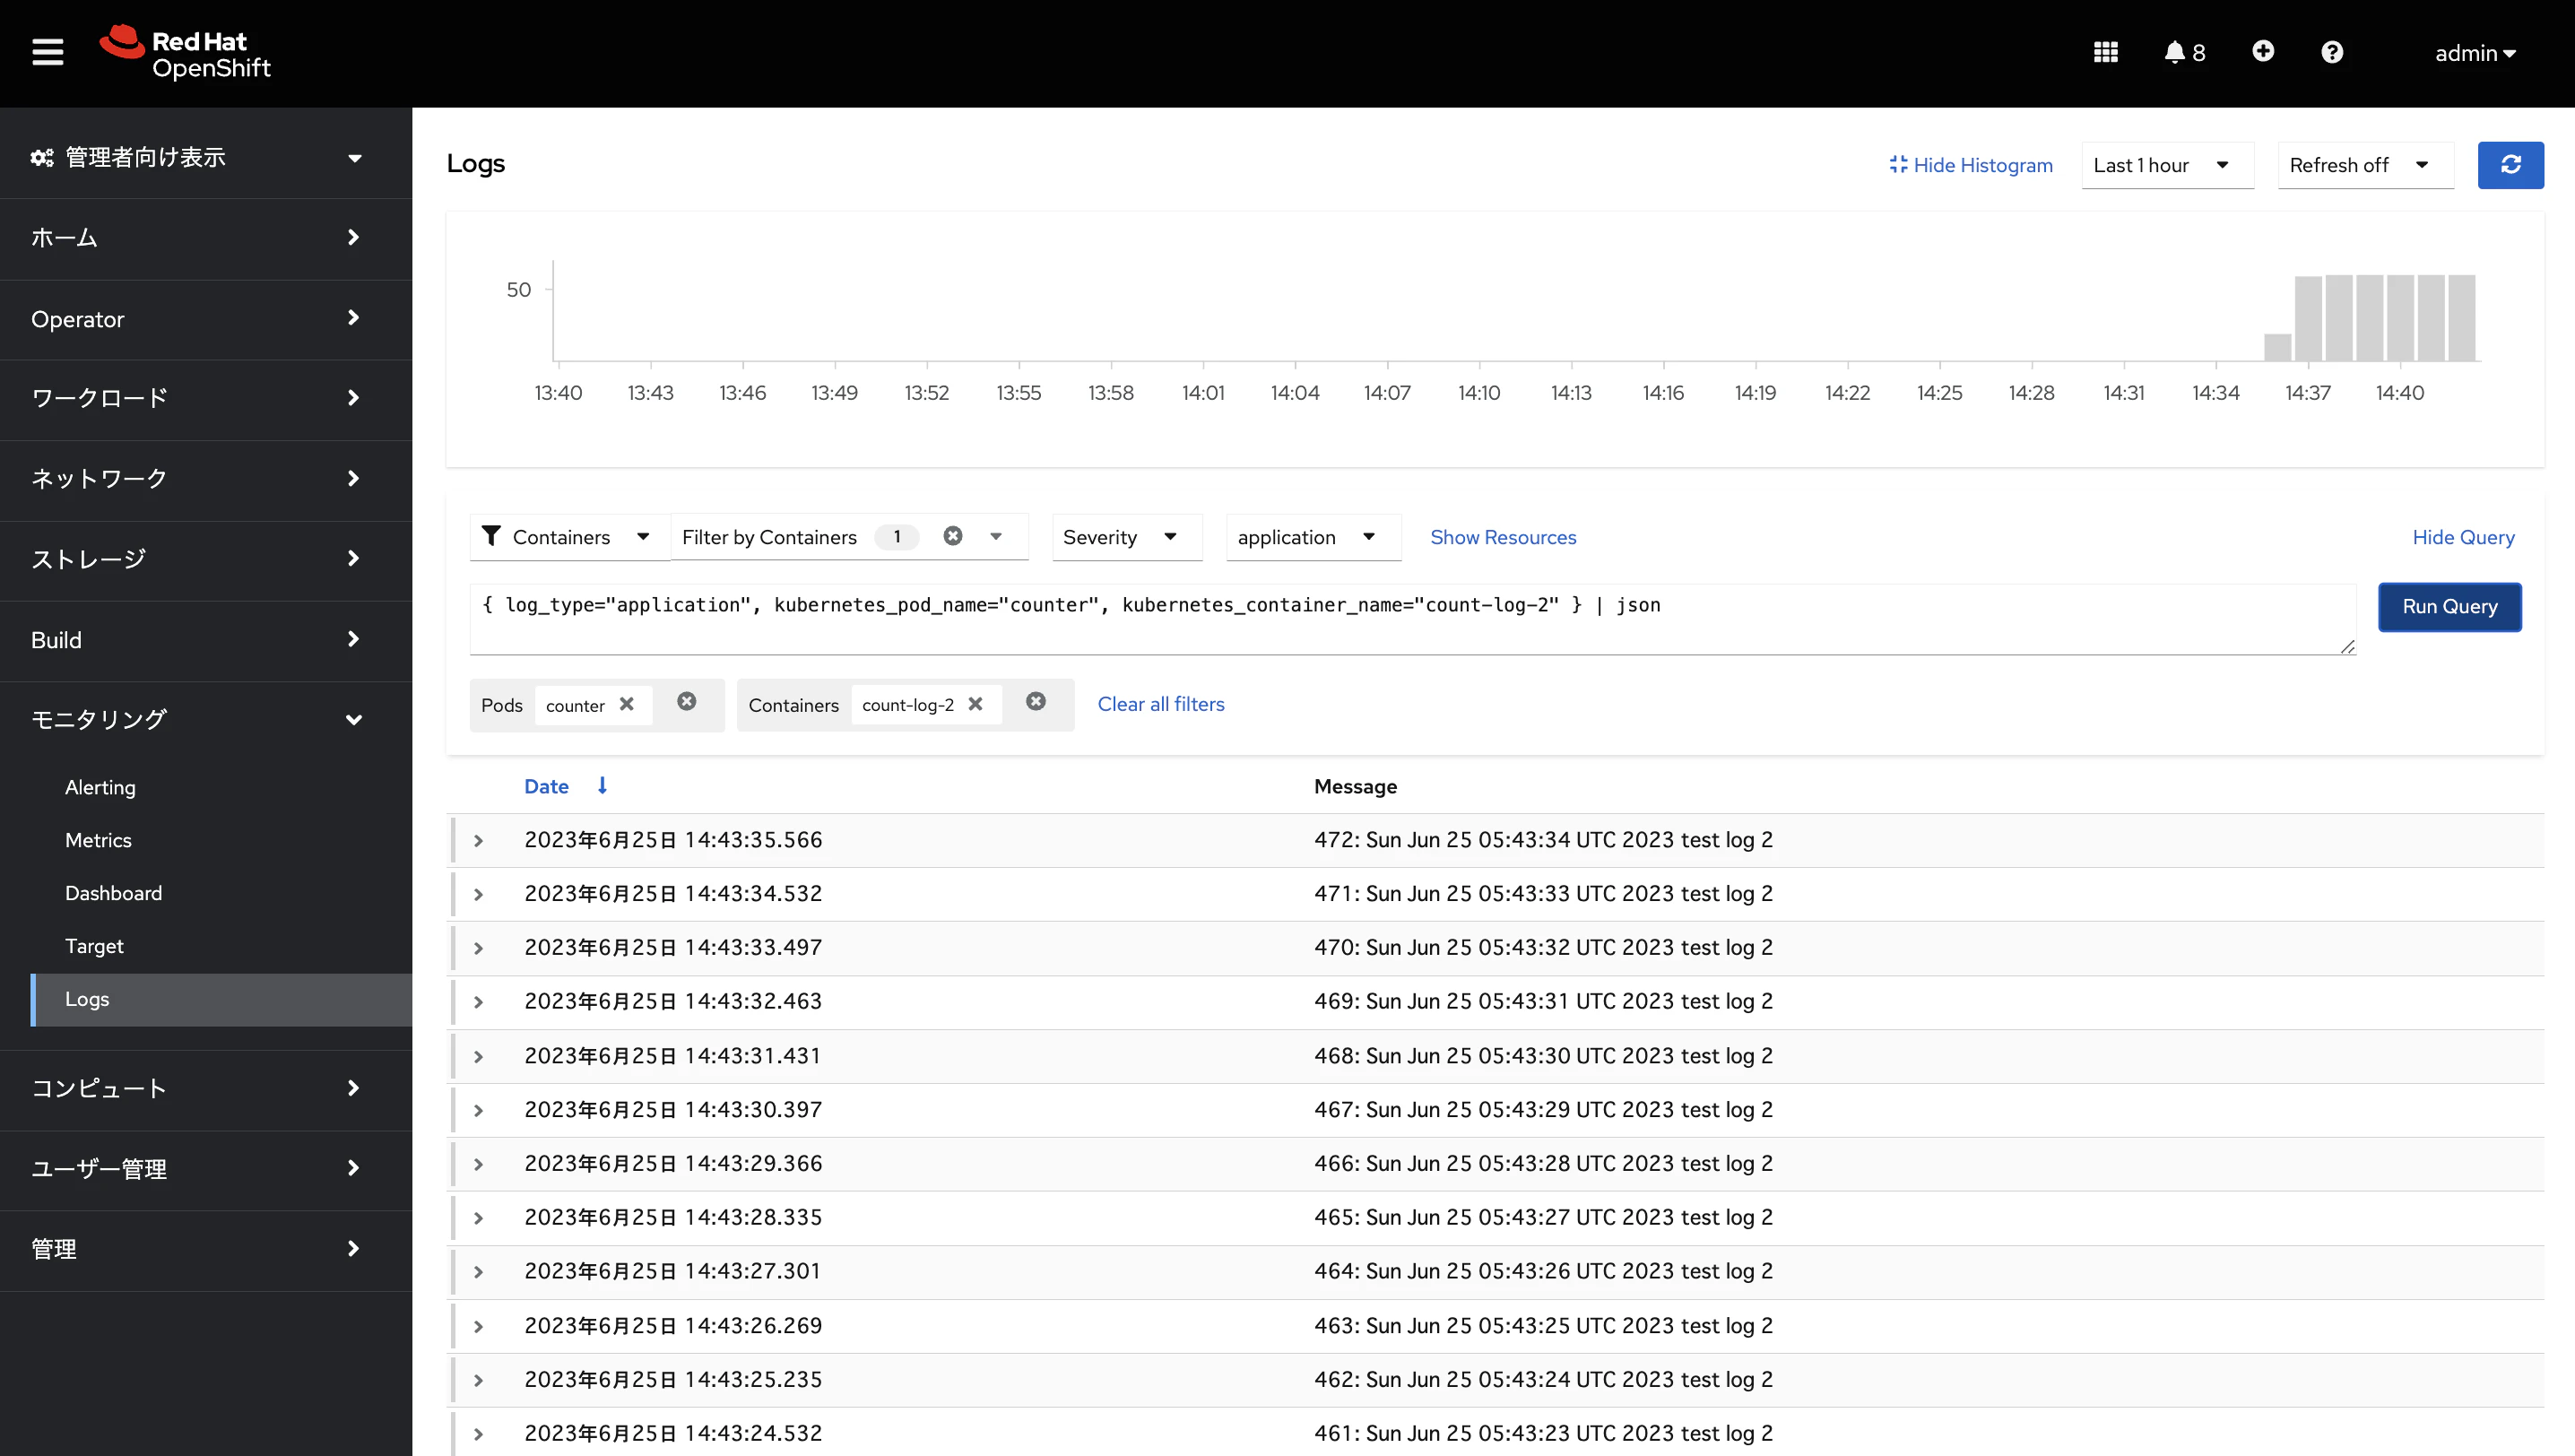
コンテナ名の属性もあるので、ログファイル毎に表示してみます。
Pod名はcounter、コンテナ名としてcount-log-1またはcount-log-2を選択してQueryすることで、/var/log/test_log_1.logまたは/var/log/test_log_2.logだけのログメッセージを表示することができます。
ログの詳細は以下のようになっています。messageフィールドでログファイルの中身が参照できています。

まとめ
アプリケーション固有のログファイルも、サイドカーコンテナでtailすることでサイドカーコンテナの標準出力に出力し、Vectorで収集してLokiStackに集約することができました。
但し、Kubernetesのドキュメントに記載のように、この方法の場合は、ログをファイルに書き込んでからstdoutにストリーミングするためディスクの使用量が2倍になる可能性があることに注意する必要がありそうです。