概要
LogCLIは、Grafana LokiへのCLIになります。
LogCLIを使用すると、Lokiインスタンスに対するLogQLクエリの実行ができるため、CLIでLokiのログを検索したり抽出したりすることができます。
Grafana Loki / Tools / LogCLI
LogCLIは、OpenShift(以下OCP)から提供されているわけではないのでサポートはないと思いますが、今回はOpenShift 4.11 + LokiStack 5.5の環境で、LogCLIを使用してログを検索をしてみたので、その際のメモを残しておきます。
参考リンク
Grafana Loki / Tools / LogCLI
Loki releases page
Grafana Loki / HTTP API
Loki-Operator Docs / API
検証環境
今回は以下のリンクの手順で、ベアメタルUPIで導入したオンプレのOpenShift 4.11に LokiStack + Vectorを入れてみた環境を使用しています。
Qiita / ベアメタルUPIで導入したオンプレのOpenShift 4.11に LokiStack + Vectorを入れてみた
検証時に最新だったLogging 5.5.5 を使用しています。
OCP
| OCP | version | notes |
|---|---|---|
| OCP | 4.11.16 |
Operators
| Operator | version | notes |
|---|---|---|
| Local Storage | 4.11.0 | For Storage (Prerequise of ODF on on-pre env) |
| OpenShift Data Foundation | 4.11.4 | For Storage (Block and Object) |
| Loki Operator | 5.5.5 | For Logging (Lokistack) |
| Red Hat OpenShift Logging | 5.5.5 | For Logging (ClusterLogging and Vector) |
LogCLIの導入
LogCLIは、Grafana Loki / Tools / LogCLI に記載のある Loki releases page のリンク先からbinaryがダウンロードできます。
今回は、検証時に最新だった2.7.2のlogcli-2.7.1.x86_64.rpmをダウンロードして踏み台サーバーに配置し、rpmをインストールしました。
[root@bastion-01 loki]# rpm -ivh logcli-2.7.1.x86_64.rpm
警告: logcli-2.7.1.x86_64.rpm: ヘッダー V4 RSA/SHA256 Signature、鍵 ID 24098cb6: NOKEY
Verifying...                          ################################# [100%]
準備しています...              ################################# [100%]
更新中 / インストール中...
   1:logcli-0:2.7.1-1                 ################################# [100%]
[root@bastion-01 loki]#
[root@bastion-01 loki]# logcli --version
logcli, version HEAD-e0af1cc (branch: HEAD, revision: e0af1cc8a)
  build user:       root@5004faa13e2e
  build date:       2022-12-09T19:23:40Z
  go version:       go1.19.2
  platform:         linux/amd64
[root@bastion-01 loki]#
LogCLIのタブ補完の設定
Grafana Loki / Tools / LogCLI / Set up command completion
~/.bashrcにeval "$(logcli --completion-script-bash)"の行を追加して、読み込むとタブ保管ができるようになりました。
[root@bastion-01 ~]# vi .bashrc
[root@bastion-01 ~]#
[root@bastion-01 ~]# grep logcli ${HOME}/.bashrc
eval "$(logcli --completion-script-bash)"
[root@bastion-01 ~]#
[root@bastion-01 ~]# source .bashrc
[root@bastion-01 ~]#
[root@bastion-01 ~]# logcli <Tab>
help           instant-query  labels         query          series
[root@bastion-01 ~]# logcli
コマンドヘルプの参照
以下に、今回使用するlogcli、logcli query、logcli labelsのコマンドオプションにヘルプなども記載があります。
Grafana Loki / Tools / LogCLI / LogCLI command referenceにも記載があります。
LogQL
Lokiでログを検索する際には、LogQLでqueryをします。
LokiではLogQLを使いこなせばログをに柔軟に検索できるところが一つの特徴のようです。
LogQLのqueryの指定の仕方は以下に記載があります。
Grafana Loki / LogQL
Grafana Loki / LogQL / Log queries
OCPコンソールからLogQLを確認してみる
LogQLに慣れていないと、すぐにはqueryの指定の仕方がわからなかったので、OCPのコンソールのLog画面で実際に確認してみました。
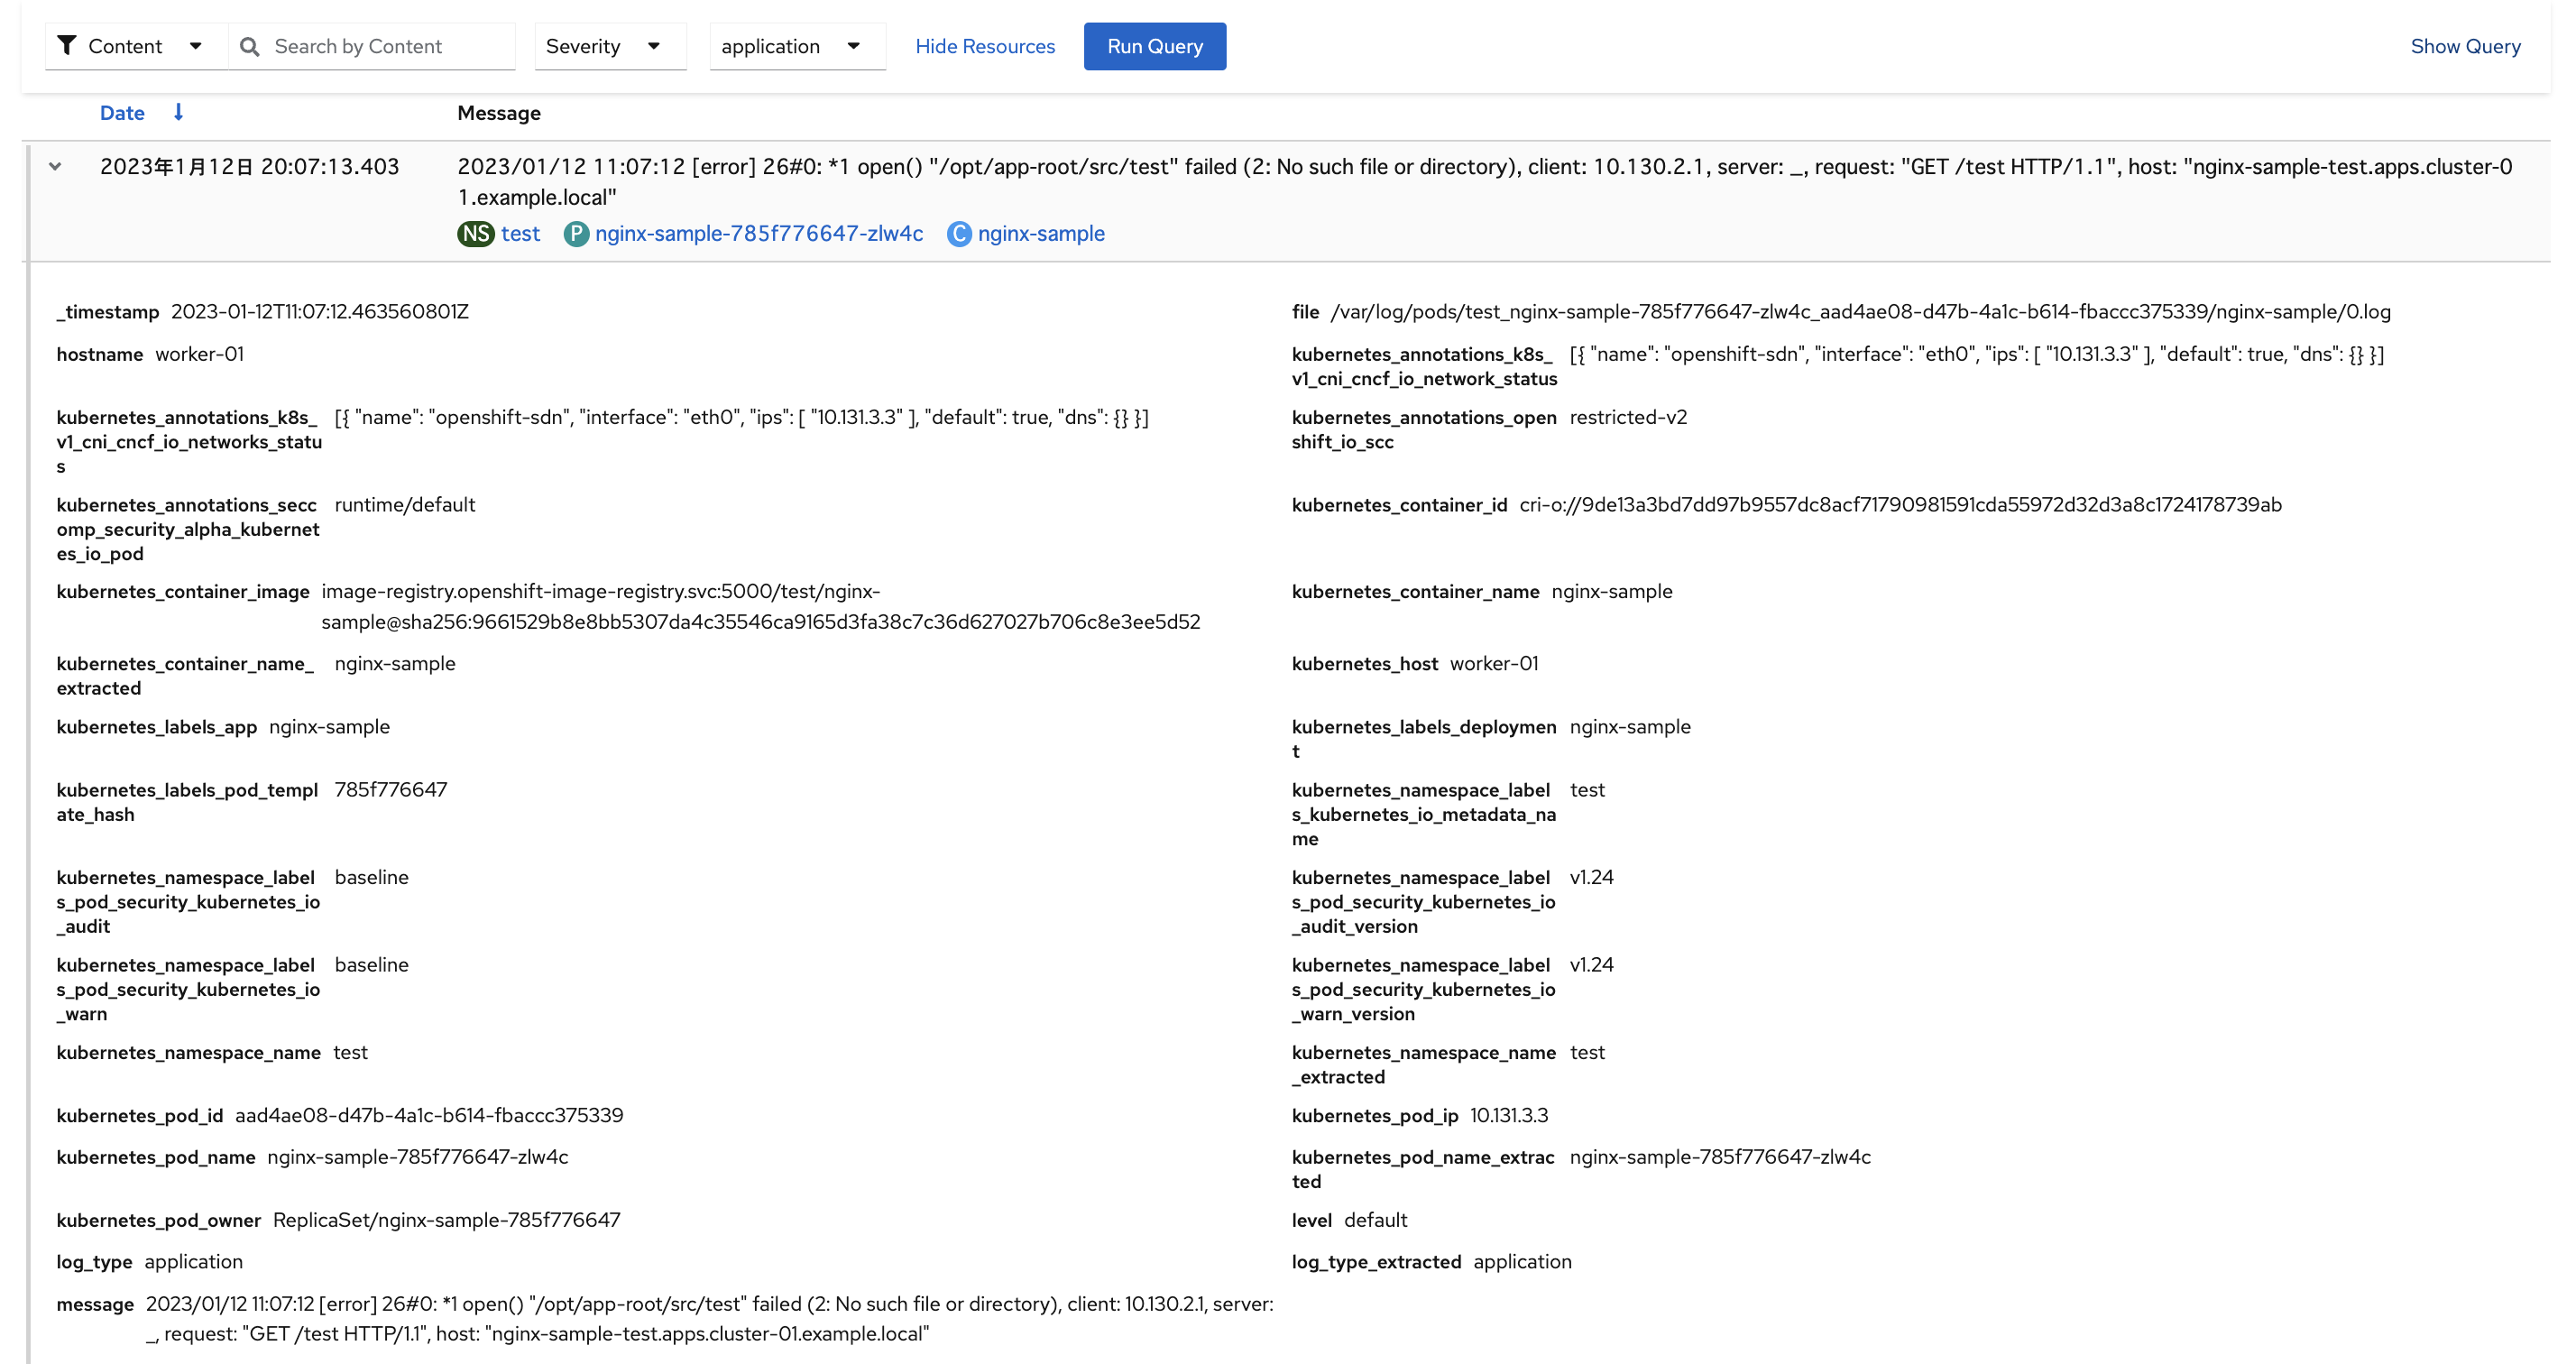
OCPのLog画面でShow Qureyを表示すると、実際に検索条件に使われているLogQLの文字列が表示できます。
なので、一旦コンソールでいくつか検索をして、LogQLの検索の仕方を見てみました。
まず、Log画面ではapplication、infrastructure、auditが選択できます。
以下はapplicationを選択した際の画面です。
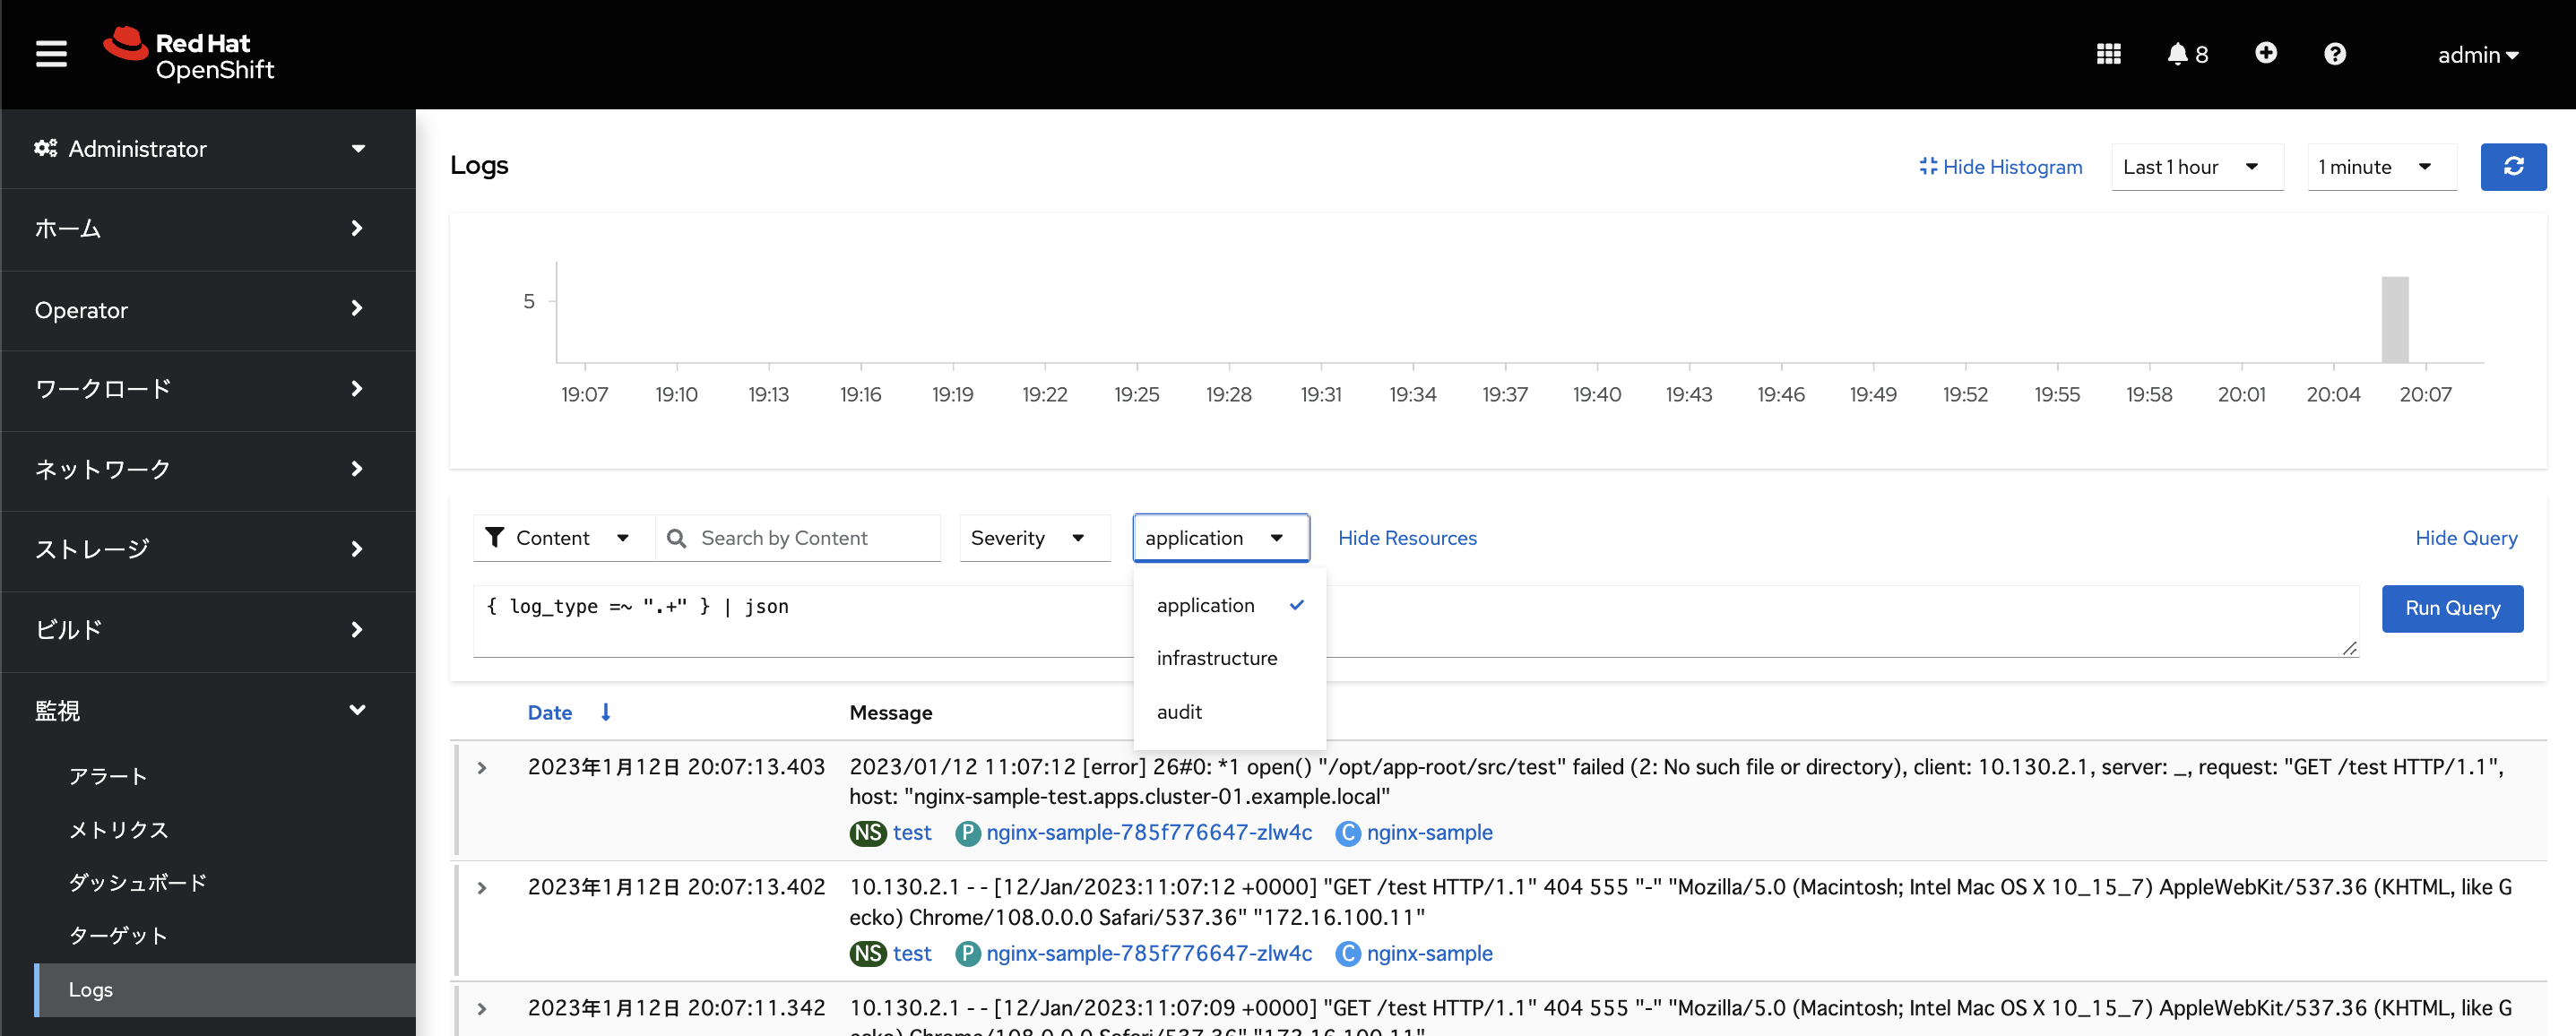
Show Queryを開いておくと、Logの検索条件として、NamespaceやContent、Severityを選択した際の実際に発行されているLogQLでのQueryの仕方がわかるのでこちらも参考になりました。
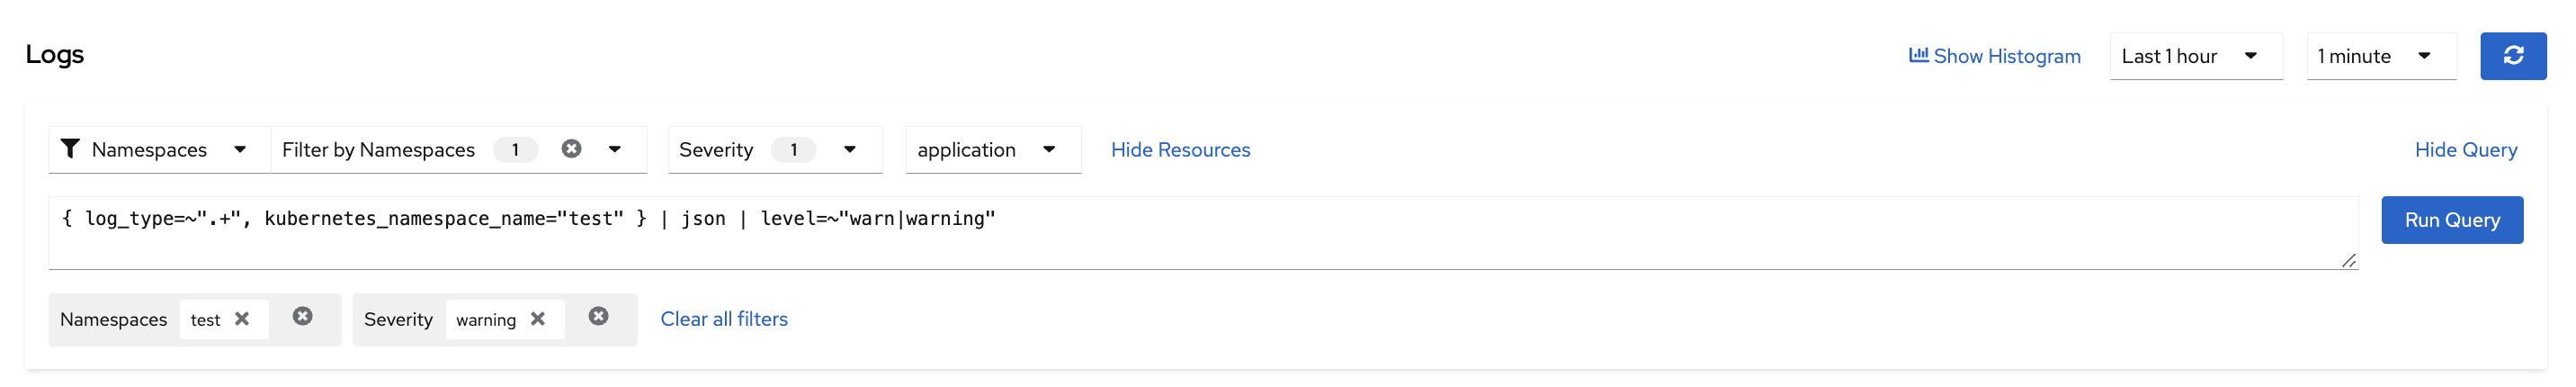
- Namesapceで
test、Severityでwarningを選択してみた場合のLogQL
{ log_type=~".+", kubernetes_namespace_name="test" } | json | level=~"warn|warning"
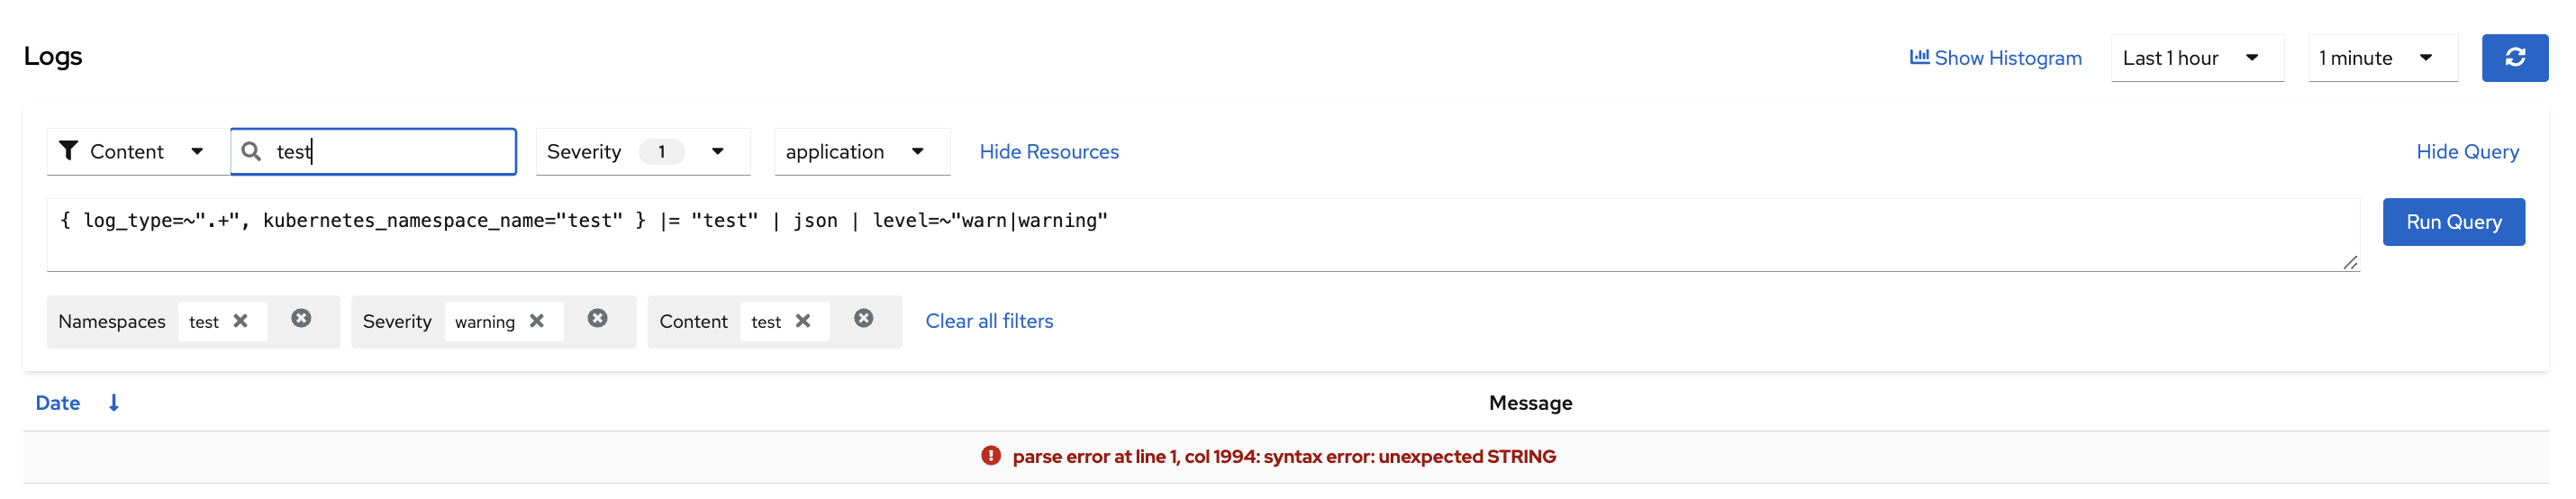
-
testという文字列検索を追加
{ log_type=~".+", kubernetes_namespace_name="test" } |= "test" | json | level=~"warn|warning"
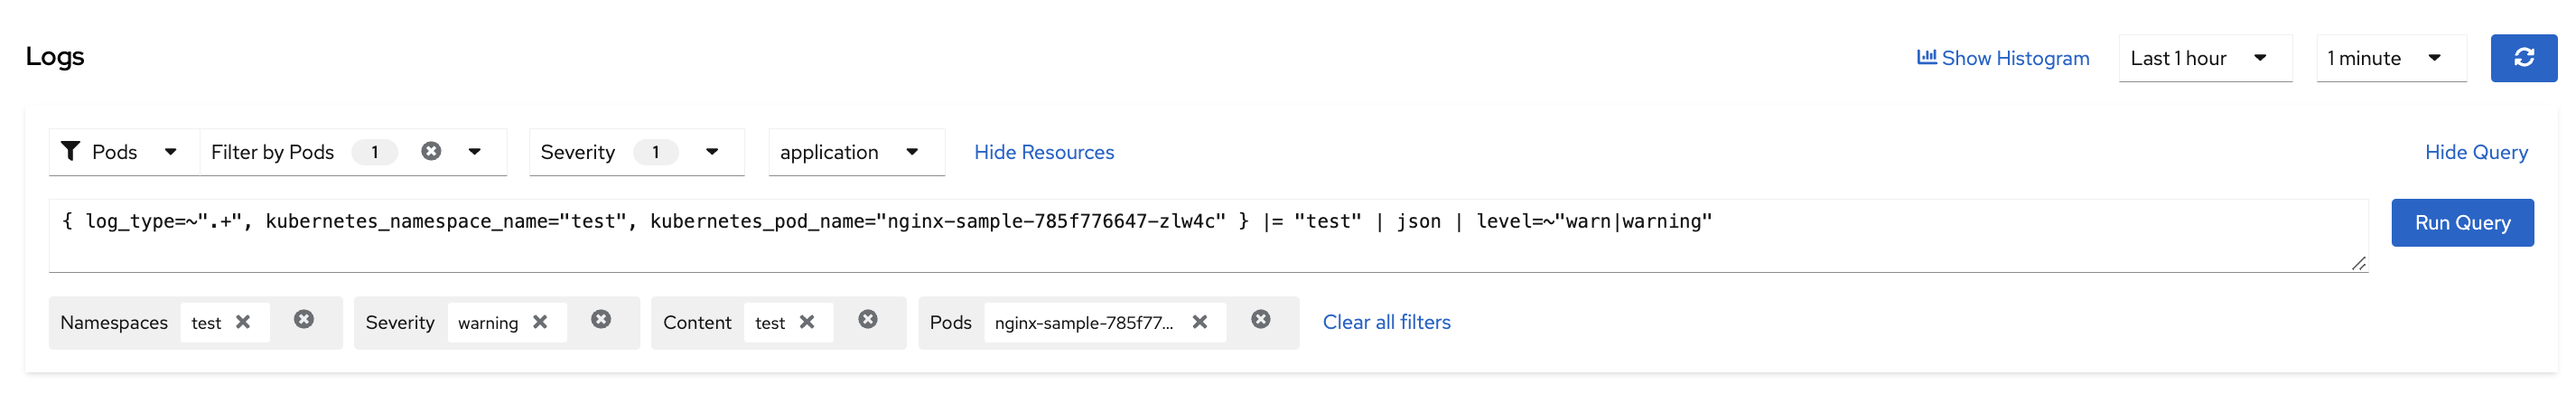
- Pod名も検索に追加
{ log_type=~".+", kubernetes_namespace_name="test", kubernetes_pod_name="nginx-sample-785f776647-zlw4c" } |= "test" | json | level=~"warn|warning"
なお、ログを展開すると、ログの詳細が見えます。
この黒字の部分がlabelと思われます。
LogQLでqueryする際には、この黒字の部分をkeyとして検索したりできました。
logcliコマンド実行例
OCPのコンソールのログ画面で確認できたログをlogcliで抽出してみます。
logcliの接続先
LokiStackのコンポーネントはGrafana Loki / Fundamentals / Architecture / Componentsに記載がありました。
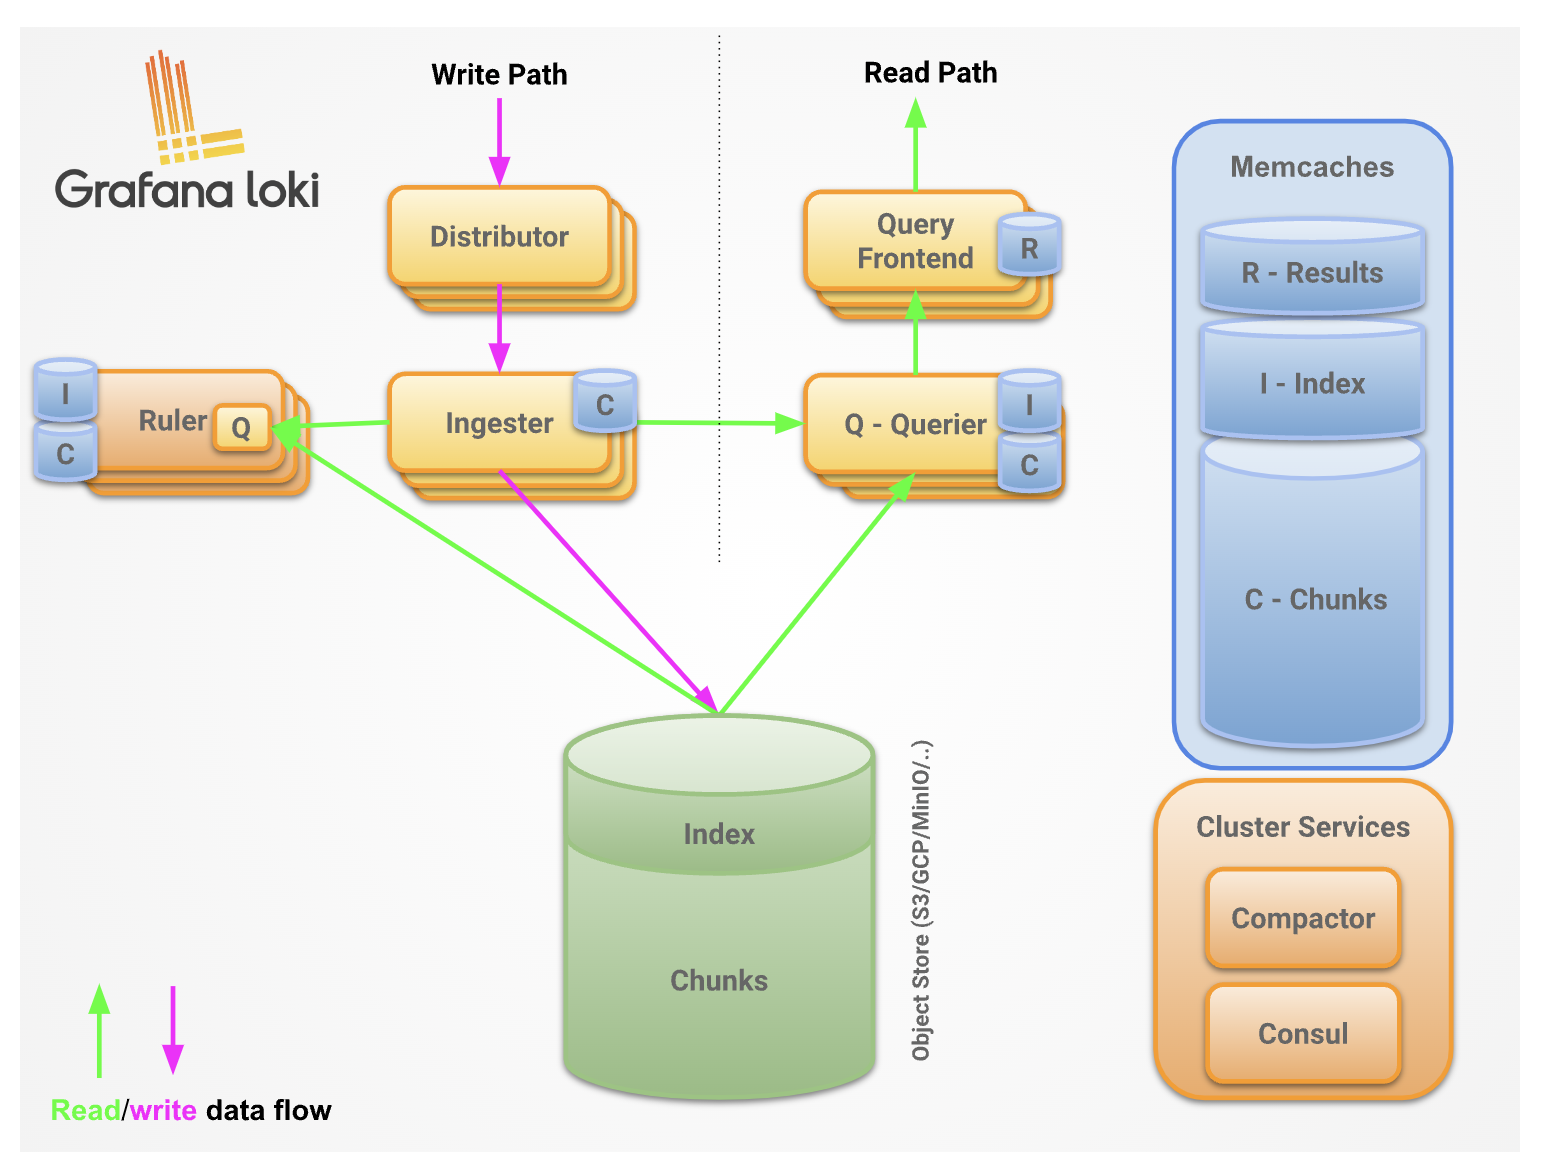
ログ検索に関するAPIは、Grafana Loki / HTTP APIを参照すると、Lokiのquerierかquery frontendのコンポーネントで公開されているようでした。
(抜粋)
These endpoints are exposed by the querier and the query frontend:
- GET /loki/api/v1/query
- GET /loki/api/v1/query_range
- GET /loki/api/v1/labels
- GET /loki/api/v1/label//values
- GET /loki/api/v1/series
- GET /loki/api/v1/index/stats
- GET /loki/api/v1/tail
- POST /loki/api/v1/push
- GET /ready
- GET /metrics
実際やってみてもquerierでもquery frontendでもlogcliで情報は取得できましたが、上述のコンポーネント図を見るとquery frontendから検索したほうが良いのか?と思い、今回はquery frontend経由で情報を取得することにしてみました。
(これが妥当なのかはどうなのだろうかまだよくわかっていません。。)
logcliでの接続先の指定の仕方
logcliコマンドの接続先は、コマンドオプションの--addrか、環境変数LOKI_ADDRで指定します。
Grafana Loki / Tools / LogCLI/ LogCLI usage / Grafana Cloud example
Lokistackのデフォルトではlogging-lokistack-gatewayに対するrouteしかなかったので、logging-lokistack-query-frontendには直接接続できませんでした。
[root@bastion-01 ~]# oc get route -n openshift-logging
NAME                HOST/PORT                                                           PATH   SERVICES                         PORT     TERMINATION   WILDCARD
logging-lokistack   logging-lokistack-openshift-logging.apps.cluster-01.example.local          logging-lokistack-gateway-http   public   reencrypt     None
[root@bastion-01 ~]#
一応logging-lokistack-query-frontendに関するServiceのlogging-lokistack-query-frontend-httpをexposeしてrouteを作成したりもしたのですが、なかなかうまくいきませんでした。
また、logcliには--proxy-urlというオプションもあったので、これを使っていろいろ指定してみたのですが、こちらもなかなかうまくいきませんでした。
この辺はもうちょっとちゃんと調べたらうまくできるのかもしれませんが、一旦諦めて、今回はquery-frontendのPodのServiceをPortfowardするという泥臭いやり方でとりあえずlogcliが実行できることだけ確認しました。
まずLoki関連のコンポーネントのリソースを確認します。
[root@bastion-01 ~]# oc get deployment -n openshift-logging
NAME                               READY   UP-TO-DATE   AVAILABLE   AGE
cluster-logging-operator           1/1     1            1           184d
logging-lokistack-distributor      2/2     2            2           8d
logging-lokistack-gateway          1/1     1            1           8d
logging-lokistack-querier          2/2     2            2           8d
logging-lokistack-query-frontend   2/2     2            2           8d
logging-view-plugin                1/1     1            1           8d
[root@bastion-01 ~]#
[root@bastion-01 ~]# oc get statefulset -n openshift-logging
NAME                              READY   AGE
logging-lokistack-compactor       1/1     8d
logging-lokistack-index-gateway   2/2     8d
logging-lokistack-ingester        2/2     8d
[root@bastion-01 ~]#
[root@bastion-01 ~]# oc get daemonset -n openshift-logging
NAME        DESIRED   CURRENT   READY   UP-TO-DATE   AVAILABLE   NODE SELECTOR            AGE
collector   11        11        11      11           11          kubernetes.io/os=linux   8d
[root@bastion-01 ~]#
routeはlogging-lokistack-gateway-httpのみが存在します。
[root@bastion-01 ~]# oc get route -n openshift-logging
NAME                HOST/PORT                                                           PATH   SERVICES                         PORT     TERMINATION   WILDCARD
logging-lokistack   logging-lokistack-openshift-logging.apps.cluster-01.example.local          logging-lokistack-gateway-http   public   reencrypt     None
[root@bastion-01 ~]#
Serviceを確認します。
[root@bastion-01 ~]# oc get svc -n openshift-logging
NAME                                    TYPE        CLUSTER-IP       EXTERNAL-IP   PORT(S)                      AGE
cluster-logging-operator-metrics        ClusterIP   172.30.127.223   <none>        8686/TCP                     184d
collector                               ClusterIP   172.30.176.100   <none>        24231/TCP,2112/TCP           8d
logging-lokistack-compactor-grpc        ClusterIP   None             <none>        9095/TCP                     8d
logging-lokistack-compactor-http        ClusterIP   172.30.240.41    <none>        3100/TCP                     8d
logging-lokistack-distributor-grpc      ClusterIP   None             <none>        9095/TCP                     8d
logging-lokistack-distributor-http      ClusterIP   172.30.182.1     <none>        3100/TCP                     8d
logging-lokistack-gateway-http          ClusterIP   172.30.107.150   <none>        8080/TCP,8081/TCP,8083/TCP   8d
logging-lokistack-gossip-ring           ClusterIP   None             <none>        7946/TCP                     8d
logging-lokistack-index-gateway-grpc    ClusterIP   None             <none>        9095/TCP                     8d
logging-lokistack-index-gateway-http    ClusterIP   172.30.226.220   <none>        3100/TCP                     8d
logging-lokistack-ingester-grpc         ClusterIP   None             <none>        9095/TCP                     8d
logging-lokistack-ingester-http         ClusterIP   172.30.108.174   <none>        3100/TCP                     8d
logging-lokistack-querier-grpc          ClusterIP   None             <none>        9095/TCP                     8d
logging-lokistack-querier-http          ClusterIP   172.30.46.182    <none>        3100/TCP                     8d
logging-lokistack-query-frontend-grpc   ClusterIP   None             <none>        9095/TCP                     8d
logging-lokistack-query-frontend-http   ClusterIP   172.30.159.175   <none>        3100/TCP                     8d
logging-view-plugin                     ClusterIP   172.30.36.124    <none>        9443/TCP                     8d
[root@bastion-01 ~]#
今回はlogging-lokistack-query-frontendに接続しようと思うので、一旦logging-lokistack-query-frontend-httpのServiceをPortfowardします。
oc port-forward svc/logging-lokistack-querier-http 3100
出力例
[root@bastion-01 ~]# oc port-forward svc/logging-lokistack-querier-http 3100
Forwarding from 127.0.0.1:3100 -> 3100
Forwarding from [::1]:3100 -> 3100
別のTerminalを開き、logcliで接続をしてみます。
logcliのオプションとしては、以下を指定します。
| option | notes |
|---|---|
--addr=https://localhost:3100 |
ログ検索に関するAPIを公開しているLokiのquerierかquery frontendのコンポーネントのURL。今回は query frontendをローカルにportfowaredしたURLを指定。 |
--tls-skip-verify |
SSL証明書を無視する。 |
--org-id="infrastructure/application/audit" |
LokiのAPIでのtenant IDというもの。OCPコンソールのLog画面で指定する infrastructure/appliaction/auditに対応している模様。 |
これらのオプションをつけてlogcli labels、logcli queryなどを実施します。
labelの確認
まずlogcli labelsを見てみます。
logcli labelsのコマンドオプションは以下で確認できます。
Grafana Loki / Tools / LogCLI / LogCLI command reference / LogCLI labels command reference
tenant IDがinfrastructureの場合
logcli --addr=https://localhost:3100 --tls-skip-verify --org-id=infrastructure labels
logcli --addr=https://localhost:3100 --tls-skip-verify --org-id=application labels
出力例
[root@bastion-01 ~]# logcli --addr=https://localhost:3100 --tls-skip-verify --org-id=infrastructure labels
2023/01/13 19:50:03 https://localhost:3100/loki/api/v1/labels?end=1673607003035341060&start=1673603403035341060
kubernetes_container_name
kubernetes_host
kubernetes_namespace_name
kubernetes_pod_name
log_type
[root@bastion-01 ~]#
[root@bastion-01 ~]# logcli --addr=https://localhost:3100 --tls-skip-verify --org-id=application labels
2023/01/13 19:50:10 https://localhost:3100/loki/api/v1/labels?end=1673607010900039969&start=1673603410900039969
kubernetes_container_name
kubernetes_host
kubernetes_namespace_name
kubernetes_pod_name
log_type
[root@bastion-01 ~]#
(--quietをつけないと実際にどのようにAPIが呼ばれているのか見えるのでlogcliではなくcurlでやる場合に参考になります。)
queryの実施
logcli queryのコマンドオプションは以下で確認できます。
Grafana Loki / Tools / LogCLI / LogCLI command reference / LogCLI query command reference
queryの実施(application)
まずはapplicationのログを見てみます。(--org-id=application)
--outputオプションの指定値は以下となり、出力する情報を調整できます。
raw: log line
default: log timestamp + log labels + log line
jsonl: JSON response from Loki API of log line
--output=defaultの場合
timstampとlog labels、log lineが確認できます。
[root@bastion-01 ~]# logcli --addr=https://localhost:3100 --tls-skip-verify --org-id=application query --output=default '{ log_type=~".+", kubernetes_namespace_name="test" } | json' | jq
2023/01/13 20:18:47 https://localhost:3100/loki/api/v1/query_range?direction=BACKWARD&end=1673608727710659999&limit=30&query=%7B+log_type%3D~%22.%2B%22%2C+kubernetes_namespace_name%3D%22test%22+%7D+%7C+json&start=1673605127710659999
2023/01/13 20:18:47 Common labels: {file="/var/log/pods/test_nginx-sample-785f776647-zlw4c_aad4ae08-d47b-4a1c-b614-fbaccc375339/nginx-sample/0.log", hostname="worker-01", kubernetes_annotations_k8s_v1_cni_cncf_io_network_status="[{\n    \"name\": \"openshift-sdn\",\n    \"interface\": \"eth0\",\n    \"ips\": [\n        \"10.131.3.3\"\n    ],\n    \"default\": true,\n    \"dns\": {}\n}]", kubernetes_annotations_k8s_v1_cni_cncf_io_networks_status="[{\n    \"name\": \"openshift-sdn\",\n    \"interface\": \"eth0\",\n    \"ips\": [\n        \"10.131.3.3\"\n    ],\n    \"default\": true,\n    \"dns\": {}\n}]", kubernetes_annotations_openshift_io_scc="restricted-v2", kubernetes_annotations_seccomp_security_alpha_kubernetes_io_pod="runtime/default", kubernetes_container_id="cri-o://9de13a3bd7dd97b9557dc8acf71790981591cda55972d32d3a8c1724178739ab", kubernetes_container_image="image-registry.openshift-image-registry.svc:5000/test/nginx-sample@sha256:9661529b8e8bb5307da4c35546ca9165d3fa38c7c36d627027b706c8e3ee5d52", kubernetes_container_name="nginx-sample", kubernetes_container_name_extracted="nginx-sample", kubernetes_host="worker-01", kubernetes_labels_app="nginx-sample", kubernetes_labels_deployment="nginx-sample", kubernetes_labels_pod_template_hash="785f776647", kubernetes_namespace_labels_kubernetes_io_metadata_name="test", kubernetes_namespace_labels_pod_security_kubernetes_io_audit="baseline", kubernetes_namespace_labels_pod_security_kubernetes_io_audit_version="v1.24", kubernetes_namespace_labels_pod_security_kubernetes_io_warn="baseline", kubernetes_namespace_labels_pod_security_kubernetes_io_warn_version="v1.24", kubernetes_namespace_name="test", kubernetes_namespace_name_extracted="test", kubernetes_pod_id="aad4ae08-d47b-4a1c-b614-fbaccc375339", kubernetes_pod_ip="10.131.3.3", kubernetes_pod_name="nginx-sample-785f776647-zlw4c", kubernetes_pod_name_extracted="nginx-sample-785f776647-zlw4c", kubernetes_pod_owner="ReplicaSet/nginx-sample-785f776647", level="default", log_type="application", log_type_extracted="application"}
2023/01/13 20:18:47 https://localhost:3100/loki/api/v1/query_range?direction=BACKWARD&end=1673606358229544200&limit=23&query=%7B+log_type%3D~%22.%2B%22%2C+kubernetes_namespace_name%3D%22test%22+%7D+%7C+json&start=1673605127710659999
parse error: Invalid numeric literal at line 1, column 14
2023/01/13 20:18:47 Common labels: {_timestamp="2023-01-13T10:39:08.641318527Z", file="/var/log/pods/test_nginx-sample-785f776647-zlw4c_aad4ae08-d47b-4a1c-b614-fbaccc375339/nginx-sample/0.log", hostname="worker-01", kubernetes_annotations_k8s_v1_cni_cncf_io_network_status="[{\n    \"name\": \"openshift-sdn\",\n    \"interface\": \"eth0\",\n    \"ips\": [\n        \"10.131.3.3\"\n    ],\n    \"default\": true,\n    \"dns\": {}\n}]", kubernetes_annotations_k8s_v1_cni_cncf_io_networks_status="[{\n    \"name\": \"openshift-sdn\",\n    \"interface\": \"eth0\",\n    \"ips\": [\n        \"10.131.3.3\"\n    ],\n    \"default\": true,\n    \"dns\": {}\n}]", kubernetes_annotations_openshift_io_scc="restricted-v2", kubernetes_annotations_seccomp_security_alpha_kubernetes_io_pod="runtime/default", kubernetes_container_id="cri-o://9de13a3bd7dd97b9557dc8acf71790981591cda55972d32d3a8c1724178739ab", kubernetes_container_image="image-registry.openshift-image-registry.svc:5000/test/nginx-sample@sha256:9661529b8e8bb5307da4c35546ca9165d3fa38c7c36d627027b706c8e3ee5d52", kubernetes_container_name="nginx-sample", kubernetes_container_name_extracted="nginx-sample", kubernetes_host="worker-01", kubernetes_labels_app="nginx-sample", kubernetes_labels_deployment="nginx-sample", kubernetes_labels_pod_template_hash="785f776647", kubernetes_namespace_labels_kubernetes_io_metadata_name="test", kubernetes_namespace_labels_pod_security_kubernetes_io_audit="baseline", kubernetes_namespace_labels_pod_security_kubernetes_io_audit_version="v1.24", kubernetes_namespace_labels_pod_security_kubernetes_io_warn="baseline", kubernetes_namespace_labels_pod_security_kubernetes_io_warn_version="v1.24", kubernetes_namespace_name="test", kubernetes_namespace_name_extracted="test", kubernetes_pod_id="aad4ae08-d47b-4a1c-b614-fbaccc375339", kubernetes_pod_ip="10.131.3.3", kubernetes_pod_name="nginx-sample-785f776647-zlw4c", kubernetes_pod_name_extracted="nginx-sample-785f776647-zlw4c", kubernetes_pod_owner="ReplicaSet/nginx-sample-785f776647", level="default", log_type="application", log_type_extracted="application", message="10.130.2.1 - - [13/Jan/2023:10:39:08 +0000] \"GET /favicon.ico HTTP/1.1\" 404 555 \"http://nginx-sample-test.apps.cluster-01.example.local/\" \"Mozilla/5.0 (Macintosh; Intel Mac OS X 10_15_7) AppleWebKit/537.36 (KHTML, like Gecko) Chrome/108.0.0.0 Safari/537.36\" \"172.16.100.11\""}
[root@bastion-01 ~]#
--output=jsonlの場合
json形式で表示されます。これだけだとlabelsは何も表示されていませんでした。
また、log line部分も少し見づらいかなと思います。
[root@bastion-01 ~]# logcli --addr=https://localhost:3100 --tls-skip-verify --org-id=application query --output=jsonl '{ log_type=~".+", kubernetes_namespace_name="test"}' | jq
2023/01/13 20:20:56 https://localhost:3100/loki/api/v1/query_range?direction=BACKWARD&end=1673608856316991785&limit=30&query=%7B+log_type%3D~%22.%2B%22%2C+kubernetes_namespace_name%3D%22test%22%7D&start=1673605256316991785
2023/01/13 20:20:56 Common labels: {kubernetes_container_name="nginx-sample", kubernetes_host="worker-01", kubernetes_namespace_name="test", kubernetes_pod_name="nginx-sample-785f776647-zlw4c", log_type="application"}
{
  "labels": {},
  "line": "{\"@timestamp\":\"2023-01-13T10:39:28.108631523Z\",\"file\":\"/var/log/pods/test_nginx-sample-785f776647-zlw4c_aad4ae08-d47b-4a1c-b614-fbaccc375339/nginx-sample/0.log\",\"hostname\":\"worker-01\",\"kubernetes\":{\"annotations\":{\"k8s.v1.cni.cncf.io/network-status\":\"[{\\n    \\\"name\\\": \\\"openshift-sdn\\\",\\n    \\\"interface\\\": \\\"eth0\\\",\\n    \\\"ips\\\": [\\n        \\\"10.131.3.3\\\"\\n    ],\\n    \\\"default\\\": true,\\n    \\\"dns\\\": {}\\n}]\",\"k8s.v1.cni.cncf.io/networks-status\":\"[{\\n    \\\"name\\\": \\\"openshift-sdn\\\",\\n    \\\"interface\\\": \\\"eth0\\\",\\n    \\\"ips\\\": [\\n        \\\"10.131.3.3\\\"\\n    ],\\n    \\\"default\\\": true,\\n    \\\"dns\\\": {}\\n}]\",\"openshift.io/scc\":\"restricted-v2\",\"seccomp.security.alpha.kubernetes.io/pod\":\"runtime/default\"},\"container_id\":\"cri-o://9de13a3bd7dd97b9557dc8acf71790981591cda55972d32d3a8c1724178739ab\",\"container_image\":\"image-registry.openshift-image-registry.svc:52023/01/13 20:20:56 https://localhost:3100/loki/api/v1/query_range?direction=BACKWARD&end=1673606358229544200&limit=23&query=%7B+log_type%3D~%22.%2B%22%2C+kubernetes_namespace_name%3D%22test%22%7D&start=1673605256316991785
000/test/nginx-sample@sha256:9661529b8e8bb5307da4c35546ca9165d3fa38c7c36d627027b706c8e3ee5d52\",\"container_name\":\"nginx-sample\",\"labels\":{\"app\":\"nginx-sample\",\"deployment\":\"nginx-sample\",\"pod-template-hash\":\"785f776647\"},\"namespace_labels\":{\"kubernetes.io/metadata.name\":\"test\",\"pod-security.kubernetes.io/audit\":\"baseline\",\"pod-security.kubernetes.io/audit-version\":\"v1.24\",\"pod-security.kubernetes.io/warn\":\"baseline\",\"pod-security.kubernetes.io/warn-version\":\"v1.24\"},\"namespace_name\":\"test\",\"pod_id\":\"aad4ae08-d47b-4a1c-b614-fbaccc375339\",\"pod_ip\":\"10.131.3.3\",\"pod_name\":\"nginx-sample-785f776647-zlw4c\",\"pod_owner\":\"ReplicaSet/nginx-sample-785f776647\"},\"level\":\"default\",\"log_type\":\"application\",\"message\":\"10.130.2.1 - - [13/Jan/2023:10:39:28 +0000] \\\"GET / HTTP/1.1\\\" 304 0 \\\"-\\\" \\\"Mozilla/5.0 (Macintosh; Intel Mac OS X 10_15_7) AppleWebKit/537.36 (KHTML, like Gecko) Chrome/108.0.0.0 Safari/537.36\\\" \\\"172.16.100.11\\\"\"}",
  "timestamp": "2023-01-13T19:39:28.545469387+09:00"
}
略
補足として--quietオプションをつけるとメタデータが表示されなくなります。
[root@bastion-01 ~]# logcli --addr=https://localhost:3100 --tls-skip-verify --org-id=application query --quiet --output=jsonl '{ log_type=~".+", kubernetes_namespace_name="test"}' | jq
{
  "labels": {},
  "line": "{\"@timestamp\":\"2023-01-13T10:39:28.108631523Z\",\"file\":\"/var/log/pods/test_nginx-sample-785f776647-zlw4c_aad4ae08-d47b-4a1c-b614-fbaccc375339/nginx-sample/0.log\",\"hostname\":\"worker-01\",\"kubernetes\":{\"annotations\":{\"k8s.v1.cni.cncf.io/network-status\":\"[{\\n    \\\"name\\\": \\\"openshift-sdn\\\",\\n    \\\"interface\\\": \\\"eth0\\\",\\n    \\\"ips\\\": [\\n        \\\"10.131.3.3\\\"\\n    ],\\n    \\\"default\\\": true,\\n    \\\"dns\\\": {}\\n}]\",\"k8s.v1.cni.cncf.io/networks-status\":\"[{\\n    \\\"name\\\": \\\"openshift-sdn\\\",\\n    \\\"interface\\\": \\\"eth0\\\",\\n    \\\"ips\\\": [\\n        \\\"10.131.3.3\\\"\\n    ],\\n    \\\"default\\\": true,\\n    \\\"dns\\\": {}\\n}]\",\"openshift.io/scc\":\"restricted-v2\",\"seccomp.security.alpha.kubernetes.io/pod\":\"runtime/default\"},\"container_id\":\"cri-o://9de13a3bd7dd97b9557dc8acf71790981591cda55972d32d3a8c1724178739ab\",\"container_image\":\"image-registry.openshift-image-registry.svc:5000/test/nginx-sample@sha256:9661529b8e8bb5307da4c35546ca9165d3fa38c7c36d627027b706c8e3ee5d52\",\"container_name\":\"nginx-sample\",\"labels\":{\"app\":\"nginx-sample\",\"deployment\":\"nginx-sample\",\"pod-template-hash\":\"785f776647\"},\"namespace_labels\":{\"kubernetes.io/metadata.name\":\"test\",\"pod-security.kubernetes.io/audit\":\"baseline\",\"pod-security.kubernetes.io/audit-version\":\"v1.24\",\"pod-security.kubernetes.io/warn\":\"baseline\",\"pod-security.kubernetes.io/warn-version\":\"v1.24\"},\"namespace_name\":\"test\",\"pod_id\":\"aad4ae08-d47b-4a1c-b614-fbaccc375339\",\"pod_ip\":\"10.131.3.3\",\"pod_name\":\"nginx-sample-785f776647-zlw4c\",\"pod_owner\":\"ReplicaSet/nginx-sample-785f776647\"},\"level\":\"default\",\"log_type\":\"application\",\"message\":\"10.130.2.1 - - [13/Jan/2023:10:39:28 +0000] \\\"GET / HTTP/1.1\\\" 304 0 \\\"-\\\" \\\"Mozilla/5.0 (Macintosh; Intel Mac OS X 10_15_7) AppleWebKit/537.36 (KHTML, like Gecko) Chrome/108.0.0.0 Safari/537.36\\\" \\\"172.16.100.11\\\"\"}",
  "timestamp": "2023-01-13T19:39:28.545469387+09:00"
}
略
検索条件に| jsonというのをつけると、labels部分に_timestampとmesageが表示されるようになりました。
ただ、log line部分はそれでもまだ見づらいままです。
[root@bastion-01 ~]# logcli --addr=https://localhost:3100 --tls-skip-verify --org-id=application query --quiet --output=jsonl '{ log_type=~".+", kubernetes_namespace_name="test" } | json' | jq
{
  "labels": {
    "_timestamp": "2023-01-13T10:39:28.108631523Z",
    "message": "10.130.2.1 - - [13/Jan/2023:10:39:28 +0000] \"GET / HTTP/1.1\" 304 0 \"-\" \"Mozilla/5.0 (Macintosh; Intel Mac OS X 10_15_7) AppleWebKit/537.36 (KHTML, like Gecko) Chrome/108.0.0.0 Safari/537.36\" \"172.16.100.11\""
  },
  "line": "{\"@timestamp\":\"2023-01-13T10:39:28.108631523Z\",\"file\":\"/var/log/pods/test_nginx-sample-785f776647-zlw4c_aad4ae08-d47b-4a1c-b614-fbaccc375339/nginx-sample/0.log\",\"hostname\":\"worker-01\",\"kubernetes\":{\"annotations\":{\"k8s.v1.cni.cncf.io/network-status\":\"[{\\n    \\\"name\\\": \\\"openshift-sdn\\\",\\n    \\\"interface\\\": \\\"eth0\\\",\\n    \\\"ips\\\": [\\n        \\\"10.131.3.3\\\"\\n    ],\\n    \\\"default\\\": true,\\n    \\\"dns\\\": {}\\n}]\",\"k8s.v1.cni.cncf.io/networks-status\":\"[{\\n    \\\"name\\\": \\\"openshift-sdn\\\",\\n    \\\"interface\\\": \\\"eth0\\\",\\n    \\\"ips\\\": [\\n        \\\"10.131.3.3\\\"\\n    ],\\n    \\\"default\\\": true,\\n    \\\"dns\\\": {}\\n}]\",\"openshift.io/scc\":\"restricted-v2\",\"seccomp.security.alpha.kubernetes.io/pod\":\"runtime/default\"},\"container_id\":\"cri-o://9de13a3bd7dd97b9557dc8acf71790981591cda55972d32d3a8c1724178739ab\",\"container_image\":\"image-registry.openshift-image-registry.svc:5000/test/nginx-sample@sha256:9661529b8e8bb5307da4c35546ca9165d3fa38c7c36d627027b706c8e3ee5d52\",\"container_name\":\"nginx-sample\",\"labels\":{\"app\":\"nginx-sample\",\"deployment\":\"nginx-sample\",\"pod-template-hash\":\"785f776647\"},\"namespace_labels\":{\"kubernetes.io/metadata.name\":\"test\",\"pod-security.kubernetes.io/audit\":\"baseline\",\"pod-security.kubernetes.io/audit-version\":\"v1.24\",\"pod-security.kubernetes.io/warn\":\"baseline\",\"pod-security.kubernetes.io/warn-version\":\"v1.24\"},\"namespace_name\":\"test\",\"pod_id\":\"aad4ae08-d47b-4a1c-b614-fbaccc375339\",\"pod_ip\":\"10.131.3.3\",\"pod_name\":\"nginx-sample-785f776647-zlw4c\",\"pod_owner\":\"ReplicaSet/nginx-sample-785f776647\"},\"level\":\"default\",\"log_type\":\"application\",\"message\":\"10.130.2.1 - - [13/Jan/2023:10:39:28 +0000] \\\"GET / HTTP/1.1\\\" 304 0 \\\"-\\\" \\\"Mozilla/5.0 (Macintosh; Intel Mac OS X 10_15_7) AppleWebKit/537.36 (KHTML, like Gecko) Chrome/108.0.0.0 Safari/537.36\\\" \\\"172.16.100.11\\\"\"}",
  "timestamp": "2023-01-13T19:39:28.545469387+09:00"
}
(略)
--output=rawの場合
log lineがjson形式で表示されました。
jqなどで整形して情報を取得したい場合などは、--output=rawが良さそうだなと思います。
[root@bastion-01 ~]# logcli --addr=https://localhost:3100 --tls-skip-verify --org-id=application query --quiet --output=raw '{ log_type=~".+", kubernetes_namespace_name="test" } | json' | jq
{
  "@timestamp": "2023-01-13T10:39:28.108631523Z",
  "file": "/var/log/pods/test_nginx-sample-785f776647-zlw4c_aad4ae08-d47b-4a1c-b614-fbaccc375339/nginx-sample/0.log",
  "hostname": "worker-01",
  "kubernetes": {
    "annotations": {
      "k8s.v1.cni.cncf.io/network-status": "[{\n    \"name\": \"openshift-sdn\",\n    \"interface\": \"eth0\",\n    \"ips\": [\n        \"10.131.3.3\"\n    ],\n    \"default\": true,\n    \"dns\": {}\n}]",
      "k8s.v1.cni.cncf.io/networks-status": "[{\n    \"name\": \"openshift-sdn\",\n    \"interface\": \"eth0\",\n    \"ips\": [\n        \"10.131.3.3\"\n    ],\n    \"default\": true,\n    \"dns\": {}\n}]",
      "openshift.io/scc": "restricted-v2",
      "seccomp.security.alpha.kubernetes.io/pod": "runtime/default"
    },
    "container_id": "cri-o://9de13a3bd7dd97b9557dc8acf71790981591cda55972d32d3a8c1724178739ab",
    "container_image": "image-registry.openshift-image-registry.svc:5000/test/nginx-sample@sha256:9661529b8e8bb5307da4c35546ca9165d3fa38c7c36d627027b706c8e3ee5d52",
    "container_name": "nginx-sample",
    "labels": {
      "app": "nginx-sample",
      "deployment": "nginx-sample",
      "pod-template-hash": "785f776647"
    },
    "namespace_labels": {
      "kubernetes.io/metadata.name": "test",
      "pod-security.kubernetes.io/audit": "baseline",
      "pod-security.kubernetes.io/audit-version": "v1.24",
      "pod-security.kubernetes.io/warn": "baseline",
      "pod-security.kubernetes.io/warn-version": "v1.24"
    },
    "namespace_name": "test",
    "pod_id": "aad4ae08-d47b-4a1c-b614-fbaccc375339",
    "pod_ip": "10.131.3.3",
    "pod_name": "nginx-sample-785f776647-zlw4c",
    "pod_owner": "ReplicaSet/nginx-sample-785f776647"
  },
  "level": "default",
  "log_type": "application",
  "message": "10.130.2.1 - - [13/Jan/2023:10:39:28 +0000] \"GET / HTTP/1.1\" 304 0 \"-\" \"Mozilla/5.0 (Macintosh; Intel Mac OS X 10_15_7) AppleWebKit/537.36 (KHTML, like Gecko) Chrome/108.0.0.0 Safari/537.36\" \"172.16.100.11\""
}
(略)
ここまで表示できると、この辺りの情報から、jqで情報を整形して、必要な情報のみを抽出したログファイルを作成することなどができそうです。
例として、jqで、出力を@timestanp、.level、.kubelnetes.namespace_name、.kubernetes.pod_name、.messageのみにしてみました。
[root@bastion-01 ~]# logcli --addr=https://localhost:3100 --tls-skip-verify --org-id=application query --quiet --output=raw '{ log_type=~".+", kubernetes_namespace_name="test" } | json' | jq -r '. | {timestamp:."@timestamp", level:.level, namespace:.kubernetes.namespace_name, pod:.kubernetes.pod_name, message:.message}'
{
  "timestamp": "2023-01-13T11:41:01.922488973Z",
  "level": "default",
  "namespace": "test",
  "pod": "nginx-sample-785f776647-zlw4c",
  "message": "10.130.2.1 - - [13/Jan/2023:11:41:01 +0000] \"GET /aaa HTTP/1.1\" 404 555 \"-\" \"Mozilla/5.0 (Macintosh; Intel Mac OS X 10_15_7) AppleWebKit/537.36 (KHTML, like Gecko) Chrome/108.0.0.0 Safari/537.36\" \"172.16.100.11\""
}
{
  "timestamp": "2023-01-13T11:41:01.922427779Z",
  "level": "default",
  "namespace": "test",
  "pod": "nginx-sample-785f776647-zlw4c",
  "message": "2023/01/13 11:41:01 [error] 25#0: *3 open() \"/opt/app-root/src/aaa\" failed (2: No such file or directory), client: 10.130.2.1, server: _, request: \"GET /aaa HTTP/1.1\", host: \"nginx-sample-test.apps.cluster-01.example.local\""
}
(略)
あとはいろいろ検索条件をつけて必要なログのみ抽出することができます。
LogQLの例としては、前述のOCPコンソールからLogQLを確認してみるで確認した以下のような検索条件などが使えるかと思います。
- Namesapceで
test、Severityでwarningを選択してみた場合のLogQL
{ log_type=~".+", kubernetes_namespace_name="test" } | json | level=~"warn|warning"
-
testという文字列検索を追加
{ log_type=~".+", kubernetes_namespace_name="test" } |= "test" | json | level=~"warn|warning"
- Pod名も検索に追加
{ log_type=~".+", kubernetes_namespace_name="test", kubernetes_pod_name="nginx-sample-785f776647-zlw4c" } |= "test" | json | level=~"warn|warning"
queryの実施(infrastructure)
次にinfrastructureのログを見てみます。(--org-id=infrastructure)
logcli --addr=https://localhost:3100 --tls-skip-verify --org-id=infrastructure query --quiet --output=raw '{ log_type=~".+" } | json' | jq
(出力例)
[root@bastion-01 ~]# logcli --addr=https://localhost:3100 --tls-skip-verify --org-id=infrastructure query --quiet --output=raw '{ log_type=~".+" } | json' | jq
{
  "@timestamp": "2023-01-13T12:00:03.234160362Z",
  "file": "/var/log/pods/openshift-storage_rook-ceph-mds-ocs-storagecluster-cephfilesystem-b-5b6776b5xqfph_5a3dd1df-88ff-4ddb-8e0c-18eea0adb35a/mds/0.log",
  "hostname": "storage-02",
  "kubernetes": {
    "annotations": {
      "k8s.v1.cni.cncf.io/network-status": "[{\n    \"name\": \"openshift-sdn\",\n    \"interface\": \"eth0\",\n    \"ips\": [\n        \"10.129.4.19\"\n    ],\n    \"default\": true,\n    \"dns\": {}\n}]",
      "k8s.v1.cni.cncf.io/networks-status": "[{\n    \"name\": \"openshift-sdn\",\n    \"interface\": \"eth0\",\n    \"ips\": [\n        \"10.129.4.19\"\n    ],\n    \"default\": true,\n    \"dns\": {}\n}]",
      "openshift.io/scc": "rook-ceph"
    },
    "container_id": "cri-o://20507a80792f05b11a7f0964e7a6a0eb5f2f765c61735abd513b74c2c628c3ef",
    "container_image": "registry.redhat.io/rhceph/rhceph-5-rhel8@sha256:7892e9da0a70b2d7e3efd98d2cb980e485f07eddff6a0dac6d6bd6c516914f3c",
    "container_name": "mds",
    "labels": {
      "app": "rook-ceph-mds",
      "app.kubernetes.io/component": "cephfilesystems.ceph.rook.io",
      "app.kubernetes.io/created-by": "rook-ceph-operator",
      "app.kubernetes.io/instance": "ocs-storagecluster-cephfilesystem-b",
      "app.kubernetes.io/managed-by": "rook-ceph-operator",
      "app.kubernetes.io/name": "ceph-mds",
      "app.kubernetes.io/part-of": "ocs-storagecluster-cephfilesystem",
      "ceph_daemon_id": "ocs-storagecluster-cephfilesystem-b",
      "ceph_daemon_type": "mds",
      "mds": "ocs-storagecluster-cephfilesystem-b",
      "pod-template-hash": "5b6776b569",
      "rook.io/operator-namespace": "openshift-storage",
      "rook_cluster": "openshift-storage",
      "rook_file_system": "ocs-storagecluster-cephfilesystem"
    },
    "namespace_labels": {
      "kubernetes.io/metadata.name": "openshift-storage",
      "olm.operatorgroup.uid/e244cb52-c6ab-4ec7-9564-0bfbea0f65cf": "",
      "olm.operatorgroup.uid/e8e1159e-eaeb-4d82-a5de-67d913cf00ca": "",
      "openshift.io/cluster-monitoring": "true"
    },
    "namespace_name": "openshift-storage",
    "pod_id": "5a3dd1df-88ff-4ddb-8e0c-18eea0adb35a",
    "pod_ip": "10.129.4.19",
    "pod_name": "rook-ceph-mds-ocs-storagecluster-cephfilesystem-b-5b6776b5xqfph",
    "pod_owner": "ReplicaSet/rook-ceph-mds-ocs-storagecluster-cephfilesystem-b-5b6776b569"
  },
  "level": "default",
  "log_type": "infrastructure",
  "message": "debug 2023-01-13T12:00:03.233+0000 7f489696c700  1 mds.ocs-storagecluster-cephfilesystem-b asok_command: status {prefix=status} (starting...)"
}
(略)
あとは上述で表示されたlabelを参考に、検索条件をいろいろ変えると必要な情報が取得できます。
(例)storage-02のnodeのログのみ抽出
{ log_type=~".+" } | json | hostname=~"storage-02"
(出力例)
[root@bastion-01 ~]# logcli --addr=https://localhost:3100 --tls-skip-verify --org-id=infrastructure query --quiet --output=raw '{ log_type=~".+" } | json | hostname=~"storage-02"' | jq
{
  "@timestamp": "2023-01-13T12:09:26.854047175Z",
  "file": "/var/log/pods/openshift-storage_rook-ceph-mon-c-74d5c57cc-hhm7z_d4b6827d-4cbb-4c35-a97a-247b3cbae889/mon/0.log",
  "hostname": "storage-02",
  "kubernetes": {
    "annotations": {
      "k8s.v1.cni.cncf.io/network-status": "[{\n    \"name\": \"openshift-sdn\",\n    \"interface\": \"eth0\",\n    \"ips\": [\n        \"10.129.4.14\"\n    ],\n    \"default\": true,\n    \"dns\": {}\n}]",
      "k8s.v1.cni.cncf.io/networks-status": "[{\n    \"name\": \"openshift-sdn\",\n    \"interface\": \"eth0\",\n    \"ips\": [\n        \"10.129.4.14\"\n    ],\n    \"default\": true,\n    \"dns\": {}\n}]",
      "openshift.io/scc": "rook-ceph"
    },
    "container_id": "cri-o://250e94cc56e7cba725c5d2f567ce14002eada787e497cf2c517c759456fe2abd",
    "container_image": "registry.redhat.io/rhceph/rhceph-5-rhel8@sha256:7892e9da0a70b2d7e3efd98d2cb980e485f07eddff6a0dac6d6bd6c516914f3c",
    "container_name": "mon",
    "labels": {
      "app": "rook-ceph-mon",
      "app.kubernetes.io/component": "cephclusters.ceph.rook.io",
      "app.kubernetes.io/created-by": "rook-ceph-operator",
      "app.kubernetes.io/instance": "c",
      "app.kubernetes.io/managed-by": "rook-ceph-operator",
      "app.kubernetes.io/name": "ceph-mon",
      "app.kubernetes.io/part-of": "ocs-storagecluster-cephcluster",
      "ceph_daemon_id": "c",
      "ceph_daemon_type": "mon",
      "mon": "c",
      "mon_cluster": "openshift-storage",
      "pod-template-hash": "74d5c57cc",
      "rook.io/operator-namespace": "openshift-storage",
      "rook_cluster": "openshift-storage"
    },
    "namespace_labels": {
      "kubernetes.io/metadata.name": "openshift-storage",
      "olm.operatorgroup.uid/e244cb52-c6ab-4ec7-9564-0bfbea0f65cf": "",
      "olm.operatorgroup.uid/e8e1159e-eaeb-4d82-a5de-67d913cf00ca": "",
      "openshift.io/cluster-monitoring": "true"
    },
    "namespace_name": "openshift-storage",
    "pod_id": "d4b6827d-4cbb-4c35-a97a-247b3cbae889",
    "pod_ip": "10.129.4.14",
    "pod_name": "rook-ceph-mon-c-74d5c57cc-hhm7z",
    "pod_owner": "ReplicaSet/rook-ceph-mon-c-74d5c57cc"
  },
  "level": "default",
  "log_type": "infrastructure",
  "message": "debug 2023-01-13T12:09:26.852+0000 7f92ea711700  1 mon.c@2(peon).osd e43 _set_new_cache_sizes cache_size:1020054731 inc_alloc: 71303168 full_alloc: 71303168 kv_alloc: 876609536"
}
(略)
(例)storage-02のnodeのseverityがerrorのログのみ抽出
{ log_type=~".+" } | json | hostname=~"storage-02" | level=~"error|err|eror"
(出力例)
[root@bastion-01 ~]# logcli --addr=https://localhost:3100 --tls-skip-verify --org-id=infrastructure query --quiet --output=raw '{ log_type=~".+" } | json | hostname=~"storage-02" | level=~"error|err|eror"' | jq
{
  "@timestamp": "2023-01-13T12:12:02.778068Z",
  "_STREAM_ID": "bc5416e6fce64ff28a8bd0f2d22e8ea0",
  "_SYSTEMD_INVOCATION_ID": "50a2f380a5424983985d6300858ab8f5",
  "hostname": "storage-02",
  "level": "error",
  "log_type": "infrastructure",
  "message": "E0113 12:12:02.778001    2173 kubelet_volumes.go:245] \"There were many similar errors. Turn up verbosity to see them.\" err=\"orphaned pod \\\"0188e4ae-e69f-4c91-9191-08d30cbe0772\\\" found, but error occurred when trying to remove the volumes dir: not a directory\" numErrs=9",
  "systemd": {
    "t": {
      "BOOT_ID": "8ea492c70e124859bd46a3a8b50b1cbd",
      "CAP_EFFECTIVE": "1ffffffffff",
      "CMDLINE": "kubelet --config=/etc/kubernetes/kubelet.conf --bootstrap-kubeconfig=/etc/kubernetes/kubeconfig --kubeconfig=/var/lib/kubelet/kubeconfig --container-runtime=remote --container-runtime-endpoint=/var/run/crio/crio.sock --runtime-cgroups=/system.slice/crio.service --node-labels=node-role.kubernetes.io/worker,node.openshift.io/os_id=rhcos --node-ip=172.16.100.21 --minimum-container-ttl-duration=6m0s --volume-plugin-dir=/etc/kubernetes/kubelet-plugins/volume/exec --cloud-provider= --hostname-override= --provider-id= --pod-infra-container-image=quay.io/openshift-release-dev/ocp-v4.0-art-dev@sha256:d66ecf52d7cded5bc62f7bfab10149fff2ce22068b00f4594a7620959feb9cb0 --system-reserved=cpu=500m,memory=1Gi --v=2",
      "COMM": "kubelet",
      "EXE": "/usr/bin/kubelet",
      "GID": "0",
      "MACHINE_ID": "78a0b435b82644ea86abebbb00b4299c",
      "PID": "2173",
      "SELINUX_CONTEXT": "system_u:system_r:kubelet_t:s0-s0:c0.c1023",
      "STREAM_ID": "bc5416e6fce64ff28a8bd0f2d22e8ea0",
      "SYSTEMD_CGROUP": "/system.slice/kubelet.service",
      "SYSTEMD_INVOCATION_ID": "50a2f380a5424983985d6300858ab8f5",
      "SYSTEMD_SLICE": "system.slice",
      "SYSTEMD_UNIT": "kubelet.service",
      "TRANSPORT": "stdout",
      "UID": "0"
    },
    "u": {
      "SYSLOG_FACILITY": "3",
      "SYSLOG_IDENTIFIER": "hyperkube"
    }
  },
  "tag": ".journal.system",
  "time": "2023-01-13T12:12:02+00:00"
}
(略)
(補足)その他のオプション
あとは、任意のrangeのログだけ抽出などもできそうでした。
[root@bastion-01 ~]# logcli query --help
usage: logcli query [<flags>] <query>

(略)

Example:

  logcli query
     --timezone=UTC
     --from="2021-01-19T10:00:00Z"
     --to="2021-01-19T20:00:00Z"
     --output=jsonl
     'my-query'
(略)
(補足)logcli queryの--tailオプション
logcli queryに--tailオプションを指定すると、CLIでもリアルタイムのログを確認することができます。
[root@bastion-01 ~]# logcli --addr=https://localhost:3100 --tls-skip-verify --org-id=application query --quiet --output=raw --tail '{ log_type=~".+", kubernetes_namespace_name="test" } | json' | jq -r '. | {timestamp:."@timestamp", level:.level, namespace:.kubernetes.namespace_name, pod:.kubernetes.pod_name, message:.message}'
{
  "timestamp": "2023-01-13T11:40:56.713334590Z",
  "level": "default",
  "namespace": "test",
  "pod": "nginx-sample-785f776647-zlw4c",
  "message": "10.130.2.1 - - [13/Jan/2023:11:40:56 +0000] \"GET / HTTP/1.1\" 304 0 \"-\" \"Mozilla/5.0 (Macintosh; Intel Mac OS X 10_15_7) AppleWebKit/537.36 (KHTML, like Gecko) Chrome/108.0.0.0 Safari/537.36\" \"172.16.100.11\""
}
{
  "timestamp": "2023-01-13T11:40:57.644921904Z",
  "level": "default",
  "namespace": "test",
  "pod": "nginx-sample-785f776647-zlw4c",
  "message": "10.130.2.1 - - [13/Jan/2023:11:40:57 +0000] \"GET / HTTP/1.1\" 304 0 \"-\" \"Mozilla/5.0 (Macintosh; Intel Mac OS X 10_15_7) AppleWebKit/537.36 (KHTML, like Gecko) Chrome/108.0.0.0 Safari/537.36\" \"172.16.100.11\""
}
# リアルタイムでログが表示
所感
とりあえずLogCLIを使用してLokiのログをCLIから出力することができました。
今回はlogging-lokistack-query-frontend-httpのServiceをPortfowardしてquery-frontend経由でログを検索しました。
ただ、もしスクリプトを作成してLokiからログを抽出する、などをしたい場合は、logcliの--proxyオプションや、nodeportのServiceとかもっと良い接続の仕方を調べないといけないような気がします。
今回はCluster Logging 5.5でやりましたが、ドキュメントにはまだあまり情報がなかったので、Cluster Logging 5.6がGAされたら、またやってみようかと思います。