仕事でmatplotlibを使う機会があったので、学習した使い方をまとめておきます。
環境
- windows10
- python 3.7.4
- matplotlib 3.2.1
基本的な使い方
モジュールのimport
import matplotlib.pyplot as plt
グラフの表示
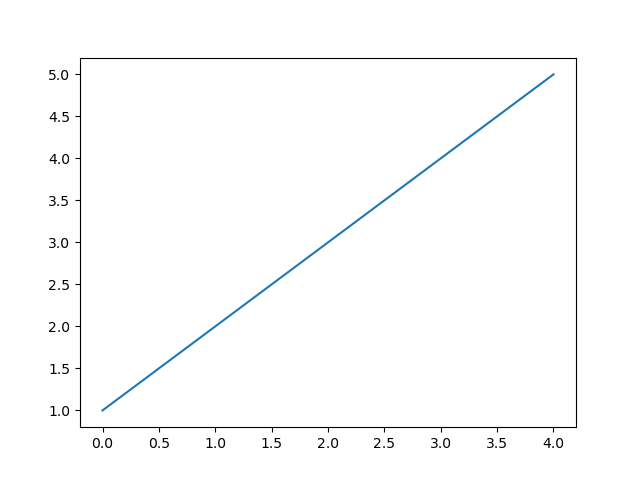
plt.plot([1, 2, 3, 4, 5])
plt.show()
以下のようなグラフが表示される。
引数に渡す情報が1つだけの場合はy軸に引数の座標が来るらしい。
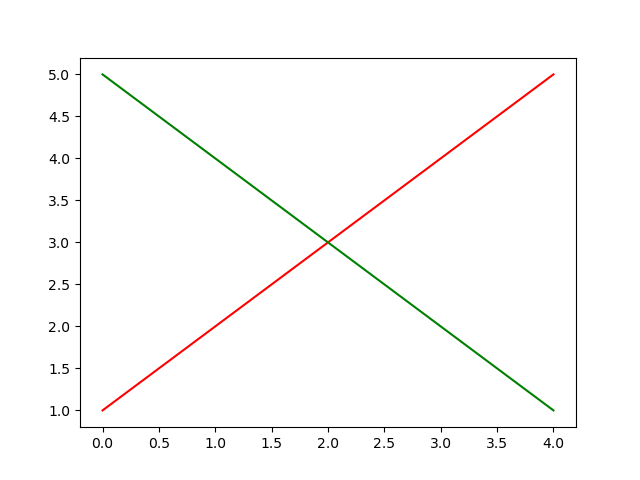
複数の線を描画する場合
line1 = [1, 2, 3, 4, 5]
line2 = [5, 4, 3, 2, 1]
plt.plot(line1, color='red')
plt.plot(line2, color='green')
plt.show()
plt.plot()で1つの線が描ける。
線の色を変更するにはcolorを指定する
アニメーション
線を描画するのにアニメーションをつけることもできる。
アニメーションに必要なモジュールのimport
from matplotlib.animation import ArtistAnimation
# または、
from matplotlib.animation import FuncAnimation
アニメーションの実装には2つのクラスが用意されている。
- ArtistAnimation
- 描画するデータを表示前に計算して順次アニメーションする方式
- FuncAnimation
- 描画するタイミングで計算した値を表示する方式
ArtistAnimation
値が1ずつ右肩上がりになっていくグラフのアニメーション
fig = plt.figure()
artist = []
line = []

for value in range(1, 10):
    line.append(value)
    im = plt.plot(line, color='red', marker='o')
    artist.append(im)

anim = ArtistAnimation(fig, artist, interval=300)
plt.show()
FuncAnimation
実装の内容はArtistAnimationと同じ
FuncAnimationはオブジェクト生成時にrepeatがデフォルトでTrueになっており、初期化用の関数が実装されていないと2週目以降に意図しないアニメーションになるので注意
fig = plt.figure()
line = []

def init():
    global line
    print("初期化処理を実装する")
    plt.gca().cla()
    line = []

def draw(i):
    line.append(i)
    im = plt.plot(line, color='red', marker='o')

anim = FuncAnimation(fig, func=draw, frames=10, init_func=init, interval=100)
plt.show()