Deck.GL
Deck.GLはUberがオープンソース(MITライセンス)で公開しているWebGLベースの地理情報可視化フレームワークです。
Github:https://github.com/uber/deck.gl
Reactでの使用が推奨されていますが、JavaScript(PureJS)でも使用することができます。
Deck.GLでは、多数のレイヤーが準備されており、これらを利用すると国土数値情報などのオープンデータを比較的簡単に可視化することができるので、サンプルを紹介します。
ソースコードはVScodeのLiveServerで実行することを想定しており、また、国土数値情報のShapeはQGISでgeoJsonに変換しています。
なお、実行時には「mapboxApiAccessToken: "**********"」をMapBoxのアクセストークンに置き換えてください。
HexagonLayerによるメッシュデータの可視化
前回投稿したものですが、「国土数値情報 500mメッシュ別将来推計人口」のようなメッシュデータは、HexagonLayerで可視化することができます。

以下にサンプルコードを示します。
<!doctype html>
<html class="no-js" lang="ja">
    <head>
        <meta charset="utf-8">
        <meta http-equiv="x-ua-compatible" content="ie=edge">
        <meta name="viewport" content="width=device-width, initial-scale=1, shrink-to-fit=no">
        <title>Osaka-Population</title>
        <link rel="stylesheet" href="https://cdnjs.cloudflare.com/ajax/libs/mapbox-gl/0.53.1/mapbox-gl.css" />
        <script src="https://code.jquery.com/jquery-3.4.0.js"
        integrity="sha256-DYZMCC8HTC+QDr5QNaIcfR7VSPtcISykd+6eSmBW5qo=" crossorigin="anonymous"></script>
        <script src="https://cdnjs.cloudflare.com/ajax/libs/mapbox-gl/0.53.1/mapbox-gl.js"></script>
        <script src="https://cdn.jsdelivr.net/npm/deck.gl@7.0.0/dist.min.js"></script>
        <script src="https://cdnjs.cloudflare.com/ajax/libs/d3/4.13.0/d3.min.js"></script>
        <style type="text/css">
            html, body {
                padding: 0;
                margin: 0;
                width: 100%;
                height: 100%;
            }
            #panel {
                position: absolute;
                background: #ffffffaa;
                top: 0;
                left: 0;
                margin: 10px;
                padding: 10px;
                font-size: 38px;
                line-height: 1;
                width:150px;
                height:40px;
                z-index: 2;
                text-align: center;
                vertical-align: middle;
            }
        </style>
    </head>
    <body>
        <div id="panel"></div>
        <div id="app" style="width:100%;height:100%;"></div>
        <div id="tooltip"></div>
    </body>
    <script type="text/javascript">
        const colorRange = [
            [1, 152, 189],
            [73, 227, 206],
            [216, 254, 181],
            [254, 237, 177],
            [254, 173, 84],
            [209, 55, 78]
        ];
        const coverage = 0.8;
        const upperPercentile = 100
        const LAT = 34.6;
        const LNG = 135.5;
        const year=["2015","2020","2025","2030","2035","2040","2045","2050"];
        let it=0;
        let options={};
        const deckgl = new deck.DeckGL({
            container: 'app',
            mapboxApiAccessToken: "**********",
            mapStyle: "mapbox://styles/mapbox/dark-v9",
            longitude: LNG,
            latitude: LAT,
            zoom: 10,
            pitch: 40,
            bearing: -10
        });
        const loadData = () => {
            d3.json("osaka_jinko.geojson", (error, response)=>{
                data=[];
                let n=response.features.length;
                for(let i=0;i<n;i++){
                    data.push(getlatlon(response.features[i]));
                }
                const update=() =>{
                    if(it>=year.length){
                        stop();
                    }else{
                        $("#panel").text(year[it]);
                        deckgl.setProps({
                             layers: []
                        });
                        renderLayer(data);
                    }
                    it++;
                };
                let anime=setInterval(update,2000);
                const stop=()=>{
                    clearInterval(anime);
                };
            });
        };
        const renderLayer = (data) => {
            const hexagonLayer = new deck.HexagonLayer({
                id: "heatmap",
                colorRange,
                coverage,
                data,
                getColorValue:getValue,
                getElevationValue:getValue,
                elevationRange: [0, 5000],
                elevationScale: 4,
                extruded: true,
                getPosition: d => d,
                opacity: 1.0,
                pickable: false,
                radius: 500,
                upperPercentile
            });
            deckgl.setProps({
                layers: [hexagonLayer]
            });
        };
        const getlatlon=(feature) =>{
            let geo=feature.geometry.coordinates[0];
            let pro=feature.properties;
            let lat=0,lon=0;
            for(let i=0;i<4;i++){
                lon +=Number(geo[i][0]);
                lat +=Number(geo[i][1]);
            }
            lat /=4;
            lon /=4;
            const val={"2015":pro.PTN_2015,
                       "2020":pro.PTN_2020,
                       "2025":pro.PTN_2025,
                       "2030":pro.PTN_2030,
                       "2035":pro.PTN_2035,
                       "2040":pro.PTN_2040,
                       "2045":pro.PTN_2045,
                       "2050":pro.PTN_2050
                      };
            return [lon,lat,val];
        };
        const getValue=(d) =>{
            return d[0][2][year[it]];
        };
        loadData();
    </script>
</html>
ArcLayerによる経路データの可視化
「国土数値情報 空港間流通量」のような経路データは、AcrLayerで可視化することができます。
また、下記サンプルでは、空港の位置をScatterplotLayerとIconLayerで表示しています。
 以下にサンプルコードを示します。
<!doctype html>
<html class="no-js" lang="ja">
    <head>
        <meta charset="utf-8">
        <meta http-equiv="x-ua-compatible" content="ie=edge">
        <meta name="viewport" content="width=device-width, initial-scale=1, shrink-to-fit=no">
        <title>Airport</title>
        <link rel="stylesheet" href="https://cdnjs.cloudflare.com/ajax/libs/mapbox-gl/0.53.1/mapbox-gl.css" />
        <script src="https://code.jquery.com/jquery-3.4.0.js"
        integrity="sha256-DYZMCC8HTC+QDr5QNaIcfR7VSPtcISykd+6eSmBW5qo=" crossorigin="anonymous"></script>
        <script src="https://cdnjs.cloudflare.com/ajax/libs/mapbox-gl/0.53.1/mapbox-gl.js"></script>
        <script src="https://cdn.jsdelivr.net/npm/deck.gl@7.0.0/dist.min.js"></script>
        <script src="https://cdnjs.cloudflare.com/ajax/libs/d3/4.13.0/d3.min.js"></script>
        <script src="https://cdnjs.cloudflare.com/ajax/libs/d3-scale/1.0.7/d3-scale.js"></script>
        <style type="text/css">
            html, body {
                padding: 0;
                margin: 0;
                width: 100%;
                height: 100%;
            }
            #panel {
                position: absolute;
                background: #ffffff00;
                top: 0;
                left: 0;
                margin: 4px;
                padding: 4px;
                line-height: 1;
                width:260px;
                height:26px;
                z-index: 2;
                text-align: center;
                vertical-align: middle;
            }
            #tooltip {
                font-family: Helvetica, Arial, sans-serif;
                font-size: 12px;
                position: absolute;
                padding: 4px;
                margin: 8px;
                background: rgba(0, 0, 0, 0.8);
                color: #fff;
                max-width: 300px;
                z-index: 9;
                pointer-events: none;
            }
        </style>
    </head>
    <body>
        <div id="panel"><select id="airport" name="airport"></select></div>
        <div id="app" style="width:100%;height:100%;"></div>
        <div id="tooltip"></div>
    </body>
    <script type="text/javascript">
        const LAT = 35.5;
        const LNG = 138.0;
        let min=1e10;
        let max=-1e10;
        let airport={};
        let data=[];
        let icon=[];
        const ICON_MAPPING = {
            arker: {x: 0, y: 0, width: 32, height: 32, mask: true}
        };
        const DEFAULT_COLOR = [29, 145, 192];
        const COLOR_SCALE = d3.scaleLinear()
            .domain([0, 0.1, 0.2, 0.3, 0.4, 0.5, 0.6, 0.7, 0.8, 0.9, 1.0])
            .range([
                [199, 233, 180],
                [237, 248, 177],
                [255, 255, 204],
                [255, 237, 160],
                [254, 217, 118],
                [254, 178, 76],
                [253, 141, 60],
                [252, 78, 42],
                [227, 26, 28],
                [189, 0, 38],
                [128, 0, 38]
            ]);

        const deckgl = new deck.DeckGL({
            container: 'app',
            mapboxApiAccessToken: "**************",
            mapStyle: "mapbox://styles/mapbox/dark-v9",
            longitude: LNG,
            latitude: LAT,
            zoom: 5,
            pitch: 40,
            bearing: -10,
            onViewStateChange: ({viewState}) => {
                return viewState;
            }
        });
        const loadData = () => {
            d3.json("airport.geojson", (error, response)=>{
                let n=response.features.length;
                let name=[];
                for(let i=0;i<n;i++){
                    if(!airport[response.features[i].properties.S10b_001]){
                        airport[response.features[i].properties.S10b_001]=[];
                        name.push(response.features[i].properties.S10b_001);
                        icon.push(getAirport(response.features[i]));
                    }
                    airport[response.features[i].properties.S10b_001].push(getlatlon(response.features[i]));
                    let p=response.features[i].properties.S10b_007;
                    if(p<=0)p=1;
                    p=Math.log10(p);
                    max=Math.max(p,max);
                    min=Math.min(p,min);
                }
                for(let i=0;i<name.length;i++){
                    let op=$("<option />");
                    op.attr("value",name[i]);
                    op.text(name[i]);
                    $("#airport").append(op);
                }
                $("#airport").change((evt)=>{
                    updateAirport(evt.target.value);
                });
                data=airport["東京"];
                renderLayer(data);
            });
        };
        const updateAirport =(str) =>{
            deckgl.setProps({layers: []});
            data=airport[str];
            renderLayer(data);
        };
        const renderLayer = (data) => {
            const arcLayer = new deck.ArcLayer({
                id: 'arc',
                data,
                getSourcePosition: d => d.sor,
                getTargetPosition: d => d.tar,
                getSourceColor: d => COLOR_SCALE(d.val),
                getTargetColor: d => COLOR_SCALE(d.val),
                getWidth: 1.0
            });
            const plotLayer= new deck.ScatterplotLayer({
                id: 'plot',
                data: icon,
                pickable: true,
                getPosition: d => d.coordinates,
                getColor: d => d.color,
                getRadius: d => d.radius,
                radiusMinPixels: 2,
                radiusMaxPixels: 60,
                radiusScale: 5,
                opacity: 0.2,
                onHover: (e) => console.log(e),
                onClick: (e) => console.log(e)
            });
            const iconLayer=new deck.IconLayer({
                id: 'icon',
                data: icon,
                getIcon: d => ({
                    url: "https://upload.wikimedia.org/wikipedia/commons/e/ed/Map_pin_icon.svg",
                    width: 94,
                    height: 128,
                    anchorY: 128
                }),
                getSize: 8,
                pickable: true,
                sizeScale: 5,
                getPosition: d => d.coordinates,
                onHover: updateTooltip,
                onClick:({object, x, y}) => {
                    $("#airport").val(object.name).change();
                }
            });
            deckgl.setProps({
                layers: [arcLayer,plotLayer,iconLayer]
            });
        };
        const getlatlon=(feature) =>{
            let geo=feature.geometry.coordinates;
            let pro=feature.properties;
            let ret={};
            ret["sor"]=[geo[0][0],geo[0][1]];
            ret["tar"]=[geo[1][0],geo[1][1]];
            let p=pro.S10b_007;
            if(p<=0)p=1;
            p=Math.log10(p);
            ret["val"]=(p-min)/(max-min);
            ret["st"]=pro.S10b_001;
            ret["ed"]=pro.S10b_004;
            return ret;
        };
        const getAirport=(feature) =>{
            let geo=feature.geometry.coordinates;
            let pro=feature.properties;
            let ret={};
            ret["coordinates"]=[geo[0][0],geo[0][1]];
            ret["color"]=[255, 0, 0];
            ret["radius"]=1000;
            ret["name"]=pro.S10b_001;
            return ret;
        };
        const updateTooltip=({x, y, object}) => {
            const tooltip = document.getElementById("tooltip");
            if (object) {
                tooltip.style.visibility="visible";
                tooltip.style.top = y+"px";
                tooltip.style.left = x+"px";
                tooltip.innerHTML = object.name;
            } else {
                tooltip.style.visibility="hidden";
                tooltip.innerHTML = "";
            }
        };
        loadData();
    </script>
</html>
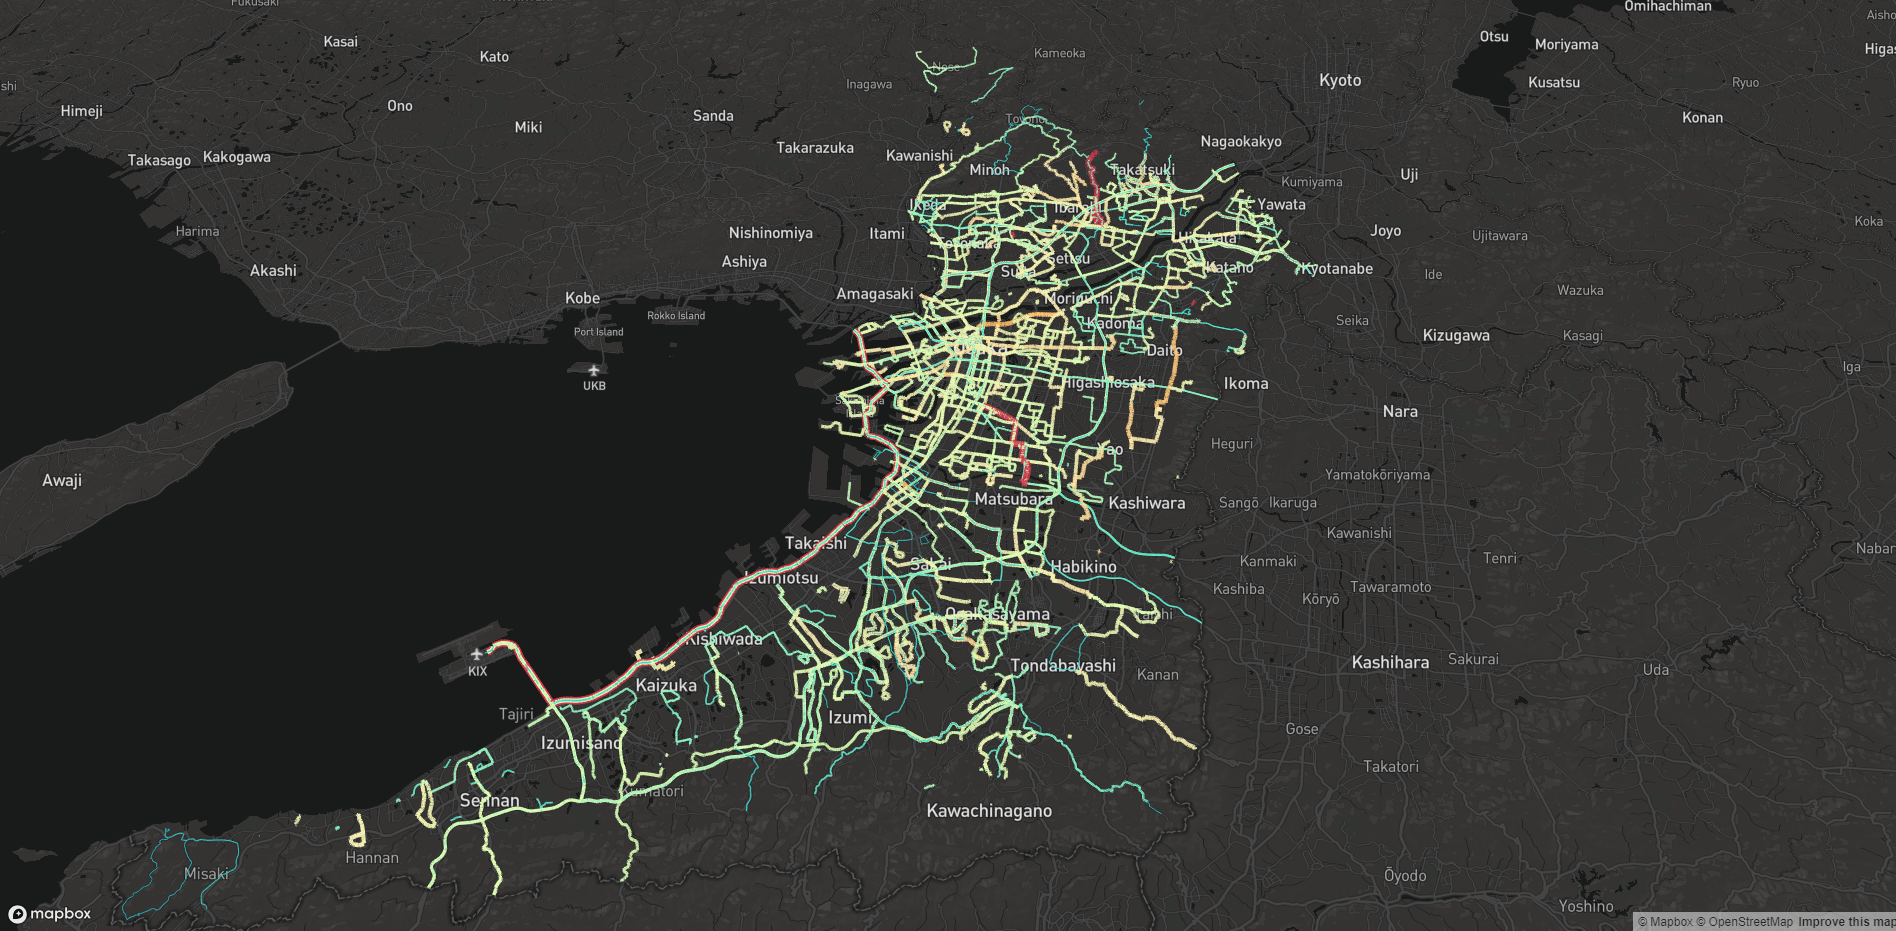
LineLayerによる線データの可視化
「国土数値情報 バスルート」のような経路データは、LineLayerで可視化することができます。
 以下にサンプルコードを示します。
<!doctype html>
<html class="no-js" lang="ja">
    <head>
        <meta charset="utf-8">
        <meta http-equiv="x-ua-compatible" content="ie=edge">
        <meta name="viewport" content="width=device-width, initial-scale=1, shrink-to-fit=no">
        <title>Traffic-Bus</title>
        <link rel="stylesheet" href="https://cdnjs.cloudflare.com/ajax/libs/mapbox-gl/0.53.1/mapbox-gl.css" />
        <script src="https://code.jquery.com/jquery-3.4.0.js"
        integrity="sha256-DYZMCC8HTC+QDr5QNaIcfR7VSPtcISykd+6eSmBW5qo=" crossorigin="anonymous"></script>
        <script src="https://cdnjs.cloudflare.com/ajax/libs/mapbox-gl/0.53.1/mapbox-gl.js"></script>
        <script src="https://cdn.jsdelivr.net/npm/deck.gl@7.0.0/dist.min.js"></script>
        <script src="https://cdnjs.cloudflare.com/ajax/libs/d3/4.13.0/d3.min.js"></script>
        <script src="https://cdnjs.cloudflare.com/ajax/libs/d3-scale/1.0.7/d3-scale.js"></script>
        <style type="text/css">
            html, body {
                padding: 0;
                margin: 0;
                width: 100%;
                height: 100%;
            }
            #panel {
                position: absolute;
                background: #ffffff00;
                top: 0;
                left: 0;
                margin: 4px;
                padding: 4px;
                line-height: 1;
                width:260px;
                height:26px;
                z-index: 2;
                text-align: center;
                vertical-align: middle;
            }
            #tooltip {
                font-family: Helvetica, Arial, sans-serif;
                font-size: 12px;
                position: absolute;
                padding: 4px;
                margin: 8px;
                background: rgba(0, 0, 0, 0.8);
                color: #fff;
                max-width: 300px;
                z-index: 9;
                pointer-events: none;
            }
        </style>
    </head>
    <body>
        <div id="app" style="width:100%;height:100%;"></div>
        <div id="tooltip"></div>
    </body>
    <script type="text/javascript">
        const LAT = 34.6;
        const LNG = 135.5;
        let min=1e10;
        let max=-1e10;
        let data=[];
        const ICON_MAPPING = {
            arker: {x: 0, y: 0, width: 32, height: 32, mask: true}
        };
        const DEFAULT_COLOR = [29, 145, 192];
        const COLOR_SCALE = d3.scaleLinear()
            .domain([0,0.2,0.4,0.6,0.8,1.0])
            .range([
                [1, 152, 189],
                [73, 227, 206],
                [216, 254, 181],
                [254, 237, 177],
                [254, 173, 84],
                [209, 55, 78]
            ]);

        const deckgl = new deck.DeckGL({
            container: 'app',
            mapboxApiAccessToken: "*******************",
            mapStyle: "mapbox://styles/mapbox/dark-v9",
            longitude: LNG,
            latitude: LAT,
            zoom: 10,
            pitch: 40,
            bearing: -10,
            onViewStateChange: ({viewState}) => {
                return viewState;
            }
        });
        const loadData = () => {
            d3.json("bus.geojson", (error, response)=>{
                let n=response.features.length;
                for(let i=0;i<n;i++){
                    setData(response.features[i]);
                }
                renderLayer(data);
            });
        };
        const renderLayer = (data) => {
            console.log(data.length);
            const lineLayer = new deck.LineLayer({
                id: 'bus',
                data,
                fp64: false,
                getSourcePosition: d => d.start,
                getTargetPosition: d => d.end,
                getColor: d => COLOR_SCALE(nomarize(d.rate)),
                getWidth: d => nomarize(d.rate)*10,
                pickable: true,
                onHover: updateTooltip
            });
            deckgl.setProps({
                layers: [lineLayer]
            });
        };
        const setData=(feature) =>{
            let geo=feature.geometry.coordinates[0];
            let pro=feature.properties;
            let v=pro.N07_004>1? Math.log10(pro.N07_004*10):1;
            max=Math.max(max,v);
            min=Math.min(min,v);
            for(let i=1;i<geo.length;i++){
                let dd={};
                dd["company"]=pro.N07_002;
                dd["line"]=pro.N07_003;
                dd["start"]=geo[i-1];
                dd["end"]=geo[i];
                dd["rate"]=v;
                data.push(dd);
            }
        };
        const nomarize =(val) =>{
            return (val-min)/(max-min);
        };
        const updateTooltip=({x, y, object}) => {
            const tooltip = document.getElementById("tooltip");
            if (object) {
                tooltip.style.visibility="visible";
                tooltip.style.top = y+"px";
                tooltip.style.left = x+"px";
                tooltip.innerHTML = "<p>"+object["company"]+"<br />"+object["line"]+"</p>";
            } else {
                tooltip.style.visibility="hidden";
                tooltip.innerHTML = "";
            }
        };
        loadData();
    </script>
</html>
GeojsonLayerによる地理情報の可視化
Geojsonlayerを使用するとGeojsonをポリゴンで表示することができ、ElevationとFillColorを調整すると、以下のように可視化することができます。
この可視化では「国土数値情報 行政区域データ」で行政区域を描画し、環境省の「部門別CO2排出量の現況推計」から算出した区市町村の単位面積当たりCO2排出量でポリゴンの高さと色を調整しています。

<!doctype html>
<html class="no-js" lang="ja">
    <head>
        <meta charset="utf-8">
        <meta http-equiv="x-ua-compatible" content="ie=edge">
        <meta name="viewport" content="width=device-width, initial-scale=1, shrink-to-fit=no">
        <title>CO2Emission</title>
        <link rel="stylesheet" href="https://cdnjs.cloudflare.com/ajax/libs/mapbox-gl/0.53.1/mapbox-gl.css" />
        <script src="https://code.jquery.com/jquery-3.4.0.js"
        integrity="sha256-DYZMCC8HTC+QDr5QNaIcfR7VSPtcISykd+6eSmBW5qo=" crossorigin="anonymous"></script>
        <script src="https://cdnjs.cloudflare.com/ajax/libs/mapbox-gl/0.53.1/mapbox-gl.js"></script>
        <script src="https://cdn.jsdelivr.net/npm/deck.gl@7.0.0/dist.min.js"></script>
        <script src="https://cdnjs.cloudflare.com/ajax/libs/d3/4.13.0/d3.min.js"></script>
        <script src="https://cdnjs.cloudflare.com/ajax/libs/d3-scale/1.0.7/d3-scale.js"></script>
        <style type="text/css">
            html, body {
                padding: 0;
                margin: 0;
                width: 100%;
                height: 100%;
            }
            #panel {
                position: absolute;
                background: #ffffff00;
                top: 0;
                left: 0;
                margin: 4px;
                padding: 4px;
                line-height: 1;
                width:260px;
                height:26px;
                z-index: 2;
                text-align: center;
                vertical-align: middle;
            }
            #tooltip {
                font-family: Helvetica, Arial, sans-serif;
                font-size: 12px;
                position: absolute;
                padding: 4px;
                margin: 8px;
                background: rgba(0, 0, 0, 0.8);
                color: #fff;
                max-width: 300px;
                z-index: 9;
                pointer-events: none;
            }
        </style>
    </head>
    <body>
        <div id="app" style="width:100%;height:100%;"></div>
        <div id="tooltip"></div>
    </body>
    <script type="text/javascript">
        const colorRange = [
            [1, 152, 189],
            [73, 227, 206],
            [216, 254, 181],
            [254, 237, 177],
            [254, 173, 84],
            [209, 55, 78]
        ];
        const coverage = 0.8;
        const upperPercentile = 100
        const LAT = 35.5;
        const LNG = 138.0;
        let value={};
        let it=0;
        let min=10e10;
        let max=-10e10;
        let csv={};
        const COLOR_SCALE = d3.scaleLinear()
            .domain([0, 0.05, 0.1, 0.15, 0.2, 0.3, 0.4, 0.5, 0.6, 0.7, 0.8, 0.9, 1.0])
            .range([
                [65, 182, 196],
                [127, 205, 187],
                [199, 233, 180],
                [237, 248, 177],
                [255, 255, 204],
                [255, 237, 160],
                [254, 217, 118],
                [254, 178, 76],
                [253, 141, 60],
                [252, 78, 42],
                [227, 26, 28],
                [189, 0, 38],
                [128, 0, 38]
        ]);
        const deckgl = new deck.DeckGL({
            container: 'app',
            mapboxApiAccessToken: "********************",
            mapStyle: "mapbox://styles/mapbox/dark-v9",
            longitude: LNG,
            latitude: LAT,
            zoom: 5,
            pitch: 40,
            bearing: -10
        });
        const loadData = () => {
            d3.csv("CO2.csv", (error, data) => {
                for(let i=0;i<data.length;i++){
                    let code=data[i]["市区町村コード"];
                    if(code.length<=4)code="0"+code;
                    let val=data[i]["排出密度"];
                    value[code]=val;
                    max=Math.max(max,val);
                    min=Math.min(min,val);
                    csv[code]=data[i];
                }
            });
            d3.json("Japan2018.geojson", (error, response)=>{
                const data=response;
                renderLayer(data);
            });
        };
        const renderLayer = (data) => {
            const geoJsonLayer = new deck.GeoJsonLayer({
                id: 'geojson',
                data,
                opacity: 0.6,
                stroked: false,
                filled: true,
                extruded: true,
                wireframe: false,
                fp64: true,
                getElevation: f => nomarize(value[f.properties.N03_007])*1000000,
                getFillColor: f => COLOR_SCALE(nomarize(value[f.properties.N03_007])),
                getLineColor: [255, 255, 255],
                pickable: true,
                onHover: updateTooltip
            });
            deckgl.setProps({
                layers: [geoJsonLayer]
            });
        };
        const updateTooltip=({x, y, object}) => {
            const tooltip = document.getElementById("tooltip");
            if (object) {
                if(!object.properties){
                    tooltip.innerHTML = "";
                    return;
                }
                const dd=csv[object.properties.N03_007];
                tooltip.style.top = y+"px";
                tooltip.style.left = x+"px";
                if(dd["排出量"]&&dd["排出密度"]){
                    tooltip.style.visibility="visible";
                    let name=object.properties.N03_004;
                    if(object.properties.N03_003)name=object.properties.N03_003+name;
                    tooltip.innerHTML = "<h3>"+name+"</h3><p>排出量:"+Number(dd["排出量"]).toFixed(0)
                    +" kt-CO2<br />排出密度:"+Number(dd["排出密度"]).toFixed(1)+" kt-CO2/km2</p>";
                }else{
                    tooltip.style.visibility="hidden";
                    tooltip.innerHTML = "";
                }
            } else {
                tooltip.style.visibility="hidden";
                tooltip.innerHTML = "";
            }
        };
        const nomarize =(val) =>{
            return (val-min)/(max-min);
        };
        loadData();
    </script>
</html>
最後に
Deck.GLでは、この他にも様々なレイヤーが定義されています。deck.gl/docs/layers/
TextLayerで日本語が表示できないなどはありますが、これらレイヤーを利用すれば、比較的簡単にオープンデータを可視化することができるので、ぜひ、試してみて下さい。