概要
最近、仕事の絡みで長野県林業総合センターで考案された、微地形が強調された地図「CS立体図」の存在を知りました。
CS立体図は傾斜量図(Slope)と曲率図(Curvature)を合成して作成される図で、凹凸など、地形判読を容易にする立体図法です。
QGIsプラグインなど、既に様々なツールが提供されていますが、勉強を兼ねて、地理院タイルからCS立体図タイルを作成してみました。
作成方法
CS立体図作成に必要な傾斜量図は地理院タイルで提供されているので、DEMタイルから曲率図を作成すれば、CS立体図を作成できると考えました。
このため、作成手順は以下のとおりとしています。
1.地理院タイルより、傾斜量図タイルを取得。
2.地理院タイルより、DEMタイルを取得
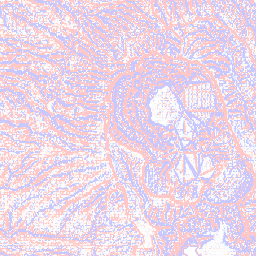
3.DEMより曲率を計算し、曲率図タイルを作成
4.傾斜量図タイルと曲率図タイルのピクセルを乗算し、CS立体図タイル生成
ソースコード
ソースコードはGithubにアップしています。-> https://github.com/termat/CSMapTile
詳細はそちらをご覧ください。
なお、CS立体図タイルの生成はTileDBクラスで行っており、主な処理内容は以下のとおりです。
1.CS立体図タイル生成
	private static String slope="https://cyberjapandata.gsi.go.jp/xyz/slopemap";
	private static String dem14="https://cyberjapandata.gsi.go.jp/xyz/dem_png";
	private static String dem15a="https://cyberjapandata.gsi.go.jp/xyz/dem5a_png";
	private static String dem15b="https://cyberjapandata.gsi.go.jp/xyz/dem5b_png";
	private static final int P8=(int)Math.pow(2,8);
	private static final int P16=(int)Math.pow(2,16);
	private static final int P23=(int)Math.pow(2,23);
	private static final int P24=(int)Math.pow(2,24);
	private static final double U=0.01;
	private static double GEO_R=6378137;
	private static int[] col=new int[]{255,232,197};

	/*
	 * CSタイル画像取得
	 */
	public BufferedImage getCSImage(int zoom,int tileX,int tileY)throws IOException{
		String param="/"+zoom+"/"+tileX+"/"+tileY;
		BufferedImage s_img=ImageIO.read(new URL(slope+param+".png"));
		s_img=getColorTransSlope(s_img);
		BufferedImage d_img=createDemTile(zoom,tileX,tileY);
		BufferedImage c_img=getCurve(d_img,zoom);
		BufferedImage img=mul(c_img,s_img);
		return img;
	}

	/*
	 * 傾斜量図をオレンジ系色に変換
	 */
	private static BufferedImage getColorTransSlope(BufferedImage img){
		int w=img.getWidth();
		int h=img.getHeight();
		BufferedImage ret=new BufferedImage(w,h,img.getType());
		for(int i=0;i<w;i++){
			for(int j=0;j<h;j++){
				float cv=(float)(img.getRGB(i, j)&0x0000ff)/255f;
				ret.setRGB(i, j, new Color((int)(col[0]*cv),(int)(col[1]*cv),(int)(col[2]*cv)).getRGB());
			}
		}
		return ret;
	}

	/*
	 * 258×258サイズのDemタイルを生成
	 */
	private static BufferedImage createDemTile(int zoom,int tileX,int tileY)throws IOException{
		BufferedImage bc=getDemImage(zoom,tileX,tileY);
		BufferedImage ret=new BufferedImage(bc.getWidth()+2,bc.getHeight()+2,bc.getType());
		Graphics2D g=ret.createGraphics();
		g.drawImage(bc, 1, 1, comp);
		try{
			BufferedImage bu=getDemImage(zoom,tileX,tileY-1);
			g.drawImage(bu, 1, -255, comp);
		}catch(IOException e){}
		try{
			BufferedImage bd=getDemImage(zoom,tileX,tileY+1);
			g.drawImage(bd, 1, 257, comp);
		}catch(IOException e){}
		try{
			BufferedImage bl=getDemImage(zoom,tileX-1,tileY);
			g.drawImage(bl, -255, 1, comp);
		}catch(IOException e){}

		try{
			BufferedImage br=getDemImage(zoom,tileX+1,tileY);
			g.drawImage(br, 257, 1, comp);
		}catch(IOException e){}
		g.dispose();
		return ret;
	}

	/*
	 * 地理院からDemタイルを取得
	 */
	private static BufferedImage getDemImage(int zoom,int tileX,int tileY)throws IOException{
		String param="/"+zoom+"/"+tileX+"/"+tileY;
		BufferedImage d_img=null;
		if(zoom<=14){
			d_img=ImageIO.read(new URL(dem14+param+".png"));
		}else{
			try{
				d_img=ImageIO.read(new URL(dem15a+param+".png"));
			}catch(IOException e){
				d_img=ImageIO.read(new URL(dem15b+param+".png"));
			}
		}
		return d_img;
	}

	/*
	 * 画素乗算
	 */
	private static BufferedImage mul(BufferedImage im1,BufferedImage im2){
		int w=im1.getWidth();
		int h=im1.getHeight();
		BufferedImage ret=new BufferedImage(w,h,BufferedImage.TYPE_INT_RGB);
		for(int i=0;i<w;i++){
			for(int j=0;j<h;j++){
				int rgb1=im1.getRGB(i, j);
				int rgb2=im2.getRGB(i, j);
				ret.setRGB(i, j, mulRGB(rgb1,rgb2));
			}
		}
		return ret;
	}

	/*
	 * RGB乗算
	 */
	private static int mulRGB(int rgb1,int rgb2){
		float r1=(float)(rgb1 >> 16 & 0xff)/255f;
		float g1=(float)(rgb1&0x00ff00 >> 8 & 0xff)/255f;
		float b1=(float)(rgb1&0x0000ff & 0xff)/255f;
		float r2=(float)(rgb2 >> 16 & 0xff)/255f;
		float g2=(float)(rgb2&0x00ff00 >> 8 & 0xff)/255f;
		float b2=(float)(rgb2&0x0000ff & 0xff)/255f;
		return new Color(r1*r2,g1*g2,b1*b2).getRGB();
	}

	/*
	 * 曲率画像取得
	 */
	public static BufferedImage getCurve(BufferedImage dem,int zoom){
		BufferedImage ret=new BufferedImage(dem.getWidth(),dem.getHeight(),BufferedImage.TYPE_INT_RGB);
		double[][] dd=new double[dem.getWidth()][dem.getHeight()];
		for(int i=0;i<dd.length;i++){
			for(int j=0;j<dd[i].length;j++){
				dd[i][j]=getZ(dem.getRGB(i, j));
			}
		}
		double ll=getL(zoom);
		for(int i=1;i<dd.length-1;i++){
			for(int j=1;j<dd[i].length-1;j++){
				double[][] p=new double[][]{
						{dd[i-1][j-1],dd[i-1][j],dd[i-1][j+1]},
						{dd[i][j-1],dd[i][j],dd[i][j+1]},
						{dd[i+1][j-1],dd[i+1][j],dd[i+1][j+1]}};
				double cu=getCurveVal(p,ll);
				Color col=grad1.getColor(range.getNormalValue(cu));
				ret.setRGB(i, j, col.getRGB());
			}
		}
		return ret.getSubimage(1, 1, 256, 256);
	}

	/*
	 * 標高取得
	 */
	private static double getZ(int intColor){
		Color c=new Color(intColor);
		int r=c.getRed();
		int g=c.getGreen();
		int b=c.getBlue();
		int x=r*P16+g*P8+b;
		if(x<P23){
			return U*(double)x;
		}else if(x>P23){
			return 0;
		}else{
			return U*(double)(x-P24);
		}
	}

	/*
	 * ズームレベルの1pixel長さ(m)
	 */
	private static double getL(int zoom){
		return 2*GEO_R*Math.PI/256/Math.pow(2, zoom);
	}

	/*
	 * 曲率計算
	 */
	private static double getCurveVal(double[][] p,double ll){
		double ex1=p[1][0]+p[1][2]-2*p[1][1];
		double ex2=p[0][1]+p[2][1]-2*p[1][1];
		return (ex1+ex2)/(ll*ll)*100;
	}
■国土地理院 傾斜量タイル
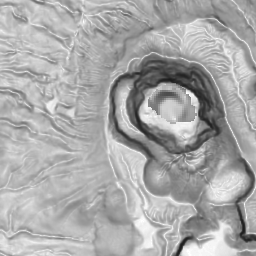
■国土地理院 DEMタイル
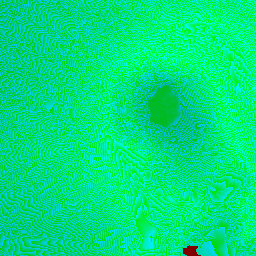
■DEMタイルから計算した曲率図タイル
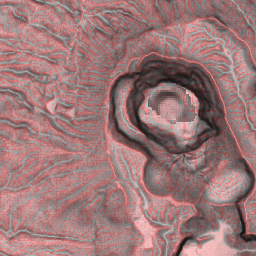
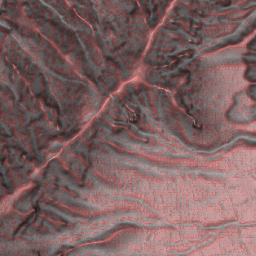
■生成したCS立体図タイル
2.地すべり地形タイル生成
せっかくなので、国立研究開発法人 防災科学技術研究所が公開している地すべり地形分布図WMSサービスから地すべり地形情報を取得してタイル化し、CM立体図タイルと重ね合わせることにしました。
地すべり地形情報の取得とタイル化はJShisWMSクラスで処理しています。
import java.awt.image.BufferedImage;
import java.net.URL;

import javax.imageio.ImageIO;

public class JShisWMS {
	private static final String baseURL="http://www.j-shis.bosai.go.jp/map/wms/landslide?SERVICE=WMS&VERSION=1.3.0&REQUEST=GetMap&";
	private static final double L=(180.0/Math.PI)*Math.asin(Math.tanh(Math.PI));

/*
 * http://www.j-shis.bosai.go.jp/wms-landslide
 *
 * 4301 Tokyo
 * 4326 WGS84
 * 4612 JGS2000
 *
 * 輪郭構造(滑落崖と側方崖)	L-V3-S100
 * 輪郭構造(移動体の輪郭・境界)(移動体アーク)	L-V3-S200
 * 輪郭構造(移動体の輪郭・境界)(移動体ポリゴン)	L-V3-S300
 * 内部構造	L-V3-S400
 * 移動方向等移動体の主移動方向	L-V3-S500
 * 移動体の重心	L-V3-CENTER
 * 上記全ての地すべり地形	L-V3-ALL
 *
 */

	public static BufferedImage getJShis(int zoom,int tileX,int tileY){
		try{
			String url=getURL(zoom,tileX,tileY);
			BufferedImage img=ImageIO.read(new URL(url));
			return img;
		}catch(Exception e){
			e.printStackTrace();
			return null;
		}
	}

	private static String getURL(int zoom,int tileX,int tileY){
		String ret=baseURL+getBBOX(zoom,tileX,tileY)+"&CRS=EPSG:4612"+"&WIDTH=256&HEIGHT=256&LAYERS=L-V3-ALL&FORMAT=image/png&TRANSPARENT=TRUE";
		return ret;
	}

	public static String getBBOX(int zoom,int tileX,int tileY){
		String ret="BBOX=";
		float[][] b=getTileBounds(zoom,tileX,tileY);
		ret=ret+Float.toString(b[1][2])+","+Float.toString(b[0][1])+","+Float.toString(b[0][2])+","+Float.toString(b[1][1]);
		return ret;
	}

	private static float[][] getTileBounds(int zoom,long tileX,long tileY){
		float[] ll1=pixelToLonLatCoord(zoom,tileX*256,tileY*256);
		float[] ll2=pixelToLonLatCoord(zoom,tileX*256+255,tileY*256+255);
		return new float[][]{ll1,ll2};
	}

	private static float[] pixelToLonLatCoord(int zoom,long x,long y){
		double lon=180.0*(x/Math.pow(2, zoom+7)-1);
		double tmp0=((-Math.PI/Math.pow(2, zoom+7))*y);
		double tmp1=atanh(Math.sin(L*Math.PI/180.0));
		double lat=(180.0/Math.PI)*Math.asin(Math.tanh(tmp0+tmp1));
		return new float[]{(float)zoom,(float)lon,(float)lat};
	}

	private static double atanh(double v){
		return 0.5*Math.log((1.0+v)/(1.0-v));
	}
}
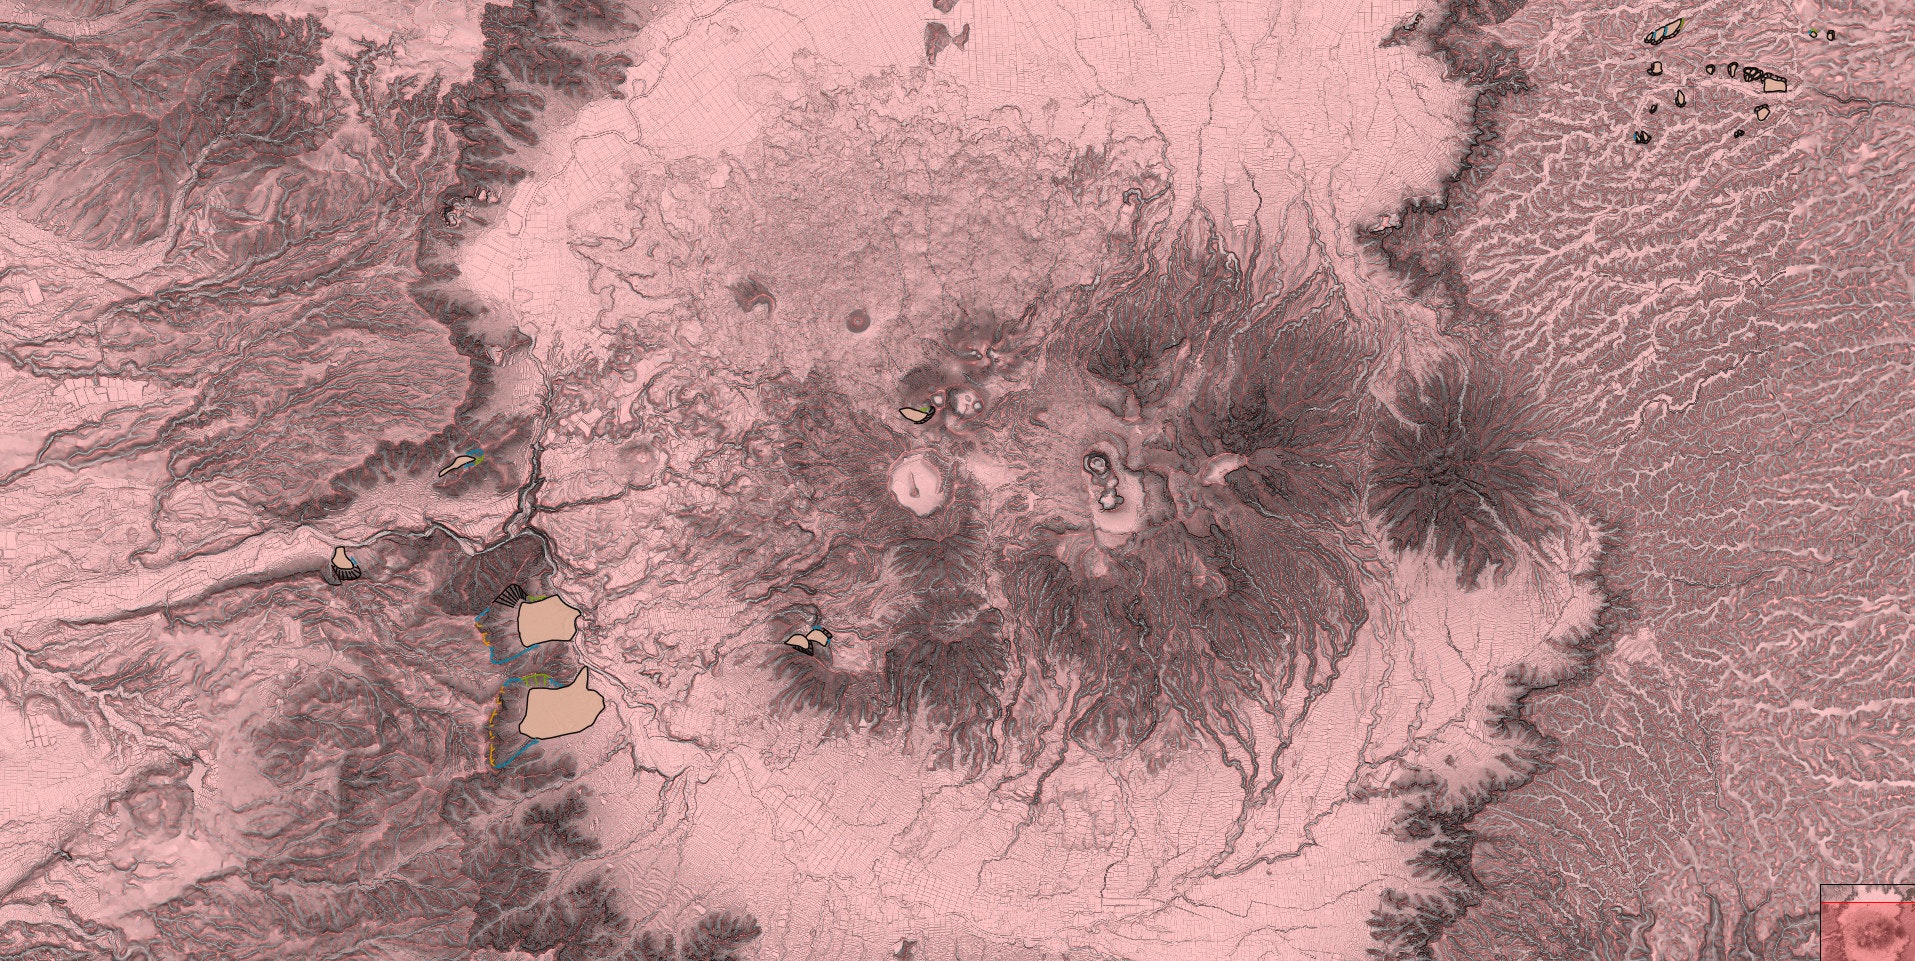
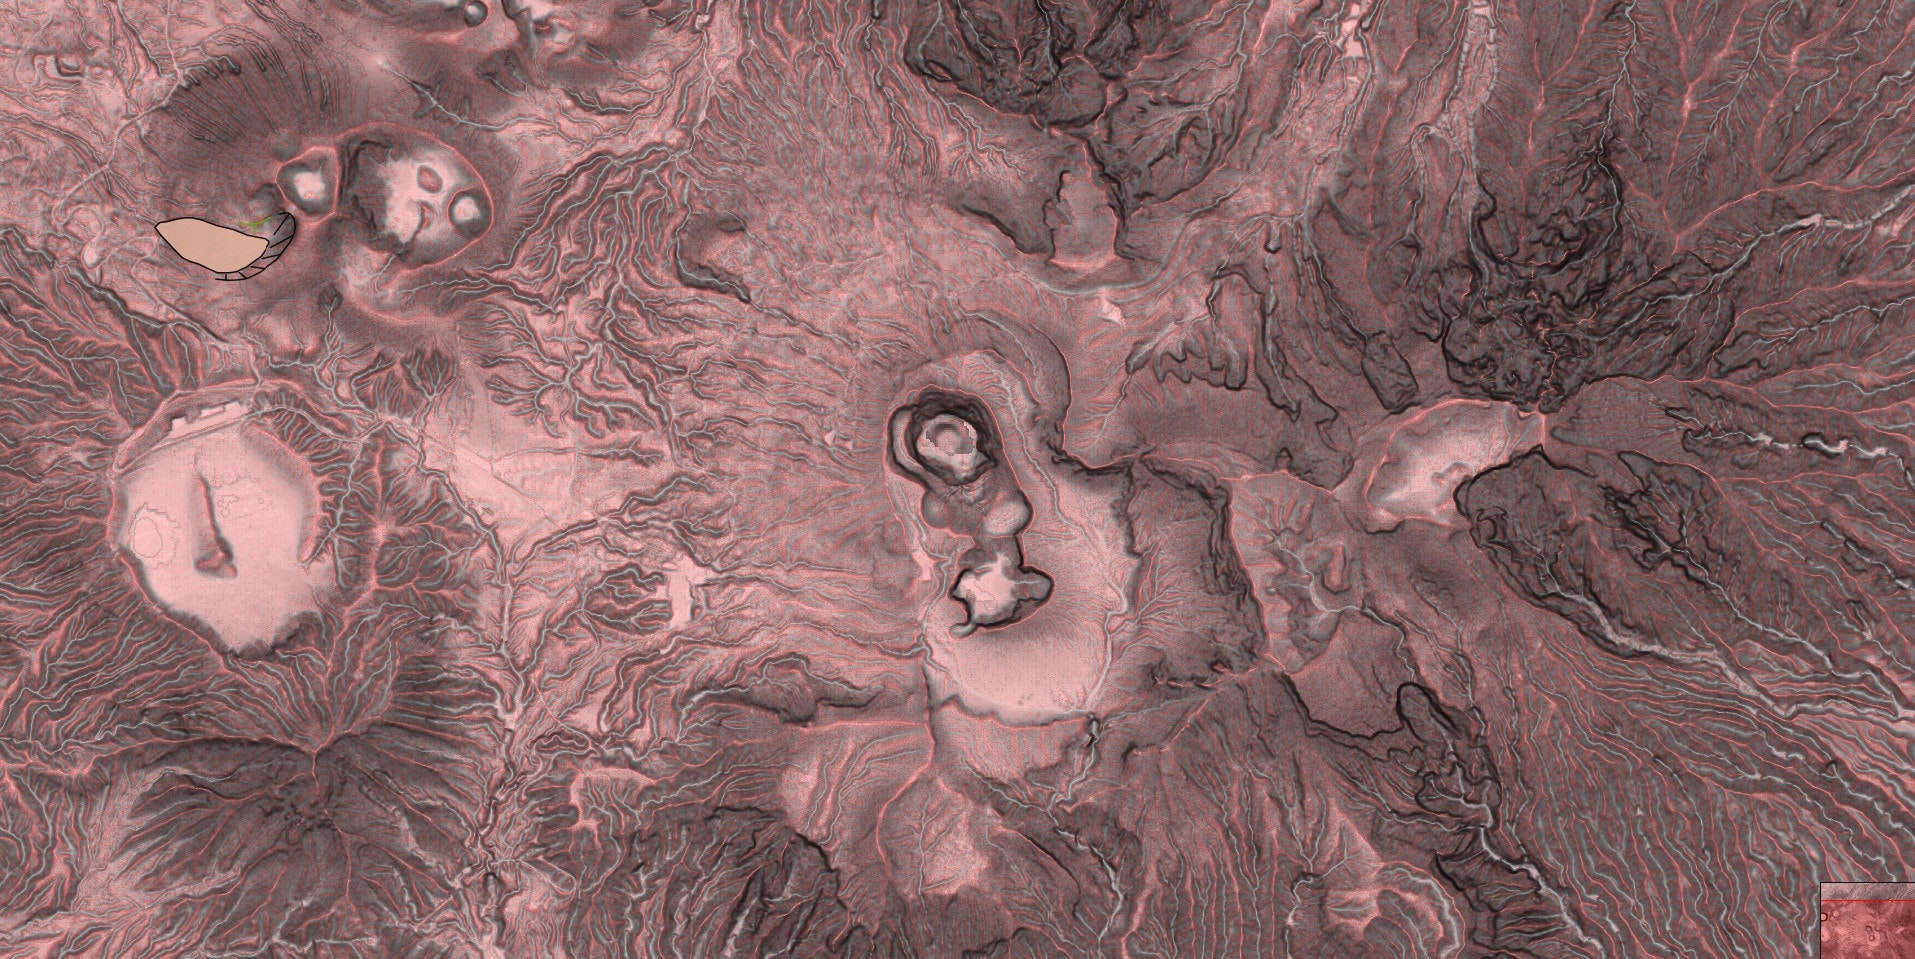
■CS立体図タイル
■JSHIS地すべり地形タイル
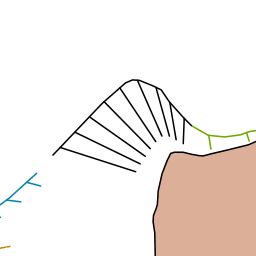
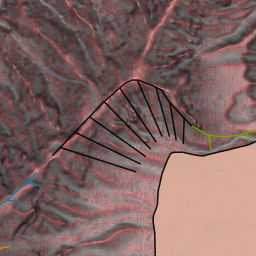
■CS地すべり地形タイル
3.その他
今回はローカル利用が目的なので、Githubにのせたコードでは、生成タイルをSqliteに格納するようにしています。
また、生成タイル確認用にjxmapviewerを利用したタイルブラウザのコードを含めています。
参考資料
CS立体図タイルの作成に当たっては、以下の資料を参考にしました。
最後に
CS立体図の作成方法について調べている時に@wayama_ryousuke氏のエントリ「pix2pixおかわり!CS立体図から地すべり地形分布図を作成してみた」を知りました。すごくおもしろそうなので、解像度的に無理があるかもですが、今回生成したCS立体図タイルと地すべり地形タイルでpix2pixを試してみたいです。