東京公共交通オープンデータチャレンジ
東京公共交通オープンデータチャレンジでは、首都圏の主要な公共交通機関データがオープンデータとして公開されており、「第3回東京公共交通オープンデータチャレンジ」にエントリーすれば、アクセストークンが発行されAPIを使用することができます。
GW中にサイトを知り、とりあえずエントリーしてみました。
概要
地方在住のため、首都圏の鉄道網をあまり知りません。
このため、情報整理と東京オープンデータチャレンジのAPI、D3.jsの勉強を兼ねて首都圏鉄道網のForce-Graphを作ってみました。
内容・手順
1.ODPT Train APIでデータ整理
「ODPT Train API」で路線と駅の情報を収集し、javaでデータを整理しました。
ソースコードを以下に示します。
なお、httpクライアントはOkHttp、JSONの処理はGsonを使用しています。
「ODPT Train API」のレスポンス(JSON)から路線の「路線名」、「固有識別子」、「路線の駅」を抽出してRaillineインスタンスを生成し、路線内の駅の「駅名」、「固有識別子」、「関連する路線の識別子」からStationインスタンスを生成しています。駅は路線毎に固有識別子が割り当てられているようなので、「駅名(和名)」で情報を集約しています。
import java.io.BufferedWriter;
import java.io.File;
import java.io.FileOutputStream;
import java.io.OutputStreamWriter;
import java.util.ArrayList;
import java.util.HashMap;
import java.util.List;
import java.util.Map;
import java.util.concurrent.TimeUnit;
import com.google.gson.Gson;
import com.google.gson.GsonBuilder;
import okhttp3.OkHttpClient;
import okhttp3.Request;
import okhttp3.Response;

public class Test {
	private static final String URL_TOKYO_CH="https://api-tokyochallenge.odpt.org/api/v4/";
	private static final String KEY_TOKYO_CH="アクセストークン";

	@SuppressWarnings({ "unused", "rawtypes", "unchecked" })
	public static void main(String[] args){
        OkHttpClient.Builder okHttpBuilder = new OkHttpClient.Builder();
        okHttpBuilder.connectTimeout(20, TimeUnit.SECONDS);
        okHttpBuilder.readTimeout(20, TimeUnit.SECONDS);
        okHttpBuilder.writeTimeout(20, TimeUnit.SECONDS);
        OkHttpClient client=okHttpBuilder.build();
        Gson gson = new GsonBuilder().setPrettyPrinting().create();
        List<Map> list=trainAPI(client,gson,"odpt:Railway");
        Map<String,Station> stations=new HashMap<String,Station>();
        List<RailLine> raillines=new ArrayList<RailLine>();
    	for(Map map : list){
    		RailLine line=new RailLine();
    		line.name_ja=((Map)map.get("odpt:railwayTitle")).get("ja").toString();
    		line.name_en=((Map)map.get("odpt:railwayTitle")).get("en").toString();
    		line.sameAs=map.get("owl:sameAs").toString();
    		line.operator=map.get("odpt:operator").toString();
    		List<Map> ll=(List<Map>)map.get("odpt:stationOrder");
    		for(Map o : ll){
    			String st=((Map)o.get("odpt:stationTitle")).get("ja").toString();
    			line.stations.add(st);
    			if(stations.containsKey(st)){
    				Station s=stations.get(st);
    				s.lines.add(line.name_ja);
    			}else{
    				Station s=new Station();
    				s.sameAs=o.get("owl:sameAs").toString();
    				s.name_ja=((Map)o.get("odpt:stationTitle")).get("ja").toString();
    				s.name_en=((Map)o.get("odpt:stationTitle")).get("en").toString();
    				s.lines.add(line.sameAs);
    				stations.put(s.name_ja, s);
    			}
    		}
    		raillines.add(line);
    	}
    	Map<String,Object> ret=new HashMap<String,Object>();
    	ret.put("stations", stations);
    	ret.put("raillines", raillines);
        File f=new File("railway.json");
        BufferedWriter bw=null;
        try{
        	bw=new BufferedWriter(new OutputStreamWriter(new FileOutputStream(f),"UTF-8"));
        	bw.write(gson.toJson(ret));
        	bw.flush();
        	bw.close();
        	bw=null;
        }catch(Exception e){
        	e.printStackTrace();
        }finally{
        	if(bw!=null){
        		try{bw.close();}catch(Exception e){}
        	}
        }
	}

	@SuppressWarnings("unchecked")
	private static List<Map> trainAPI(OkHttpClient client,Gson gson,String odpc){
		String url=URL_TOKYO_CH+odpc+"?acl:consumerKey="+KEY_TOKYO_CH;
		System.out.println(url);
        try{
    		Request request = new Request.Builder()
                    .url(url)
                    .get()
                    .build();
            Response response = client.newCall(request).execute();
    		return gson.fromJson(response.body().string(), List.class);
        }catch(Exception e){
        	e.printStackTrace();
        	return null;
        }
	}

	static class Station{
		public String name_ja;
		public String name_en;
		public String sameAs;
		public List<String> lines=new ArrayList<String>();
	}
	static class RailLine{
		public String name_ja;
		public String name_en;
		public String sameAs;
		public String operator;
		public List<String> stations=new ArrayList<String>();
	}
}
2.出力したJSON
上記のコードを実行すると、以下のJSONファイルが出力されます。
これを眺めていると、「こういう路線があって、こういう駅があるんだー」となんとなく首都圏の鉄道網について理解が増した気がします。
{
  "raillines": [
    {
      "name_ja": "東京さくらトラム(都電荒川線)",
      "name_en": "Tokyo Sakura Tram (Arakawa Line)",
      "sameAs": "odpt.Railway:Toei.Arakawa",
      "operator": "odpt.Operator:Toei",
      "stations": [
        "三ノ輪橋",
        "荒川一中前",
        "荒川区役所前",
        "荒川二丁目",
        "荒川七丁目",
        "町屋駅前",
        "町屋二丁目",
        "東尾久三丁目",
        "熊野前",
        "宮ノ前",
        "小台",
        "荒川遊園地前",
        "荒川車庫前",
        "梶原",
        "栄町",
        "王子駅前",
        "飛鳥山",
        "滝野川一丁目",
        "西ヶ原四丁目",
        "新庚申塚",
        "庚申塚",
        "巣鴨新田",
        "大塚駅前",
        "向原",
        "東池袋四丁目",
        "都電雑司ヶ谷",
        "鬼子母神前",
        "学習院下",
        "面影橋",
        "早稲田"
      ]
    },
/***** 省略 *******/
  "stations": {
    "世良田": {
      "name_ja": "世良田",
      "name_en": "Serada",
      "sameAs": "世良田",
      "lines": [
        "odpt.Railway:Tobu.Isesaki"
      ]
    },
    "東所沢": {
      "name_ja": "東所沢",
      "name_en": "Higashi-Tokorozawa",
      "sameAs": "東所沢",
      "lines": [
        "odpt.Railway:JR-East.Musashino"
      ]
    },
/***** 省略 *******/
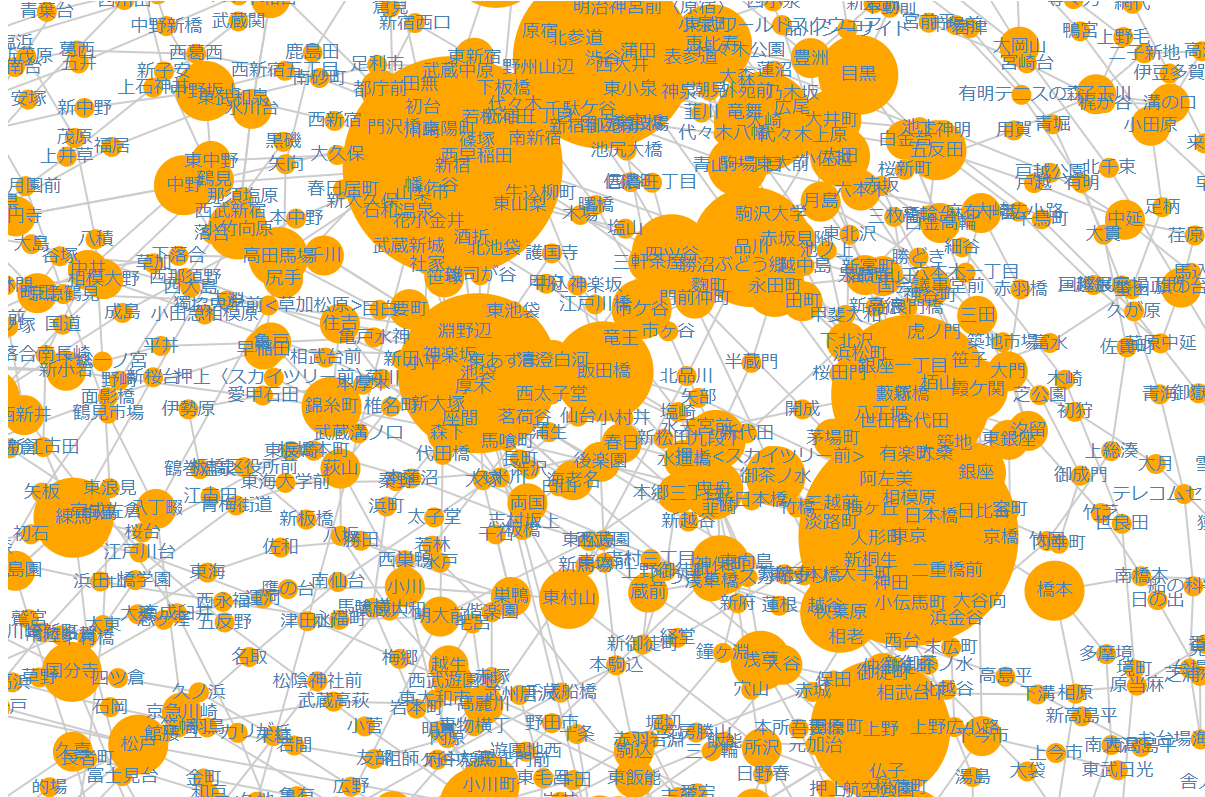
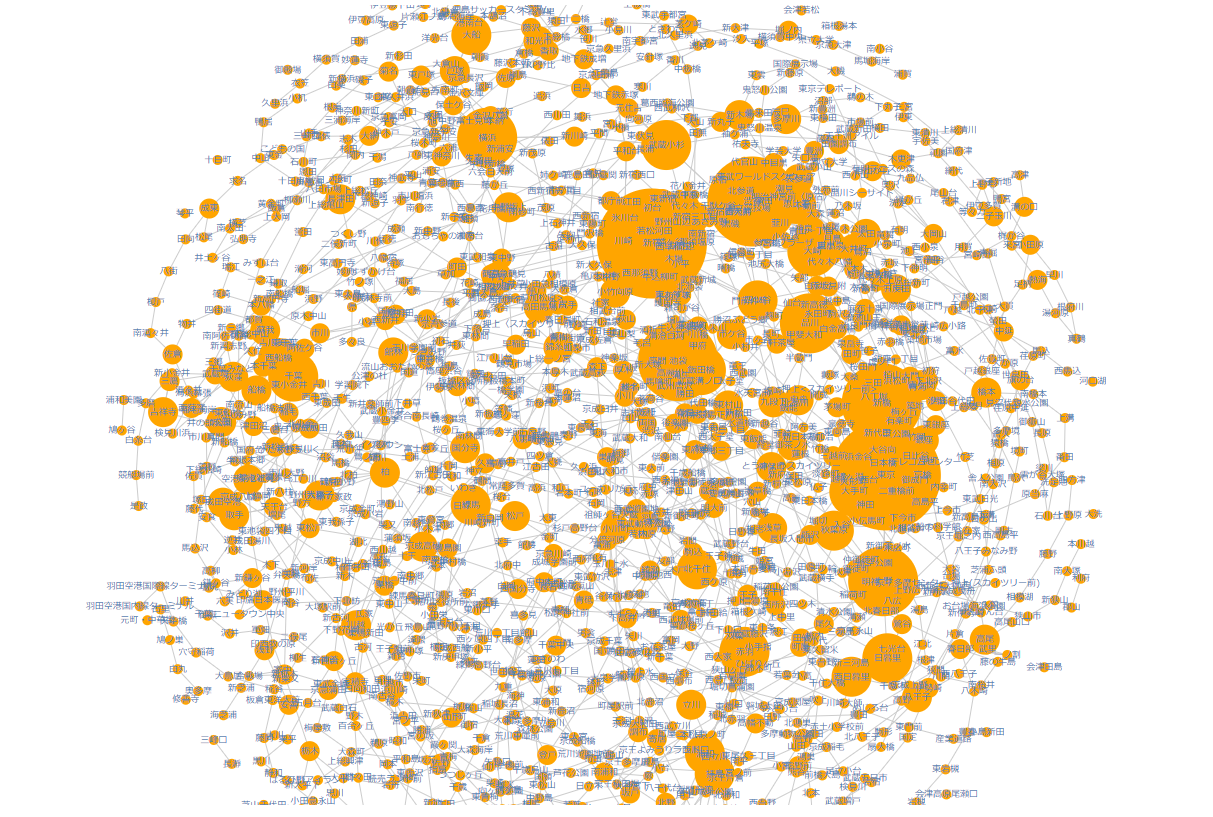
3.D3.jsでForce-Graphを表示
路線・駅の情報ををD3.jsに読み込み、Force-Graphを生成してみました。
初めてD3.jsでForce-Graphを作りましたが、javaでGraphLayoutを書く時と比べて、すごく簡単に作れるのに驚きました。
D3.jsすごい。
<!DOCTYPE html>
<html>
<head>
    <title>tokyo-challenge-test</title>
    <script src="https://cdnjs.cloudflare.com/ajax/libs/d3/5.9.2/d3.min.js"></script>
</head>
<body>
<svg></svg>
<script type="text/javascript">
    let width = 1200;
    let height = 800;
    const loadData = () => {
        d3.json("railway.json").then(function(json) {
            createMap(json);
        });
    };
    const createMap=(json)=>{
        const rail=json.raillines;
        const station=json.stations;
        let nodes=[];
        let links=[];
        let check={};
        let idv=0;
        for(let i=0;i<rail.length;i++){
            let sts=rail[i].stations;
            let tmp=[];
            for(let j=0;j<sts.length;j++){
                if(!check[sts[j]]){
                    let p={id:idv++,label:station[sts[j]].name_ja,val:1};
                    tmp.push(p);
                    nodes.push(p);
                    check[sts[j]]=p;
                }else{
                    check[sts[j]].val=check[sts[j]].val+1;
                    tmp.push(check[sts[j]]);
                }
            }
            for(let i=1;i<tmp.length;i++){
                let l={source:tmp[i-1].id,target:tmp[i].id};
                links.push(l);
            }
        }
        const svg = d3.select("svg").attr("width",width).attr("height",height);
        const link = d3.select("svg")
            .selectAll("line")
            .data(links)
            .enter()
            .append("line")
            .attr("stroke-width", 1)
            .attr("stroke", "#ccc");
        const node = d3.select("svg")
            .selectAll("g")
            .data(nodes)
            .enter()
            .append("circle")
            .attr("r",function(d){return d.val*5;})
            .attr("fill", "orange")
            .call(d3.drag()
            .on("start", dragstarted)
            .on("drag", dragged)
            .on("end", dragended));
        const label = d3.select("svg")
            .selectAll("g")
            .data(nodes)
            .enter()
            .append("text")
            .attr("text-anchor", "middle")
            .attr("dominant-baseline", "middle")
            .style("fill", "steelblue")
            .style("font-size", "9px")
            .text(function(d){return d.label;});
        const simulation = d3.forceSimulation()
            .force("link", d3.forceLink())
            .force("center", d3.forceCenter(600, 450))
            .force("charge", d3.forceManyBody().strength(-8))
            .force("x", d3.forceX().strength(0.05).x(width / 2))
            .force("y", d3.forceY().strength(0.05).y(height / 2));

        simulation.nodes(nodes).on("tick", ticked);
        simulation.force("link").links(links);
        function ticked() {
            link.attr("x1", function(d) { return d.source.x; })
                .attr("y1", function(d) { return d.source.y; })
                .attr("x2", function(d) { return d.target.x; })
                .attr("y2", function(d) { return d.target.y; });
            node.attr("cx", function(d) { return d.x; })
                .attr("cy", function(d) { return d.y; });
            label.attr("x", function(d) { return d.x; })
                .attr("y", function(d) { return d.y; });
        }
        function dragstarted(d) {
            if(!d3.event.active) simulation.alphaTarget(0.3).restart();
            d.fx = d.x;
            d.fy = d.y;
        }
         function dragged(d) {
            d.fx = d3.event.x;
            d.fy = d3.event.y;
        }
        function dragended(d) {
            if(!d3.event.active) simulation.alphaTarget(0);
            d.fx = null;
            d.fy = null;
        }
        const zoom = d3.zoom()
            .scaleExtent([1/4,4])
            .on('zoom', function(){
                node.attr("transform", d3.event.transform);
                link.attr("transform", d3.event.transform);
                label.attr("transform", d3.event.transform);
            });
        svg.call(zoom);
    }
    loadData();
</script>
</body>
</html>
最後に
駅・路線が多すぎて、よくわからないグラフになりましたが、上野駅よりも新宿駅、渋谷駅の方が乗り入れている路線が多いのは意外でした。
もう少し表示を工夫したり、各駅間の距離や運賃等のデータを追加して遊んでみたいと思っています。