Pandas で Groupby を使って、グループごとにデータ処理をすることが多くなってきたので、何ができるのかをまとめてみました。あくまで個人用の備忘録です。
Pandas のバージョンは1.2.4のときの内容です。
DataFrameGroupBY, SeriesGroupBy と表記を分けていますが、ことわりがない限り、どちらでも動作します。
例として使用するデータは、以下の通り。
表データ(変数名:df)
| Animal | Max Speed | Weight | |
|---|---|---|---|
| 0 | Falcon | 375.0 | 1.0 |
| 1 | Parrot | 20.0 | 2.2 |
| 2 | Falcon | 380.0 | 0.9 |
| 3 | Parrot | 23.0 | 2.0 |
| 4 | Falcon | 370.0 | 1.2 |
| 5 | Falcon | 390.0 | 1.1 |
| 6 | Parrot | 26.0 | 2.5 |
時系列データ(変数名:df_time)
| 変数 | 値 | |
|---|---|---|
| 2021-01-01 | 最高気温 | 10.0 |
| 2021-01-02 | 最高気温 | 11.0 |
| 2021-01-03 | 最高気温 | 9.0 |
| 2021-01-04 | 最高気温 | 9.3 |
| 2021-01-05 | 最高気温 | 10.2 |
| 2021-01-06 | 最高気温 | 12.0 |
| 2021-01-07 | 最高気温 | 8.3 |
| 2021-01-01 | 最高湿度 | 12.0 |
| 2021-01-02 | 最高湿度 | 14.0 |
| 2021-01-03 | 最高湿度 | 11.0 |
| 2021-01-04 | 最高湿度 | 12.3 |
| 2021-01-05 | 最高湿度 | 11.2 |
| 2021-01-06 | 最高湿度 | 14.3 |
| 2021-01-07 | 最高湿度 | 15.0 |
データの取り出し
グループごとのデータフレームを順番に取り出したい
Groupby.__iter__() を使う。
for group, df_group in df.groupby("Animal").__iter__():
    print(f"グループ名: {group}")
    print(df_group)
    print()
グループ名: Falcon
   Animal  Max Speed  Weight
0  Falcon      375.0     1.0
2  Falcon      380.0     0.9
4  Falcon      370.0     1.2
5  Falcon      390.0     1.1

グループ名: Parrot
   Animal  Max Speed  Weight
1  Parrot       20.0     2.2
3  Parrot       23.0     2.0
6  Parrot       26.0     2.
特定のグループのデータフレームを取得したい
Groupby.get_group(name) を使う。
# Falcon グループを取得する場合
df.groupby("Animal").get_group("Falcon")
   Animal  Max Speed  Weight
0  Falcon      375.0     1.0
2  Falcon      380.0     0.9
4  Falcon      370.0     1.2
5  Falcon      390.0     1.1
グループごとの先頭 or 末尾の行を取り出したい
Groupby.first([numeric_only, min_count]) もしくは Groupby.last([numeric_only, min_count]) を使う。
# first は各グループの最初の行を取得できる
df.groupby("Animal").first()

# last は各グループの最後の行を取得できる
df.groupby("Animal").last()

# min_count で指定した行数未満のグループは、NaN を返すようにできる
df.groupby("Animal").first(min_count=4)
# first の結果
        Max Speed  Weight
Animal
Falcon      375.0     1.0
Parrot       20.0     2.2

# last の結果
        Max Speed  Weight
Animal
Falcon      390.0     1.1
Parrot       26.0     2.5

# min_count=4 を指定すると、Parrot グループは3行しかないので、NaNになる
        Max Speed  Weight
Animal
Falcon      375.0     1.0
Parrot        NaN     NaN
グループごとに先頭から n 行 or 末尾から n 行を取り出したい
Groupby.head(n) もしくは Groupby.tail(n) を使う。
データを取り出すときに、グループごとにソートはされない。
# head は各グループの先頭から n 行分を取得できる
df.groupby("Animal").head(3)

# tail は各グループの末尾から n 行分を取得できる
df.groupby("Animal").last(3)
# head(3) の結果
   Animal  Max Speed  Weight
0  Falcon      375.0     1.0
1  Parrot       20.0     2.2
2  Falcon      380.0     0.9
3  Parrot       23.0     2.0
4  Falcon      370.0     1.2
6  Parrot       26.0     2.5

# tail(3) の結果
   Animal  Max Speed  Weight
1  Parrot       20.0     2.2
2  Falcon      380.0     0.9
3  Parrot       23.0     2.0
4  Falcon      370.0     1.2
5  Falcon      390.0     1.1
6  Parrot       26.0     2.5
グループごとに n 番目もしくは n_1, n_2, ... 番目のデータを取り出したい
Groupby.nth(n) もしくは DataFrameGroupBy.take を使う。
take に関しては、DataFrameGroupBy になっているが SeriesGroupBy でも使える。
take は指定したグループと取り出した行のインデックスのマルチインデックスを返す。
# nth でグループごとに n 番目のデータを取得できる
df.groupby("Animal").nth(2)

# nth でグループごとに n 番目のデータを取得できる(リストで複数列の取得ができる)
df.groupby("Animal").nth([0, 2])

# take でグループごとにインデックスを指定して、データを取り出せる
df.groupby("Animal").take([0, 2])

# axis=1 を指定することで、n 番目の列を取り出せる
df.groupby("Animal").take([1], axis=1)
# nth(2) の結果
        Max Speed  Weight
Animal
Falcon      370.0     1.2
Parrot       26.0     2.5

# nth([0, 2]) の結果
        Max Speed  Weight
Animal
Falcon      375.0     1.0
Falcon      370.0     1.2
Parrot       20.0     2.2
Parrot       26.0     2.5

# take([0, 2]) の結果
          Max Speed  Weight
Animal
Falcon 0      375.0     1.0
       4      370.0     1.2
Parrot 1       20.0     2.2
       6       26.0     2.5

# take([1], axis=1) の結果
   Weight
0     1.0
1     2.2
2     0.9
3     2.0
4     1.2
5     1.1
6     2.5
グループごとにある値が小さい順もしくは大きい順に n 行を取り出したい
SeriesGroupBy のみの機能
SeriesGroupBy.nsmallest(n, keep) もしくは SeriesGroupBy.nlargest(n, keep) を使う。
keep は重複があった場合に、どのような処理をするのかを指定できる(デフォルトは first)。
# nsmallest で小さい順に n 個のデータを取得できる
df.groupby("Animal")["Max Speed"].nsmallest(n=2)

# nlargest で大きい順に n 個のデータを取得できる
df.groupby("Animal")["Max Speed"].nlargest(n=2)
# nsmallest の結果
Animal
Falcon  4    370.0
        0    375.0
Parrot  1     20.0
        3     23.0
Name: Max Speed, dtype: float64

# nlargest の結果
Animal
Falcon  5    390.0
        2    380.0
Parrot  6     26.0
        3     23.0
Name: Max Speed, dtype: float64
グループごとにユニークな要素を取得したい
SeriesGroupBy のみの機能
SeriesGroupBy.unique()を使う。
# 最大スピードから、ユニークな要素を取得する。
df.groupby("Animal")["Max Speed"].unique()
Animal
Falcon    [375.0, 380.0, 370.0, 390.0]
Parrot              [20.0, 23.0, 26.0]
Name: Max Speed, dtype: object
グループごとにユニークな要素の数を取得したい
SeriesGroupBy のみの機能
SeriesGroupBy.nunique()を使う。
# 最大スピードから、ユニークな要素の数を取得する。
df.groupby("Animal")["Max Speed"].nunique()
Animal
Falcon    4
Parrot    3
Name: Max Speed, dtype: int64
グループごとに要素ごとの数を取得したい
SeriesGroupBy のみの機能
SeriesGroupBy.value_counts()を使う。
# 最大スピードから、要素ごとの数を取得する。
df.groupby("Animal")["Max Speed"].value_counts()
Animal  Max Speed
Falcon  370.0        1
        375.0        1
        380.0        1
        390.0        1
Parrot  20.0         1
        23.0         1
        26.0         1
Name: Max Speed, dtype: int64
グループごとにランダムで n 行のデータを取り出したい
DataFrameGroupBy.sample([n, frac, replace, weights, random_state]) を使う。
n もしくは frac のいずれかで、サンプリングの頻度を指定する。
# n=2 でランダムに 2 行取り出す
df.groupby("Animal").sample(n=2)

# frac=0.8 で各グループの8割の行をランダムに取り出す
df.groupby("Animal").sample(frac=0.8)
# n=2 の結果
   Animal  Max Speed  Weight
2  Falcon      380.0     0.9
5  Falcon      390.0     1.1
1  Parrot       20.0     2.2
3  Parrot       23.0     2.0

# frac=0.8 の結果
   Animal  Max Speed  Weight
5  Falcon      390.0     1.1
4  Falcon      370.0     1.2
0  Falcon      375.0     1.0
1  Parrot       20.0     2.2
6  Parrot       26.0     2.5
条件を満たすグループのデータフレームを取り出したい
DataFrameGroupBy.filter(func, dropna) を使う。
func は関数で、各グループのデータフレームを受け取り、True / False を返す必要がある。
# グループごとに最高速度の最大値が300を超えるものだけを取り出している
df.groupby("Animal").filter(lambda x: x["Max Speed"].max() > 300)
# 最高速度の最大値が 300 を超えるグループのみを取り出した結果
   Animal  Max Speed  Weight
0  Falcon      375.0     1.0
2  Falcon      380.0     0.9
4  Falcon      370.0     1.2
5  Falcon      390.0     1.1
グループに関する情報の取得
どんなグループがあるのかを取得したい
GroupBy.groups もしくは GroupBy.indices を使う。
両者の違いは、各グループのインデックス情報のデータ型にある?
両者とも、グループ名とインデックスを辞書で返す。
df.groupby("Animal").groups
# -> {'Falcon': [0, 2, 4, 5], 'Parrot': [1, 3, 6]}

df.groupby("Animal").indices
# -> {'Falcon': array([0, 2, 4, 5]), 'Parrot': array([1, 3, 6])}
グループ名のリストが欲しい場合は、keys() を list にキャストすればOK。
list(df.groupby("Animal").groups.keys())
# -> ['Falcon', 'Parrot']
グループごとに要素(欠測値を除く)がどのくらいあるのか確認したい
DataFrameGroupBy.count() を使う。
df.groupby("Animal").count()
        Max Speed  Weight
Animal
Falcon          4       4
Parrot          3       3
グループごとの出現順を取得したい
DataFrameGroupBy.comcount(ascending) を使う。
ascending=False を指定することで、数字を反転することができる。
# 0 スタート
df.groupby("Animal").cumcount()

# group - 1 スタート
df.groupby("Animal").cumcount(ascending=False)
# ascending=True (デフォルト)
0    0
1    0
2    1
3    1
4    2
5    3
6    2
dtype: int64

# ascending=False
0    3
1    2
2    2
3    1
4    1
5    0
6    0
dtype: int64
グループごとに数字を振りたい
GroupBy.ngroup(ascending) を使う。
ascending=False を指定することで、数字を反転することができる。
# 0 スタート
df.groupby("Animal").ngroup()

# group - 1 スタート
df.groupby("Animal").ngroup(ascending=False)
# ascending=True (デフォルト)
0    0
1    1
2    0
3    1
4    0
5    0
6    1
dtype: int64

# ascending=False
0    1
1    0
2    1
3    0
4    1
5    1
6    0
dtype: int64
グループごとのデータ数(行数)を取得したい
GroupBy.size() を使う。
df.groupby("Animal").size()
Animal
Falcon    4
Parrot    3
dtype: int64
グループごとに集約(統計量など)
グループごとに最小値 / 最大値を取りたい
最小値を取るときは GroupBy.min() を、最大値を取るときは GroupBy.max() を使う。
# 最小値
df.groupby("Animal").min()

# 最大値
df.groupby("Animal").max()
# 最小値
        Max Speed  Weight
Animal
Falcon      370.0     0.9
Parrot       20.0     2.0

# 最大値
        Max Speed  Weight
Animal
Falcon      390.0     1.2
Parrot       26.0     2.5
グループごとに統計量を算出したい
- 平均値:
GroupBy.mean() - 不偏分散:
GroupBy.var(ddof=1) - 不偏標準偏差:
GroupBy.std(ddof=1) - 標準誤差:
GroupBy.sem(ddof=1) - 尖度:
DataFrameGroupBy.skew() - 平均絶対偏差:
DataFrameGroupBy.mad() - 共分散行列:
DataFrameGroupBy.cov() - 相関係数:
DataFrameGroupBy.corr() - 中央値:
GroupBy.median() - 分位数:
DataFrameGroupBy.quantile(q=50) - 四本値(始値、高値、安値、終値):
GroupBy.ohlc() - 基本統計量:
GroupBy.describe()
を使う。
# 平均値
df.groupby("Animal").mean()

# 不偏分散
df.groupby("Animal").var()  # 不偏分散
df.groupby("Animal").var(ddof=0)  # 定義通りの分散

# 不偏標準偏差
df.groupby("Animal").std()  # 不偏標準偏差
df.groupby("Animal").std(ddof=0)  # 定義通りの標準偏差

# 標準誤差
df.groupby("Animal").sem()  # 不偏標準偏差を用いた標準誤差
df.groupby("Animal").sem(ddof=0)  # 定義通りの標準偏差を用いた標準語差

# 尖度
df.groupby("Animal").skew()

# 平均絶対偏差
df.groupby("Animal").mad()

# 共分散行列
df.groupby("Animal").cov()

# 相関係数
df.groupby("Animal").corr()

# 中央値
df.groupby("Animal").median()

# 分位数
df.groupby("Animal").quantile()  # デフォルトは q=0.5
df.groupby("Animal").quantile(q=[0.1, 0.8])  # リストで複数の分位数を取得できる

# 四本値
df.groupby("Animal").ohlc()

# 基本統計量
df.groupby("Animal").describe()
# 平均値
        Max Speed    Weight
Animal
Falcon     378.75  1.050000
Parrot      23.00  2.233333

# 不偏分散
        Max Speed    Weight
Animal
Falcon  72.916667  0.016667
Parrot   9.000000  0.063333

# 不偏標準偏差
        Max Speed    Weight
Animal
Falcon   8.539126  0.129099
Parrot   3.000000  0.251661

# 標準誤差
        Max Speed    Weight
Animal
Falcon   4.269563  0.064550
Parrot   1.732051  0.145297

# 尖度
        Max Speed    Weight
Animal
Falcon   0.752837  0.000000
Parrot   0.000000  0.585583

# 平均絶対偏差
        Max Speed    Weight
Animal
Falcon       6.25  0.100000
Parrot       2.00  0.177778

# 共分散行列
                  Max Speed    Weight
Animal
Falcon Max Speed  72.916667 -0.250000
       Weight     -0.250000  0.016667
Parrot Max Speed   9.000000  0.450000
       Weight      0.450000  0.063333

# 相関係数
                  Max Speed    Weight
Animal
Falcon Max Speed   1.000000 -0.226779
       Weight     -0.226779  1.000000
Parrot Max Speed   1.000000  0.596040
       Weight      0.596040  1.000000

# 中央値
        Max Speed  Weight
Animal
Falcon      377.5    1.05
Parrot       23.0    2.20

# 分位数
            Max Speed  Weight
Animal
Falcon 0.1      371.5    0.93
       0.8      384.0    1.14
Parrot 0.1       20.6    2.04
       0.8       24.8    2.38

# 四本値
       Max Speed                      Weight
            open   high    low  close   open high  low close
Animal
Falcon     375.0  390.0  370.0  390.0    1.0  1.2  0.9   1.1
Parrot      20.0   26.0   20.0   26.0    2.2  2.5  2.0   2.5

# 基本統計量
       Max Speed                                                       Weight
           count    mean       std    min     25%    50%    75%    max  count       mean       std  min    25%   50%    75%  max
Animal
Falcon       4.0  378.75  8.539126  370.0  373.75  377.5  382.5  390.0    4.0   1.050000  0.129099  0.9  0.975  1.05  1.125  1.2
Parrot       3.0   23.00  3.000000   20.0   21.50   23.0   24.5   26.0    3.0   2.233333  0.251661  2.0  2.100  2.20  2.350  2.5
グループごとに総和 / 総乗を求めたい
- 総和:
GroupBy.sum() - 総乗:
GroupBy.prod()
を使う。
# 総和
df.groupby("Animal").sum()

# 総乗
df.groupby("Animal").prod()
# 総和
        Max Speed  Weight
Animal
Falcon     1515.0     4.2
Parrot       69.0     6.7

# 総乗
           Max Speed  Weight
Animal
Falcon  2.056275e+10   1.188
Parrot  1.196000e+04  11.000
グループごとに累積和 / 累積積 / 最小値 / 最大値を求めたい
- 累積和:
GroupBy.cumsum(axis) - 累積積:
GroupBy.cumprod(axis) - 累積最小値:
GroupBy.cummin(axis) - 累積最大値:
GriupBy.cummax(axis)
を使う。
# 累積和:最初の値から順に足していく
df.groupby("Animal").cumsum()

# 累積積:最初の値から順に席を取っていく
df.groupby("Animal").cumprod()

# 累積最小値:最小値を更新されたタイミングで値が変化する
df.groupby("Animal").cummin()

# 累積最大値:最大値を更新されたタイミングで値が変化する
df.groupby("Animal").cummax()
# 累積和
   Max Speed  Weight
0      375.0     1.0
1       20.0     2.2
2      755.0     1.9
3       43.0     4.2
4     1125.0     3.1
5     1515.0     4.2
6       69.0     6.7

# 累積積
      Max Speed  Weight
0  3.750000e+02   1.000
1  2.000000e+01   2.200
2  1.425000e+05   0.900
3  4.600000e+02   4.400
4  5.272500e+07   1.080
5  2.056275e+10   1.188
6  1.196000e+04  11.000

# 累積最小値
   Max Speed  Weight
0      375.0     1.0
1       20.0     2.2
2      375.0     0.9
3       20.0     2.0
4      370.0     0.9
5      370.0     0.9
6       20.0     2.0

# 累積最大値
   Max Speed  Weight
0      375.0     1.0
1       20.0     2.2
2      380.0     1.0
3       23.0     2.2
4      380.0     1.2
5      390.0     1.2
6       26.0     2.5
グループごとにランク付けをしたい
GroupBy.rank(method, ascending, ...) を使う。
同率の場合は平均の順位をつける(デフォルト)
df.groupby("Animal").rank()
   Max Speed  Weight
0        2.0     2.0
1        1.0     2.0
2        3.0     1.0
3        2.0     1.0
4        1.0     4.0
5        4.0     3.0
6        3.0     3.0
同率の場合は小さい方の順位を採用する
df.groupby("Animal").rank(method="min")
   Max Speed  Weight
0        2.0     2.0
1        1.0     2.0
2        3.0     1.0
3        2.0     1.0
4        1.0     4.0
5        4.0     3.0
6        3.0     3.0
同率の場合は大きい方の順位を採用する
df.groupby("Animal").rank(method="max")
   Max Speed  Weight
0        2.0     2.0
1        1.0     2.0
2        3.0     1.0
3        2.0     1.0
4        1.0     4.0
5        4.0     3.0
6        3.0     3.0
同率の場合は最初に登場した要素を優先する(同率を作らない)
df.groupby("Animal").rank(method="first")
   Max Speed  Weight
0        2.0     2.0
1        1.0     2.0
2        3.0     1.0
3        2.0     1.0
4        1.0     4.0
5        4.0     3.0
6        3.0     3.0
同率の場合は小さい方の順位を採用するが、順位の上昇幅を1に制限する
# method="dense" で同率の場合は最小順位を採用するが、ランクの上昇幅は1に制限される
# 同率2位の要素が二つあった場合、次の順位は4位ではなく、3位になる
df.groupby("Animal").rank(method="dense")
   Max Speed  Weight
0        2.0     2.0
1        1.0     2.0
2        3.0     1.0
3        2.0     1.0
4        1.0     4.0
5        4.0     3.0
6        3.0     3.0
順位を降順にする
df.groupby("Animal").rank(ascending=False)
   Max Speed  Weight
0        3.0     3.0
1        3.0     2.0
2        2.0     4.0
3        2.0     3.0
4        4.0     1.0
5        1.0     2.0
6        1.0     1.0
順位をパーセンテージ表記にする
df.groupby("Animal").rank(pct=True)
   Max Speed    Weight
0   0.500000  0.500000
1   0.333333  0.666667
2   0.750000  0.250000
3   0.666667  0.333333
4   0.250000  1.000000
5   1.000000  0.750000
6   1.000000  1.000000
グループごとに最小値 / 最大値を取るインデックスを取得したい
- 最小値のインデックス取得:
DataFrameGroupBy.idxmin() - 最小値のインデックス取得:
DataFrameGroupBy.idxmax()
を使う。
# 最小値のインデックス
df.groupby("Animal").idxmin()

# 最大値のインデックス
df.groupby("Animal").idxmax()
# idxmin
        Max Speed  Weight
Animal
Falcon          4       2
Parrot          1       3

# idxmax
        Max Speed  Weight
Animal
Falcon          5       4
Parrot          6       6
グループごと・列ごとに何かしらの処理をしたい
apply, aggregate (or agg), transform の3種類がある。
最も柔軟なのは apply ではあるが、特定の処理に特化した aggregate や transform と比べると処理速度がかなり遅くなる可能性があるらしい。
While apply is a very flexible method, its downside is that using it can be quite a bit slower than using more specific methods like agg or transform.
公式ドキュメントより
GroupBy.apply(func, *args, **kwargs) の func は、DataFrame、Series もしくはスカラを返す関数で、返すデータ型によって最終的な出力のデータフレームの大きさが変わる。
*args, **kargs は func に渡す引数。
スカラを返す場合
# 最大値を返す関数
def max(x):
    return x.max()

df.groupby("Animal").apply(max)
        Animal  Max Speed  Weight
Animal
Falcon  Falcon      390.0     1.2
Parrot  Parrot       26.0     2.5
Series を返す場合
# 各要素に 100 を加算する関数
def add(x):
    return x + 100

df.groupby("Animal").apply(add)
   Max Speed  Weight
0      475.0   101.0
1      120.0   102.2
2      480.0   100.9
3      123.0   102.0
4      470.0   101.2
5      490.0   101.1
6      126.0   102.5
DataFrame を返す場合
# 元の要素と 100 を加算した要素を横連結させたデータフレームを返す関数
def add(x):
    return pd.concat([x, x + 100], axis=1)

df.groupby("Animal").apply(add)
          Max Speed  Weight  Max Speed  Weight
Animal
Falcon 0      375.0     1.0      475.0   101.0
       2      380.0     0.9      480.0   100.9
       4      370.0     1.2      470.0   101.2
       5      390.0     1.1      490.0   101.1
Parrot 1       20.0     2.2      120.0   102.2
       3       23.0     2.0      123.0   102.0
       6       26.0     2.5      126.0   102.5
集約をしたい場合は、GroupBy.aggregate(func, *args, **kargs) を使う。
func は、一つの値を返す必要がある(スカラもしくは文字列)。
また、複数の関数を渡すことができる。
なお、GroupBy.agg は全く同じもの(agg は aggregate のエイリアス)。
def max(x):
    return x.max()

def min(x):
    return x.min()

df.groupby("Animal").aggregate([max, min])
       Max Speed        Weight
             max    min    max  min
Animal
Falcon     390.0  370.0    1.2  0.9
Parrot      26.0   20.0    2.5  2.0
aggregate で集約をするとデータフレームの大きさが変わるが、大きさを変えないで列ごとに処理をしたい場合は、GroupBy.transform(func, *args, **kargs) を用いる。
transform は複数の処理を渡すことはできない。
# 平均からの差をとる(偏差)
def deviation(x):
    return x - x.mean()

df.groupby("Animal").transform(sub_mean)
   Max Speed    Weight
0      -3.75 -0.050000
1      -3.00 -0.033333
2       1.25 -0.150000
3       0.00 -0.233333
4      -8.75  0.150000
5      11.25  0.050000
6       3.00  0.266667
複数の処理を一気に実行したい(パイプ処理)
GroupBy.pipe(func, *args, **kargs)を使う。
可読性を向上したいときに使うと良い。
# Groupby の結果を用いて、複数の関数で処理をするときには pipe を使うと可読性が上がる

# グループごとの最大値を取る
def f(df):
    return df.agg(max)

# 指定された列の大きい方のグループ名を返す
def h(df, colname):
    max_index = df[colname].argmax()
    return df.index[max_index]

"""
h(f(df.groupby("Animal")), colname="Max Speed")
と同じ処理をしているが、可読性は pipe を用いた方が圧倒的に良い
"""
df.groupby("Animal").pipe(f).pipe(h, colname="Max Speed")
'Falcon'
グループごとに欠測値を確認・補間したい
以下のようなデータがあるとする。
| Animal | Max Speed | Weight | |
|---|---|---|---|
| 0 | Falcon | NaN | 1.0 |
| 1 | Falcon | NaN | 0.8 |
| 2 | Parrot | 30.0 | 2.2 |
| 3 | Falcon | 370.0 | NaN |
| 4 | Parrot | NaN | NaN |
| 5 | Parrot | 26.0 | NaN |
欠測値が含まれているかどうかを確認する
欠測値を確認する機能が実装されていないので、自作する必要がある。
def isnull(x, how="any"):
    if how == "any":
        return x.isnull().any()
    elif how == "all":
        return x.isnull().all()

# 一つでも欠測値を含むかどうかを確認するとき
df.groupby("Animal").agg(isnull)

# 全ての要素が欠測値かどうかを確認するとき
df.groupby("Animal").agg(isnull, how="all")
# how="any"
        Max Speed  Weight
Animal
Falcon       True    True
Parrot       True    True

# how="all"
        Max Speed  Weight
Animal
Falcon      False   False
Parrot      False   False
欠測値の数を確認する
欠測値の数を確認する機能が実装されていないので、自作する必要がある。
def count_null(x):
    return x.isnull().sum()

# 一つでも欠測値を含むかどうかを確認するとき
df.groupby("Animal").agg(count_null)
        Max Speed  Weight
Animal
Falcon        2.0     1.0
Parrot        1.0     2.0
前方補間(前と同じ値で補間)
DataFrameGroupBy.ffill() を使う(DataFrameGroupBy.pad() でも同じ)。
df.groupby("Animal").ffill()
   Max Speed  Weight
0        NaN     1.0
1        NaN     0.8
2       30.0     2.2
3      370.0     0.8
4       30.0     2.2
5       26.0     2.2
後方補間(後ろと同じ値で補間)
DataFrameGroupBy.bfill() を使う(DataFrameGroupBy.backfill() でも同じ)。
df.groupby("Animal").bfill()
   Max Speed  Weight
0      370.0     1.0
1      370.0     0.8
2       30.0     2.2
3      370.0     NaN
4       26.0     NaN
5       26.0     NaN
前方補間 + 後方補間
前方補間の場合は、欠測値から始まると、そこは補間されない。
後方補間の場合は、欠測値で終わると、そこは補間されない。
両方組み合わせれば、漏れなく補間できる。
df.groupby("Animal").ffill().bfill()
   Max Speed  Weight
0       30.0     1.0
1       30.0     0.8
2       30.0     2.2
3      370.0     0.8
4       30.0     2.2
5       26.0     2.2
線形補間
DataFrameGroupBy.interpolate() は実装されていないので、 apply とか transform で行う必要がある。
def interpolate(x):
    return x.interpolate(limit_direction="both")

df.groupby("Animal").transform(interpolate)
   Max Speed  Weight
0      370.0     1.0
1      370.0     0.8
2       30.0     2.2
3      370.0     0.8
4       28.0     2.2
5       26.0     2.2
系列データ処理
【再掲】以下のような時系列データ(df_time)があるとする。
横持ちのデータに変換したくなるが、そうせずに処理をすることを考える。
| 変数 | 値 | |
|---|---|---|
| 2021-01-01 | 最高気温 | 10.0 |
| 2021-01-02 | 最高気温 | 11.0 |
| 2021-01-03 | 最高気温 | 9.0 |
| 2021-01-04 | 最高気温 | 9.3 |
| 2021-01-05 | 最高気温 | 10.2 |
| 2021-01-06 | 最高気温 | 12.0 |
| 2021-01-07 | 最高気温 | 8.3 |
| 2021-01-01 | 最高湿度 | 12.0 |
| 2021-01-02 | 最高湿度 | 14.0 |
| 2021-01-03 | 最高湿度 | 11.0 |
| 2021-01-04 | 最高湿度 | 12.3 |
| 2021-01-05 | 最高湿度 | 11.2 |
| 2021-01-06 | 最高湿度 | 14.3 |
| 2021-01-07 | 最高湿度 | 15.0 |
グループごとに差分・変化率を求めたい
- 差分:
DataFrameGroupBy.diff() - 変化率:
DataFrameGroupBy.pct_change()
を使う。
インデックスが日付である必要はない。
# 差分
df_time.groupby("変数").diff()

# 変化率
df_time.groupby("変数").pct_change()
# 差分
              値
2021-01-01  NaN
2021-01-02  1.0
2021-01-03 -2.0
2021-01-04  0.3
2021-01-05  0.9
2021-01-06  1.8
2021-01-07 -3.7
2021-01-01  NaN
2021-01-02  2.0
2021-01-03 -3.0
2021-01-04  1.3
2021-01-05 -1.1
2021-01-06  3.1
2021-01-07  0.7

# 変化率
                   値
2021-01-01       NaN
2021-01-02  0.100000
2021-01-03 -0.181818
2021-01-04  0.033333
2021-01-05  0.096774
2021-01-06  0.176471
2021-01-07 -0.308333
2021-01-01       NaN
2021-01-02  0.166667
2021-01-03 -0.214286
2021-01-04  0.118182
2021-01-05 -0.089431
2021-01-06  0.276786
2021-01-07  0.048951
グループごとにデータをある間隔でリサンプリングしたい
DataFrameGroupBy.resample(rule, *args, **kargs) を使う。
rule でリサンプリングしたい間隔を指定する。例えば、
- 2日ごと:
2Dor2d - 1週間ごと:
1Wor1w
のように文字列で指定できる。詳しくはこちらを参照のこと。
ダウンサンプリングするときは、集約処理が必要になる。
アップサンプリングするときは欠測値が生じるので、補間処理が必要になる。
# ダウンサンプリング(1日ごと → 2日ごと)。集約方法は平均値を用いる。
df_time.groupby("変数").resample("2D").mean()
df_time.groupby("変数").resample("2D").agg(np.mean)  # agg を使うことができる

# アップサンプリング(1日ごと → 半日ごと)。補間方法は線形補間を用いる。
df_time.groupby("変数").resample("0.5D").interpolate().drop(columns="変数")
# ダウンサンプリング
                     値
変数
最高気温 2021-01-01  10.50
        2021-01-03   9.15
        2021-01-05  11.10
        2021-01-07   8.30
最高湿度 2021-01-01  13.00
        2021-01-03  11.65
        2021-01-05  12.75
        2021-01-07  15.00

# アップサンプリング
# 変数列はドロップでいいね(補間しちゃったけど...)
                              値
変数
最高気温 2021-01-01 00:00:00  10.00
     2021-01-01 12:00:00  10.50
     2021-01-02 00:00:00  11.00
     2021-01-02 12:00:00  10.00
     2021-01-03 00:00:00   9.00
     2021-01-03 12:00:00   9.15
     2021-01-04 00:00:00   9.30
     2021-01-04 12:00:00   9.75
     2021-01-05 00:00:00  10.20
     2021-01-05 12:00:00  11.10
     2021-01-06 00:00:00  12.00
     2021-01-06 12:00:00  10.15
     2021-01-07 00:00:00   8.30
最高湿度 2021-01-01 00:00:00  12.00
     2021-01-01 12:00:00  13.00
     2021-01-02 00:00:00  14.00
     2021-01-02 12:00:00  12.50
     2021-01-03 00:00:00  11.00
     2021-01-03 12:00:00  11.65
     2021-01-04 00:00:00  12.30
     2021-01-04 12:00:00  11.75
     2021-01-05 00:00:00  11.20
     2021-01-05 12:00:00  12.75
     2021-01-06 00:00:00  14.30
     2021-01-06 12:00:00  14.65
     2021-01-07 00:00:00  15.00
グループごとにデータをずらしたい(Shift したい)
DataFrameGroupBy.shift()を使う。
# データを後ろに1つずらす
df_time.groupby("変数").shift(1)

# データを前に1つずらす
df_time.groupby("変数").shift(1)
# データを後ろにずらす
               値
2021-01-01   NaN
2021-01-02  10.0
2021-01-03  11.0
2021-01-04   9.0
2021-01-05   9.3
2021-01-06  10.2
2021-01-07  12.0
2021-01-01   NaN
2021-01-02  12.0
2021-01-03  14.0
2021-01-04  11.0
2021-01-05  12.3
2021-01-06  11.2
2021-01-07  14.3

# データを前にずらす
               値
2021-01-01  11.0
2021-01-02   9.0
2021-01-03   9.3
2021-01-04  10.2
2021-01-05  12.0
2021-01-06   8.3
2021-01-07   NaN
2021-01-01  14.0
2021-01-02  11.0
2021-01-03  12.3
2021-01-04  11.2
2021-01-05  14.3
2021-01-06  15.0
2021-01-07   NaN
グループごとに値が単調増加 / 単調減少しているかどうかを確認する
SeriesGroupBy のみの機能
- 単調増加:
SeriesGroupBy.is_monotonic_increasing - 単調減少:
SeriesGroupBy.is_monotonic_decreasing
を使う。
# 単調増加かどうか
df_time.groupby("変数")["値"].is_monotonic_increasing

# 単調減少かどうか
df_time.groupby("変数")["値"].is_monotonic_decreasing
# 単調増加かどうか
変数
最高気温    False
最高湿度    False
Name: 値, dtype: bool

# 単調減少かどうか
変数
最高気温    False
最高湿度    False
Name: 値, dtype: bool
グラフの作成
Seaborn でグラフ作成した方がいいような気がします。楽だし、綺麗だし。
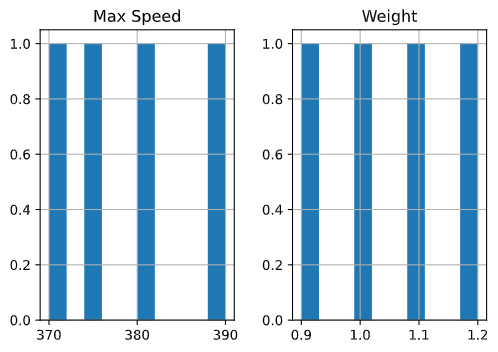
グループごとにヒストグラムを作成する
DataFrameGroupBy.hist(...) を使う。
df.groupby("Animal").hist()
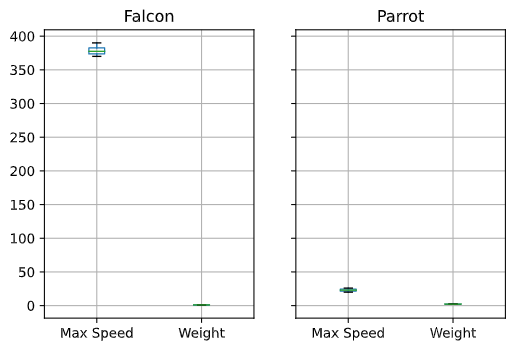
グループごとに箱ひげ図を作成する
DataFrameGroupBy のみの機能。
DataFrameGroupBy.boxplot(...) を使う。
df.groupby("Animal").boxplot()
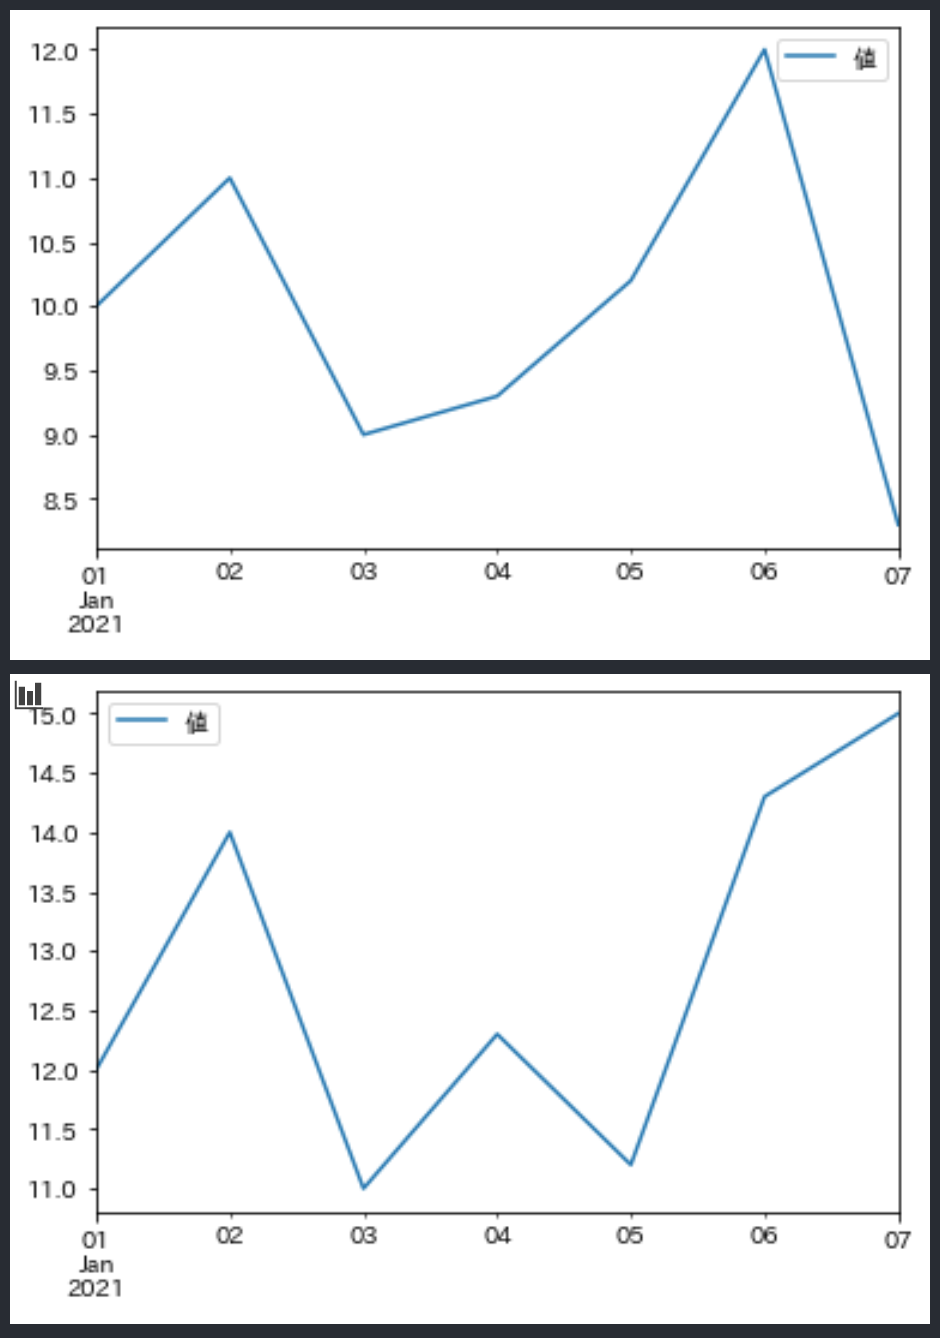
グループごとに折れ線グラフを作成する
DataFrameGroupBy.plot(...) を使う。
df_time.groupby("変数").plot()
やってないこと
DataFrameGroupBy.corrwith() はデータ用意するのが面倒で、まだ試してないです。
使いそうだなというときに、試します。
最後に
Pandas の機能のことを真面目に調べたことがなかったので(必要に応じて調べていた程度)、GroupBy について調べる前は、GroupBy だけにしかない機能がたくさんあるのかなと思いましたが、実際はそうでもなさそうですね。
なので、GroupBy に限定しなくてもよかったかなと書いている途中で思いました。
記事にまとめるのは結構大変ですね...疲れました...