31
27

Delete article

Deleted articles cannot be recovered.

Draft of this article would be also deleted.

Are you sure you want to delete this article?

More than 5 years have passed since last update.

matplotlibの散布図で値ごとに色付けするときのメモ

Posted at

この記事は何?

matplotlibで散布図を描くときはscatterを使いますが,各点毎に値が割り当てられているときにその値によって色付けしたい時があります.
いつも描き方を忘れるのでそのためのメモです.

ソースコード

import numpy as np
import matplotlib.cm as cm
import matplotlib.pyplot as plt

if __name__ == '__main__':
    N = 100
    X = np.random.rand(N, 2)
    y = np.random.rand(N) * 2 - 1
    sc = plt.scatter(X[:, 0], X[:, 1], vmin=-1, vmax=1, c=y, cmap=cm.seismic)
    plt.colorbar(sc)
    plt.show()

Xは2次元上の点を表し,yは各点に割り当てられた値を表します.
今回は各点に-1から1の値を割り当てました.
plt.scatterに渡す引数でvminとvmaxを指定すると,colormapの最小値と最大値を指定することができます.
また,plt.scatterの返り値をplt.colorbarに渡すことでcolormapのcolorbarも描くことができます.
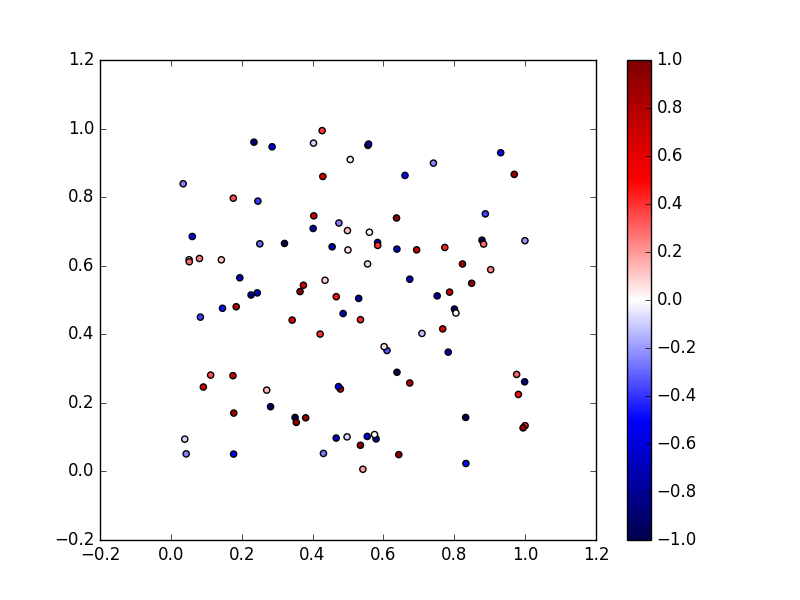
実行結果

demo.png

31
27
0

Register as a new user and use Qiita more conveniently

  1. You get articles that match your needs
  2. You can efficiently read back useful information
  3. You can use dark theme
What you can do with signing up
31
27

Delete article

Deleted articles cannot be recovered.

Draft of this article would be also deleted.

Are you sure you want to delete this article?