この記事は何?
pythonにはseabornというmatplotlibを元にした視覚化ライブラリがあります.
matplotlibは綺麗なグラフを描こうとすると少しメンドウですが,seabornを使うとパッと綺麗なグラフを描けるのでオススメです.
seabornには,グラフの文字サイズを設定するset_contextという関数が用意されています.
set_contextにpaper・notebook・talk・posterの4つのスタイルのうち1つを選んで引数に渡すことで,掲載媒体に合わせてグラフの文字サイズを変更することができます.
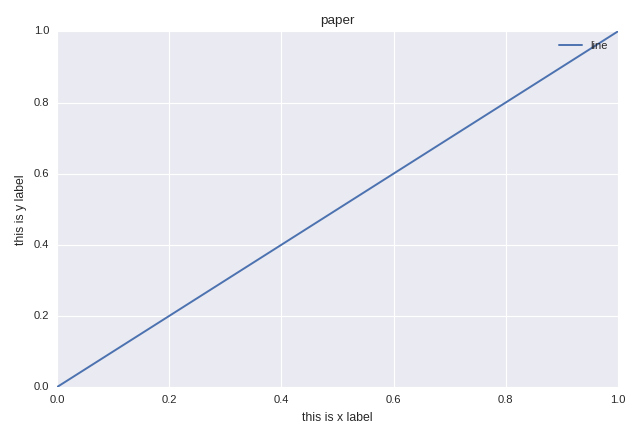
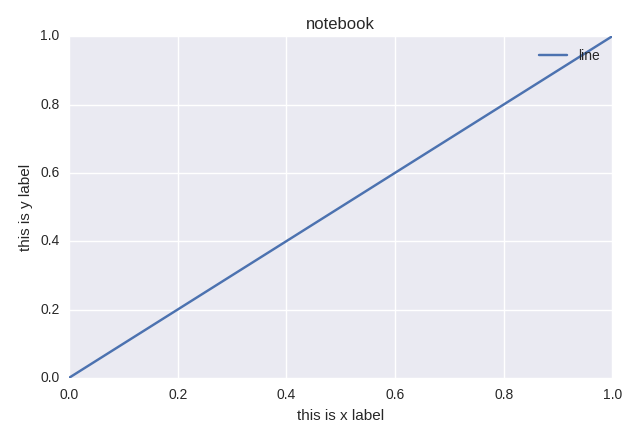
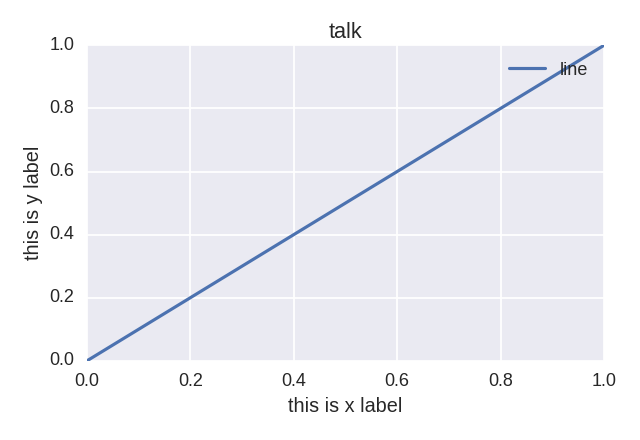
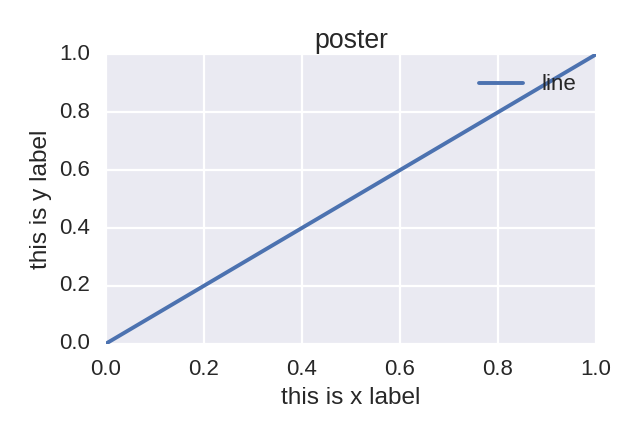
この記事はpaper・notebook・talk・posterのそれぞれをset_contextに渡したときの出力を比較したときのメモです.
4つのスタイルによる出力
paper
notebook
talk
poster
4つのスタイルの比較
文字サイズに関して,paper < notebook < talk < posterの順に大きくなります.
paperは非常に文字が小さいです.paperと言ってはいますが,これを論文誌に載せても文字が潰れて読めないんじゃないかなあと思います.
talkはどういった状況を想定しているのか名前だけでは分かりにくいですが,おそらくスライドに載せる状況を想定しているのだと思います.
しかし,スライドに載せるグラフは文字サイズを大きくしないと読みにくいので,スライドに載せる際もposterを選択した方が良いかもしれません.
ソースコード
import seaborn as sns
import matplotlib.pyplot as plt


def draw(context):
    sns.set_context(context)
    plt.clf()
    plt.plot([0, 1], [0, 1])
    plt.legend(["line"])
    plt.xlabel("this is x label")
    plt.ylabel("this is y label")
    plt.title(context)
    plt.tight_layout()
    plt.savefig(context + ".png")

if __name__ == '__main__':
    context_lst = ["paper", "notebook", "talk", "poster"]
    [draw(context) for context in context_lst]


