位相空間論の自習。
2次元空間のお話。
点$\mathbf{p}=(a, b)$ と $\mathbf{q}=(c, d)$ との距離というと、2点間の距離の公式を $d1(\mathbf{p},\mathbf{q})=\sqrt{(a-c)^2 + (b-d)^2}$ 連想すると思います。これは、 ユークリッド距離 と呼ばれる。
一方で、2次元空間の仲間でも、マンハッタン距離だとか、距離の概念は色々考えることができる。
背景を色々端折るが、ここでは、$d2(\mathbf{p},\mathbf{q})= |a-c| + |b-d|$ とユークリッド距離の特徴を比較してみた・・・という話。!
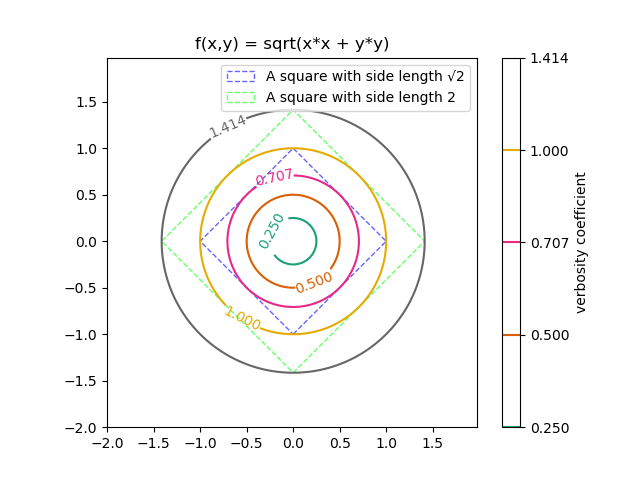
ユークリッド距離
$(a, b) = (0, 0)$ として、x-y座標にプロットしたもの。丸いのがそれ。
四角は比較用。
マンハッタン距離
$(a, b) = (0, 0)$ として、x-y座標にプロットしたもの。
1.000 の等高線に着目しても分かるが、 $d1(\mathbf{p},\mathbf{q}) < d2(\mathbf{p},\mathbf{q})$ である。縦横以外は、ユークリッド距離のほうが遠くに行ける・・・と捉えることもできる。
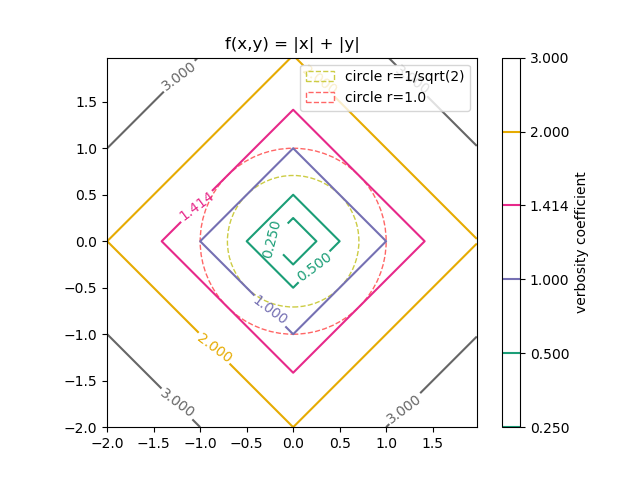
マンハッタン距離は、現実世界だと、ビル街を車で移動するときの距離に例えられますね。
数学的には、距離と空間は密接な関係があります。
先ほどのユークリッド距離とマンハッタン距離は、同じ二次元空間(つまり$(x,y)\in\mathbb{R}^2$) で存在するものかと問われれば、「まぁ、そうかな」と思うかもしれない。
ただ、距離空間の理解を深めてみようとするなら、2次元空間に、道、そして道でないもの(ビル)とが存在して、道でないものを取り除いた空間を考えてみるとよいかもしれない。そういう空間なら、最短距離がマンハッタン距離のように定義されうるかなと。
ユークリッド距離とマンハッタン距離の関係
$f(x,y) = \sqrt{ |x| |y| }$ を考える。(これも距離空間かどうかはとりあえず、おいておく。)
こんなグラフになる。いわゆる双曲線の亜種ですね。マンハッタン距離と違って、縦横方向には歩けど、歩けど、距離1.0000 にはたどり着かない。
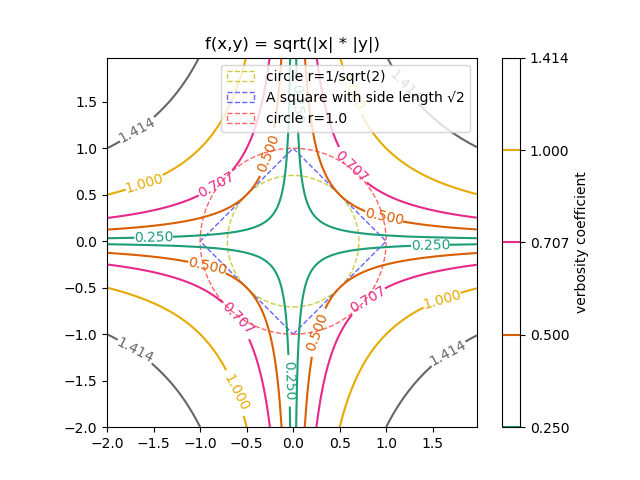
そして、この双曲線とユークリッド距離を足してみる。
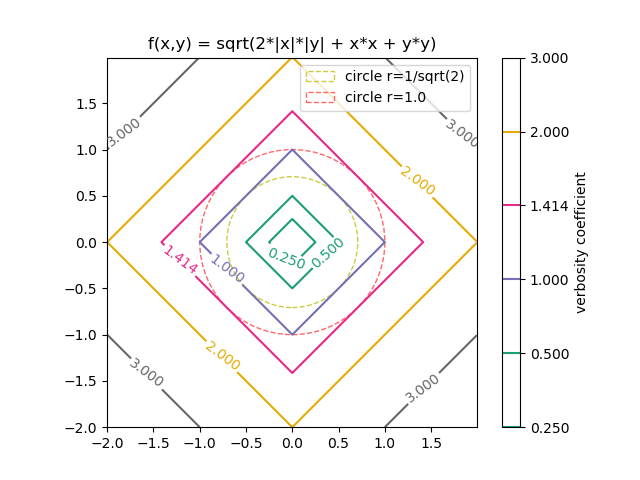
マンハッタン距離が出てきましたね。
ユークリッド距離とマンハッタン距離の関係の同値性を示す証明の一部の数式で、この足し算があって、「一体何を足したのだ?」と気になったのがグラフ化のきっかけでした。
参考
グラフに使ったコードの抜粋
import math
import numpy

import matplotlib.cm
import matplotlib
matplotlib.use('Agg')
import matplotlib.pyplot

def func_d4(x):
    """Func d1 + d2."""
    return numpy.sqrt(x[1:]*x[1:] + x[:-1]*x[:-1] + 2 * numpy.absolute(x[1:]) * numpy.absolute(x[:-1]))

def main():
    """main."""
    levels = [0, 0.25, 0.5, 1, math.sqrt(2), 2, 3]

    delta = 0.00625
    x_seq = numpy.arange(-2.0, 2.0, delta)
    y_seq = numpy.arange(-2.0, 2.0, delta)
    grid_x, grid_y = numpy.meshgrid(x_seq, y_seq)

    # Get Current Axis
    ax = matplotlib.pyplot.gca()

    # draw circle.
    circle_r1 = matplotlib.pyplot.Circle(
        (0, 0), 1, facecolor='none', edgecolor='#ff6666',
        linewidth=1.0, linestyle='dashed', label='r=1.0'
    )

    circle_r0 = matplotlib.pyplot.Circle(
        (0, 0), math.sqrt(2)/2, facecolor='none', edgecolor='#cccc44',
        linewidth=1.0, linestyle='dashed'
    )

    z = func_d4(
        numpy.vstack([grid_x.ravel(), grid_y.ravel()])).reshape(len(x_seq), len(y_seq))
    ax.set_aspect('equal', adjustable='box')
    cs_plot = matplotlib.pyplot.contour(
        grid_x, grid_y, z, levels,
        cmap=matplotlib.pyplot.cm.Dark2
    )
    matplotlib.pyplot.clabel(cs_plot, inline=1, fontsize=10)
    cbar = matplotlib.pyplot.colorbar(cs_plot)
    cbar.ax.set_ylabel('verbosity coefficient')
    matplotlib.pyplot.title('f(x,y) = sqrt(2*|x|*|y| + sqrt(x*x + y*y)')
    ax.add_patch(circle_r0)
    ax.add_patch(circle_r1)
    ax.legend(
        [circle_r0, circle_r1],
        ['circle r=1/sqrt(2)', 'circle r=1.0'])
    matplotlib.pyplot.savefig('matplotlib_plot_contour_d4.png')

if __name__ == '__main__':
    main()
続き
両者の距離空間の同値性の証明に挑戦。