Drawing Hasse diagram in Graphviz
There is also an opinion to do in TikZ.
𝕾3 - Symmetric group (order 6)
- 𝕾3(called S three)
- |𝕾3| = 3! = 6
- 𝕾3 is not a commutative group.
The multiplication table
| x_∘_y | e = () | f = (1 2 3) | g = (1 3 2) | p = (1 2) | q = (2 3) | r = (1 3) |
|---|---|---|---|---|---|---|
| e=() | e=() | f=(1 2 3) | g=(1 3 2) | p=(1 2) | q=(2 3) | r=(1 3) |
| f=(1 2 3) | f=(1 2 3) | g=(1 3 2) | e=() | r=(1 3) | p=(1 2) | q=(2 3) |
| g=(1 3 2) | g=(1 3 2) | e=() | f=(1 2 3) | q=(2 3) | r=(1 3) | p=(1 2) |
| p=(1 2) | p=(1 2) | q=(2 3) | r=(1 3) | e=() | f=(1 2 3) | g=(1 3 2) |
| q=(2 3) | q=(2 3) | r=(1 3) | p=(1 2) | g=(1 3 2) | e=() | f=(1 2 3) |
| r=(1 3) | r=(1 3) | p=(1 2) | q=(2 3) | f=(1 2 3) | g=(1 3 2) | e=() |
no adjusting
- Around {e} is something like a barrier (like the AT field). I would like to strip off such things.
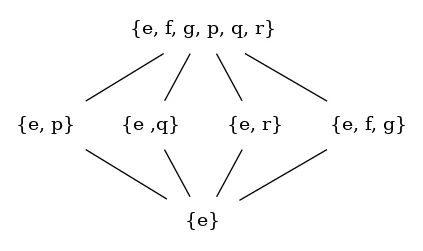
graph {
  layout = dot
  rankdir = TB
  node [ shape="none" ]

  G [label="{e, f, g, p, q, r}"]

  e_p [label="{e, p}"]
  e_q [label="{e ,q}"]
  e_r [label="{e, r}"]
  e_f_g [label="{e, f, g}"]
  { rank=same; e_p; e_q; e_r; e_f_g; }

  e [ label="{e}" ]

  G -- {e_p, e_q, e_r, e_f_g}
  {e_p, e_q, e_r, e_f_g} -- e
}
customize node size and spacing

- If
fixedsize = true, you can customize the nodewidthandheightparameters. - You can customize the margin between the upper and lower rank with the
ranksepparameter.
graph {
  layout = dot
  rankdir = TB
  graph [ pad="0.2", ranksep="0.4", nodesep="0.2", splines="line" ];
  node [ shape="none" ]

  G [
    label=<{<I>e</I>, <I>f</I>, <I>g</I>, <I>p</I>, <I>q</I>, <I>r</I>}>,
    fixedsize=true, width=1.75, height=0.25
  ]

  e_p [label=<{<I>e</I>, <I>p</I>}>, fixedsize=true, width=0.63, height=0.25]
  e_q [label=<{<I>e</I>, <I>q</I>}>, fixedsize=true, width=0.63, height=0.25]
  e_r [label=<{<I>e</I>, <I>r</I>}>, fixedsize=true, width=0.63, height=0.25]
  e_f_g [
    label=<{<I>e</I>, <I>f</I>, <I>g</I>}>,
    fixedsize=true, width=0.83, height=0.25
  ]
  { rank=same; e_p; e_q; e_r; e_f_g; }

  e [ label=<{<I>e</I>}>, fixedsize=true, width=0.35, height=0.25 ]

  G -- {e_p, e_q, e_r, e_f_g} [ headport=n, tailport=s ]
  {e_p, e_q, e_r, e_f_g} -- e [ headport=n, tailport=s ]
}
subgroup of 𝕾4 - Symmetric group (order 24)
𝕾4 = {e=(), f=(A B C D), g=(A C)(B D), h=(A D C B), i=(A C), j=(B D), k=(A B)(C D), l=(A D)(B C)}
|𝕾4|=4!=24

graph {
  layout = dot
  rankdir = TB
  graph [ pad="0.1", ranksep="0.4", nodesep="0.2", splines="line" ];
  node [ shape="none", fixedsize=true, width=1.1, height=0.25 ]

  G [ label=<<I>G</I>>, fixedsize=true, width=0.2, height=0.22 ]

  e_i_j_g [
    label=<{<I>e</I>, <I>g</I>, <I>i</I>, <I>j</I>}>,
    fixedsize=true, width=1.1, height=0.25
  ]
  e_f_g_h [
    label=<{<I>e</I>, <I>g</I>, <I>f</I>, <I>h</I>}>,
    fixedsize=true, width=1.15, height=0.25
  ]
  e_k_g_l [label=<{<I>e</I>, <I>g</I>, <I>k</I>, <I>l</I>}>,
    fixedsize=true, width=1.18, height=0.25
  ]
  { rank=same; e_i_j_g; e_f_g_h; e_k_g_l; }

  e_i [label=<{<I>e</I>, <I>i</I>}>, fixedsize=true, width=0.59, height=0.25]
  e_j [label=<{<I>e</I>, <I>j</I>}>, fixedsize=true, width=0.59, height=0.25]
  e_g [label=<{<I>e</I>, <I>g</I>}>, fixedsize=true, width=0.63, height=0.25]
  e_k [label=<{<I>e</I>, <I>k</I>}>, fixedsize=true, width=0.63, height=0.25]
  e_l [label=<{<I>e</I>, <I>l</I>}>, fixedsize=true, width=0.59, height=0.25]
  { rank=same; e_i; e_j; e_g; e_k; e_l; }

  e [ label=<{<I>e</I>}>, fixedsize=true, width=0.4, height=0.25 ]

  G -- {e_i_j_g, e_f_g_h, e_k_g_l}

  e_i_j_g -- {e_i, e_j, e_g}
  e_f_g_h -- {e_g}
  e_k_g_l -- {e_g, e_k, e_l}

  {e_i, e_j, e_g, e_k, e_l} -- e [tailport=s]
}
Mapping example
Software named Graphviz was born to automatically arrange nodes of graph structure. Inconsistent use of not automatically placing on it.
no adjusting
Oh my God. We do not want to change the order.
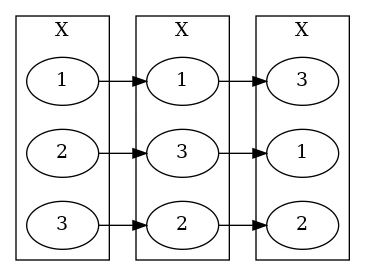
digraph {
  layout = dot
  rankdir = LR
  splines=true;
  subgraph cluster_0 {
    graph [ label=X ]
    s1 [label="1"]
    s2 [label="2"]
    s3 [label="3"]
  }
  subgraph cluster_1 {
    graph [ label=X ]
    t1 [label="1"]
    t2 [label="2"]
    t3 [label="3"]
  }
  subgraph cluster_2 {
    graph [ label=X ]
    d1 [label="1"]
    d2 [label="2"]
    d3 [label="3"]
  }

  s1 -> t1 -> d3
  s2 -> t3 -> d1
  s3 -> t2 -> d2
}
Arrange the order with constraint=false
By setting constraint = false, edge combination will not move the placement of nodes.
But, ...Perish them!
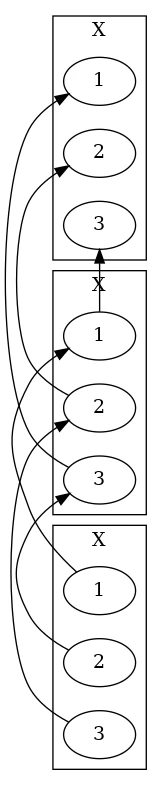
digraph {
  layout = dot
  rankdir = LR
  splines=true;
  // compound=true
  // graph [ newrank=true; ]
  subgraph cluster_0 {
    graph [ label=X ]
    s1 [label="1"]
    s2 [label="2"]
    s3 [label="3"]
    // { rank=same; s1; s2; s3; }
  }
  subgraph cluster_1 {
    graph [ label=X ]
    t1 [label="1"]
    t2 [label="2"]
    t3 [label="3"]
    // { rank=same; t1; t2; t3; }
  }
  subgraph cluster_2 {
    graph [ label=X ]
    d1 [label="1"]
    d2 [label="2"]
    d3 [label="3"]
    // { rank=same; d1; d2; d3; }
  }
  // s1 -> t1 -> d1[style=invis]

  s1 -> t1 -> d3 [constraint=false]
  s2 -> t3 -> d1 [constraint=false]
  s3 -> t2 -> d2 [constraint=false]
}
adjust rank
- If you adjust the rank in the cluster
rankdir = LRwill align vertically. - Adjust the order between clusters with
s1 -> t1 -> d1[style=invis]. - However, these oval in number like a pig has abundance of flesh. This is not beautiful. I would like to kill them after consultation.
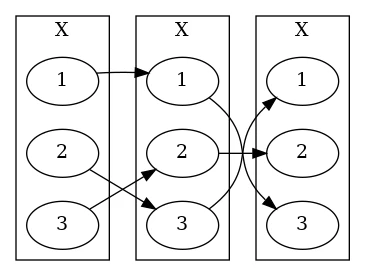
digraph {
  layout = dot
  rankdir = LR
  splines=true;
  compound=true
  graph [ newrank=true; ]
  subgraph cluster_0 {
    graph [ label=X ]
    s1 [label="1"]
    s2 [label="2"]
    s3 [label="3"]
    { rank=same; s1; s2; s3; }
  }
  subgraph cluster_1 {
    graph [ label=X ]
    t1 [label="1"]
    t2 [label="2"]
    t3 [label="3"]
    { rank=same; t1; t2; t3; }
  }
  subgraph cluster_2 {
    graph [ label=X ]
    d1 [label="1"]
    d2 [label="2"]
    d3 [label="3"]
    { rank=same; d1; d2; d3; }
  }
  s1 -> t1 -> d1[style=invis]

  s1 -> t1 -> d3 [constraint=false]
  s2 -> t3 -> d1 [constraint=false]
  s3 -> t2 -> d2 [constraint=false]
}
eden
- adjust size and set background color
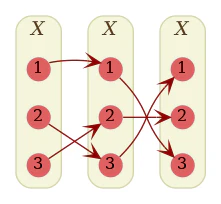
digraph {
  layout = dot
  rankdir = LR
  splines=true;
  node [
    shape=circle, style="filled,solid", fillcolor="#dd6060",
    width=0.25, fixedsize=true,
    color="#0d0ee0d",  # node border color (X11 or HTML colors)
    fontsize=12, fontcolor="black"
  ]
  edge [
    arrowhead=vee, color="#8b0000"
  ]
  subgraph cluster_0 {
    graph [
      label=<<I>X</I>>,fontcolor="#5A3A1A",
      style="filled,solid,rounded",shape="oval",
      fillcolor="#f5f5dc",color="#d5d5ac"
    ]
    s1 [label="1"]
    s2 [label="2"]
    s3 [label="3"]
    { rank=same; s1; s2; s3; }
  }
  subgraph cluster_1 {
    graph [
      label=<<I>X</I>>,fontcolor="#5A3A1A",
      style="filled,solid,rounded",shape="oval",
      fillcolor="#f5f5dc",color="#d5d5ac"
    ]
    t1 [label="1"]
    t2 [label="2"]
    t3 [label="3"]
    { rank=same; t1; t2; t3; }
  }
  subgraph cluster_2 {
    graph [
      label=<<I>X</I>>,fontcolor="#5A3A1A",
      style="filled,solid,rounded",shape="oval",
      fillcolor="#f5f5dc",color="#d5d5ac"
    ]
    d1 [label="1"]
    d2 [label="2"]
    d3 [label="3"]
    { rank=same; d1; d2; d3; }
  }
  s1 -> t1 -> d1[style=invis]

  s1 -> t1 -> d3 [constraint=false]
  s2 -> t3 -> d1 [constraint=false]
  s3 -> t2 -> d2 [constraint=false]
}