この記事はSplunk Advent Calendar 2023 18日目です。
11日目にこんな記事を書いてます。
実際にこれで色々データ拾ってみたよ、というお話が本日です。
ネットワーク通信遅い問題
ありますよね。
自分のPCもそうですし、PC管理者の人がユーザーから「遅いんだけど!」と問い合わせもらったときにどう調査したらいいか、何かしらの調査ツールが必要だったり、なかなか悩みどころかと思います。
Splunkで結構データ取れます
UFでAdd-onだったりコマンドプロンプトを使って結構取れます。
Add-on系
-
Splunk Add-on for Microsoft Windows
WinNetMon (Windows Network Monitor) でネットワークアクティビティが取れます。これで、PCからどこ宛ての通信を行っているか可視化できます。
inputs.confで以下のようにすればOK。
[WinNetMon://inbound]
direction = inbound
disabled = 0

[WinNetMon://outbound]
direction = outbound
disabled = 0
通信状況を全て取得するのでPCへの負荷が高かったり、データサイズが大きいので注意。詳細はこちら。
また、WifiアダプタのイベントをWindows Eventから取得するには以下。
[WinEventLog://Microsoft-Windows-WLAN-AutoConfig/Operational]
disabled = 0
start_from = oldest
current_only = 0
checkpointInterval = 5
renderXml=true
-
Speedtest Addon for Windows
Speedtest.netが提供しているコマンドを実行し、Download/Upload速度をチェックできます。
このAdd-onを解凍すれば分かりますが、speedtest_ta_windows\binにspeedtest.exeがぽつんと置いてあり、inputs.confでこのように指定しています。
[script://.\bin\speedtest.exe --format=json --accept-license --accept-gdpr]
interval = 0 */1 * * *
index = speedtest
disable = false
これでコマンドプロンプトでexe実行した標準出力結果をSplunkに送れるんですね。
コマンドプロンプト系
- Wifi通信状況
以下コマンドを実行すればWifiのシグナル強度、受信/送信速度(Mbps)が取得できます。
netsh wlan show interfaces
適当なバッチファイルを.\binに作って
@echo off
chcp 65001 >nul
netsh wlan show interfaces
inputs.confで呼び出せばOKです。
[script://.\bin\wifi.bat]
interval = 60
sourcetype = wifi
disabled = 0
-
ファイルダウンロードテスト
speedtestはちょっと負荷的に重い場合、OVHCloudなどが提供しているダウンロードテスト用ファイルを使わせてもらうのも手です。
curlしつついい感じに整形します。
curl -s -o NUL -w "Download speed: %{speed_download} bytes/sec\nTotal time: %{time_total} seconds" https://proof.ovh.net/files/1Mb.dat -
tracert
昔ながらの方法。途中経路で遅延が大きい個所がないか確認します。
tracert /4 www.google.com
ダッシュボード作ってみた
後は取得できたデータを可視化するだけです。
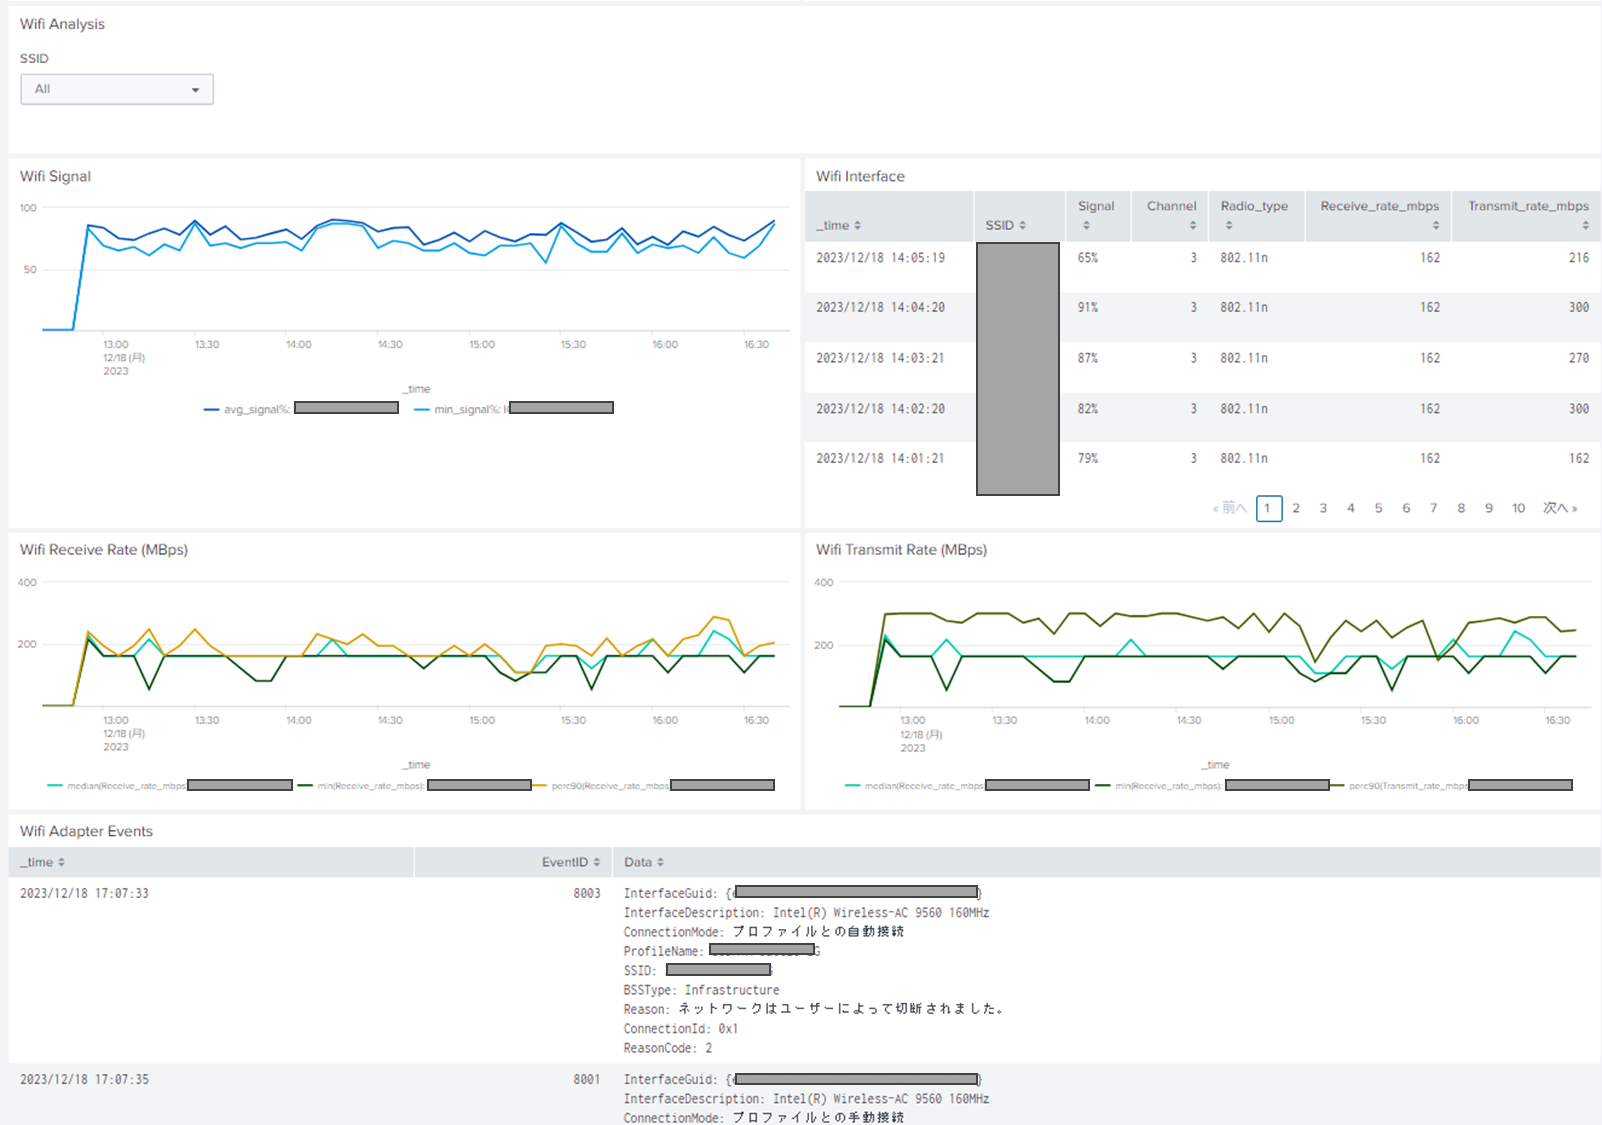
例えばこんな感じです。
なんか遅いなーと思ったとき、シグナル強度が弱かったり、強度は問題ないけどWifiルーター側のスループットが悪かったりとか、理由が分かるようになって面白いです。
まとめ
UF使ってコマンドプロンプトとかPowershellの実行結果も取れるんだよ!の一つのお話でした。
色々情報取れるUF&結果を雑に投げても加工・統計処理できるSplunkであれば、活用の幅はめちゃくちゃ広いですね。


