概要
Azure Functionsで、プログラム中で仕込んだログを参照するのに手こずってしまったので、自分のメモがてら共有します。
Azure Portalからは、直近20件の実行分までは簡単に参照できるのですが、それより古い分はApplication Insightsを利用する必要があったのです。KQLとか、書き方がわからず困惑しました![]()
ログを仕込む方法
(私はJavaでAzure Functionsを書く事が多いので、Javaの例のみとさせてください)
Functionsの入り口となるメソッドでは、ExecutionContextというクラスの引数を受け取れるようになっているので、ここからLoggerを取得する事ができます。
↓メソッド引数でExecutionContextを受け取る
    @FunctionName("HttpTrigger-Java")
    public HttpResponseMessage run(
            @HttpTrigger(name = "req", methods = {HttpMethod.GET, HttpMethod.POST}, authLevel = AuthorizationLevel.FUNCTION) HttpRequestMessage<Optional<String>> request,
            final ExecutionContext context) throws UnsupportedEncodingException, InvalidKeyException, NoSuchAlgorithmException, SystemException {
context.getLogger()でjava.util.logging.Loggerが取得できるので、これを使ってログを出力する事ができます。
context.getLogger().info("Java HTTP trigger processed a request.");
直近20件の実行分は「モニター」から参照できる
Azure Portalの「モニター」機能では、直近20件までの実行結果を簡単に確認する事ができます。
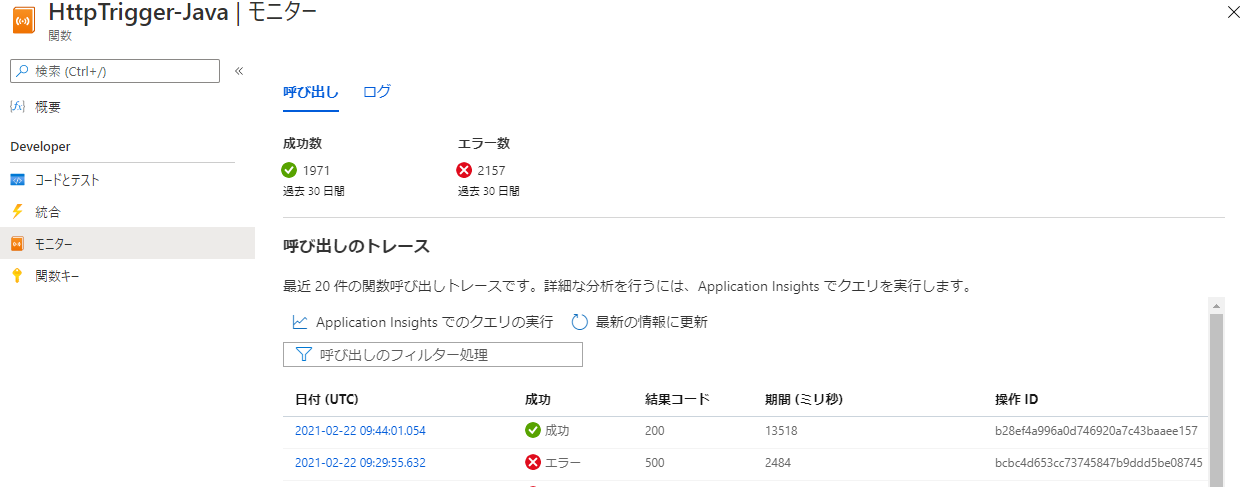
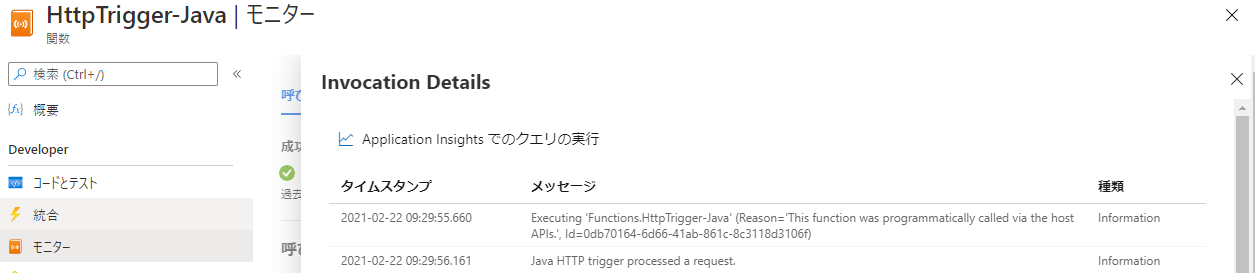
ここから、「日付」欄のリンクをクリックすると、仕込んだログを見る事ができます。
この20件より古い実行結果についてログを見るには、Application Insghtsを使用する事になります。
Application Insightsでログを見るには
Application Insightでは、「KQL」というクエリ言語で様々な情報を参照する事ができます。
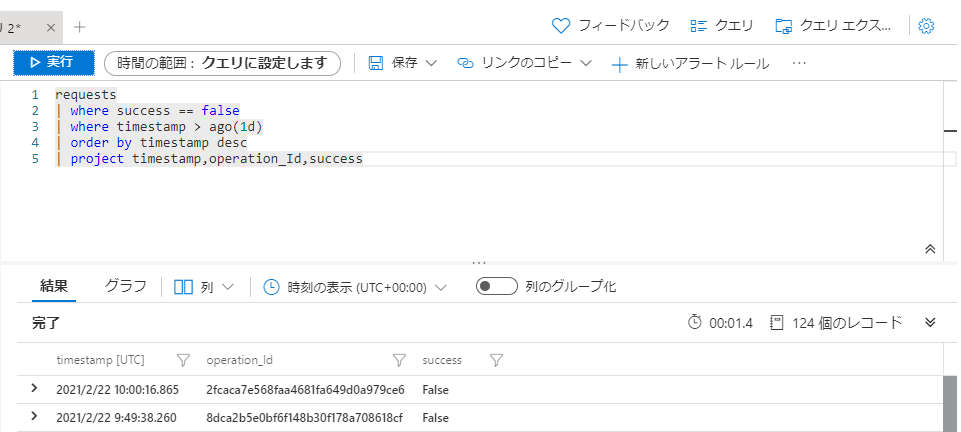
例えば、下記のクエリで、直近3日で異常終了したアプリの情報を見る事ができます。
(この例だと、Azure Functions以外のアプリケーションについても出てきてしまうと思うので、その場合はappNameの条件で絞る等試してみてください)
requests
| where success == false
| where timestamp > ago(3d)
| order by timestamp desc
| project timestamp,operation_Id,success
詳しい解説はしませんが、SQLが書ける人なら、だいたいどんな事がしたいかわかると思います。
Ctrl + spaceで、項目や条件を追加できるので、ログを参照したい実行結果を探してみてください。
(whereの所には条件を、projectの所には参照項目を追加する感じです。)
特定できたら、KQLの結果からoperation_Idをコピーして、今度は下記のようなKQLを実行します。
operation_Id ==の所に、コピーしたoperation_Idを貼り付けてください。
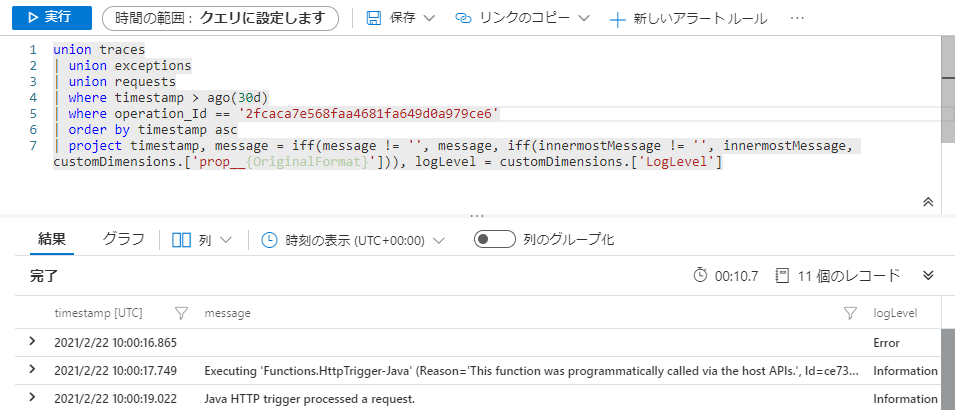
union traces
| union exceptions
| union requests
| where timestamp > ago(3d)
| where operation_Id == '17d736d3896baa4a893e2c3f46103a52'
| order by timestamp asc
| project timestamp, message = iff(message != '', message, iff(innermostMessage != '', innermostMessage, customDimensions.['prop__{OriginalFormat}'])), logLevel = customDimensions.['LogLevel']
無事、「モニター」で見るのと同じログを見る事ができました。
慣れてきたら、下記のKQLでも良いと思います。
複数回の実行結果分をまとめて見る事もできます。
requests
| where success == false
| where timestamp > ago(3d)
| join kind=inner (
traces
|where timestamp > ago(5d)
) on operation_Id
| union exceptions
| order by timestamp desc
| project timestamp, message = iff(message != '', message, iff(innermostMessage != '', innermostMessage, customDimensions.['prop__{OriginalFormat}'])), logLevel = customDimensions.['LogLevel'],success,operation_Id