Bokehとは
Bokeh はビジュアリゼーション用Pythonライブラリです。
類似するライブラリはいくつかありますが、Bokehは インタラクティブ な点が大きな特徴です。デフォルトのまま適当に使っても拡大縮小やエクスポートなどの機能が動的に使えるような出力が得られ、カスタマイズによる機能追加等も柔軟に行なえます。(その代わりJavaScriptが動く環境でないと真価を発揮できず、画像を吐き出すだけの別ライブラリのほうが取り回しが良いケースもあると思います)
ライブラリのインターフェース自体も使いやすく、個人的に好きなライブラリです。
環境
- Google Colaboratory
- Python 3.7.13
- Bokeh 2.4.3
Bokehで散布図をつくる
サンプルデータの準備
Bokehに付属しているペンギンデータセットを使って、まずは普通の散布図を描く準備をします。
from bokeh.plotting import figure, show, output_notebook
from bokeh.models import ColumnDataSource, Label, LabelSet, Button, CustomJS
from bokeh.layouts import column

from bokeh.sampledata.penguins import data
output_notebook()
dataに入っているデータを確認します。欠損が含まれるので、まずは削除しておきます。
data = data.dropna()
中を覗いてみます。
data.head()
| index | species | island | bill_length_mm | bill_depth_mm | flipper_length_mm | body_mass_g | sex |
|---|---|---|---|---|---|---|---|
| 0 | Adelie | Torgersen | 39.1 | 18.7 | 181.0 | 3750.0 | MALE |
| 1 | Adelie | Torgersen | 39.5 | 17.4 | 186.0 | 3800.0 | FEMALE |
| 2 | Adelie | Torgersen | 40.3 | 18.0 | 195.0 | 3250.0 | FEMALE |
| 4 | Adelie | Torgersen | 36.7 | 19.3 | 193.0 | 3450.0 | FEMALE |
| 5 | Adelie | Torgersen | 39.3 | 20.6 | 190.0 | 3650.0 | MALE |
speciesは、Adelie・Chinstrap・Gentooの3種類のカテゴリ値になっています。
data["species"].unique()
> array(['Adelie', 'Chinstrap', 'Gentoo'], dtype=object)
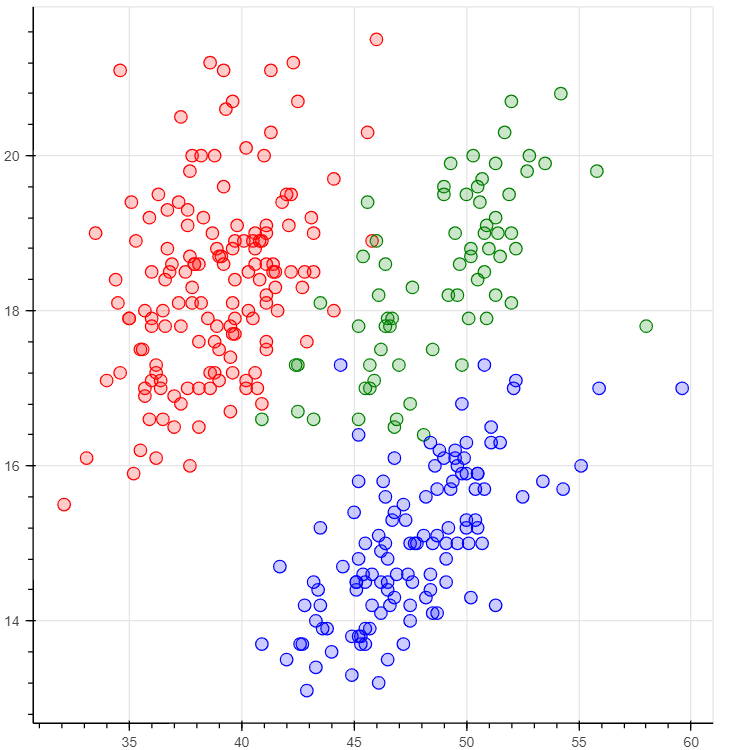
X軸にbill_length_mm、Y軸にbill_depth_mmを取り、3種類のspeciesを色分けして表示する散布図を描いてみます。
データを前処理して、
x = data["bill_length_mm"]
y = data["bill_depth_mm"]
colors = [{"Adelie": "red", "Chinstrap": "green", "Gentoo": "blue"}[r] for r in data["species"]]
実際の表示するコードは下記です。
p = figure()
p.circle(x, y, color=colors, fill_alpha=0.2, size=10)

show(p)

ツールチップで値を表示
Bokehにはtooltipsという機能があり、カーソルを当てると小さいウィンドウが出てきて好きな値を表示するようにできます。ここでは@colorsのような特殊な記法で変数の値を表示できます。
参考: First steps 4: Customizing your plot — Bokeh 2.4.3 Documentation
TOOLTIPS = [
    ("index", "$index"),
    ("(x,y)", "($x, $y)"),
    ("desc", "色は@colors"),
]
p = figure(tooltips=TOOLTIPS)
source = ColumnDataSource(data={'x_values': x, 'y_values': y, 'colors': colors})

p.circle(source=source, x="x_values", y="y_values", color="colors", fill_alpha=0.2, size=10)

show(p)

ラベルを表示
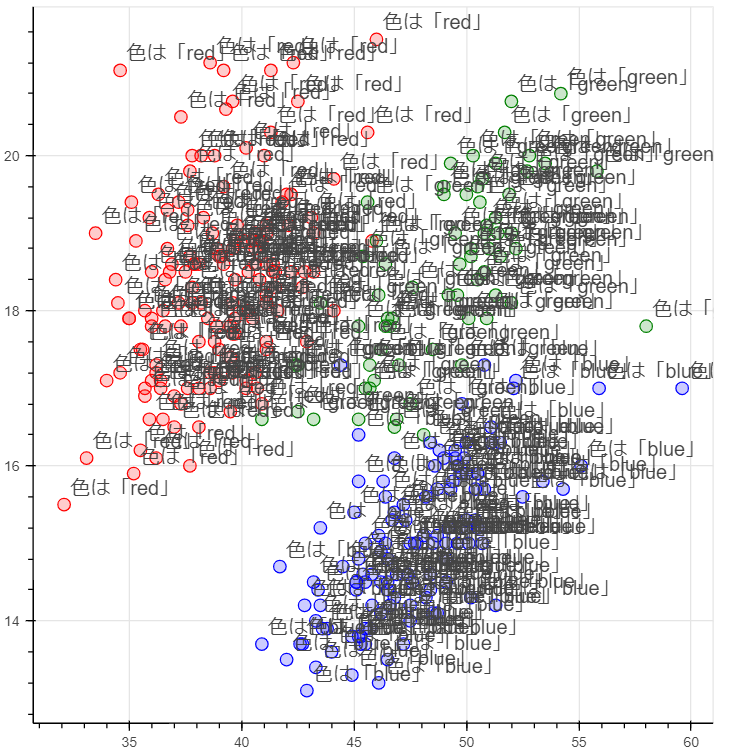
ツールチップはカーソルを当てた値しか表示できません。LabelSetを使って、すべての値のラベルを表示するようにしてみます。
参考: annotations — Bokeh 2.4.3 Documentation
p = figure()

source = ColumnDataSource(data={'x_values': x, 'y_values': y, 'colors': colors, '色': [ f"色は「{c}」" for c in colors ] })
labels = LabelSet(x='x_values', y='y_values', text='色', x_offset=5, y_offset=5, source=source, render_mode='canvas')
p.add_layout(labels)

p.circle(source=source, x="x_values", y="y_values", color="colors", fill_alpha=0.2, size=10)

show(p)

大変なことになってしまいました。
ラベルの表示・非表示を、好きなタイミングで動的に切り替えられるようにしましょう。
Bokehにはインタラクティブなウィジェットを追加し、JavaScriptで挙動を制御できます。
参考: Adding widgets — Bokeh 2.4.3 Documentation
p = figure()

source = ColumnDataSource(data={'x_values': x, 'y_values': y, 'colors': colors, '色': [ f"色は「{c}」" for c in colors ] })
labels = LabelSet(x='x_values', y='y_values', text='色', x_offset=5, y_offset=5, source=source, render_mode='canvas')
p.add_layout(labels)

p.circle(source=source, x="x_values", y="y_values", color="colors", fill_alpha=0.2, size=10)

button = Button(label="ラベルかくす")
button.js_on_click(CustomJS(args=dict(labels=labels), code="labels.visible = !labels.visible;"))

show(column(p, button))

