最近、ELB(Application Load Balancer)のアクセスログを有効化し、問題が発生した際にアプリケーションの挙動を迅速に分析できるようにしました。S3に保存されるログを効率的に扱うために、Athenaを使用して専用のデータベースとテーブルを設定し、分析用のクエリを整理しました。
Athenaの設定
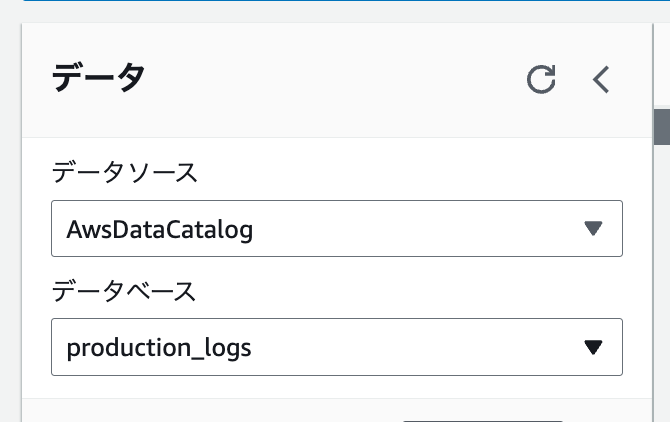
データベースの作成
Athenaのクエリエディタを開き、以下のコマンドでログ用のデータベースを作成します。
CREATE DATABASE IF NOT EXISTS production_logs;
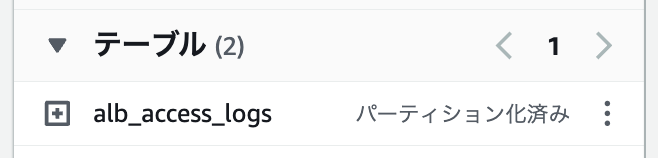
テーブルの作成
ドキュメント「パーティション射影を使用したALBアクセスログ用テーブルの作成」を参考にして、テーブルを設定します。日毎のパーティションを設けることで、クエリのパフォーマンスを向上させ、S3に新しく追加されたログが自動的にテーブルに取り込まれます。
CREATE EXTERNAL TABLE IF NOT EXISTS alb_access_logs (
            type string,
            time string,
            elb string,
            client_ip string,
            client_port int,
            target_ip string,
            target_port int,
            request_processing_time double,
            target_processing_time double,
            response_processing_time double,
            elb_status_code int,
            target_status_code string,
            received_bytes bigint,
            sent_bytes bigint,
            request_verb string,
            request_url string,
            request_proto string,
            user_agent string,
            ssl_cipher string,
            ssl_protocol string,
            target_group_arn string,
            trace_id string,
            domain_name string,
            chosen_cert_arn string,
            matched_rule_priority string,
            request_creation_time string,
            actions_executed string,
            redirect_url string,
            lambda_error_reason string,
            target_port_list string,
            target_status_code_list string,
            classification string,
            classification_reason string,
            conn_trace_id string
            )
            PARTITIONED BY
            (
             day STRING
            )
            ROW FORMAT SERDE 'org.apache.hadoop.hive.serde2.RegexSerDe'
            WITH SERDEPROPERTIES (
            'serialization.format' = '1',
            'input.regex' =
        '([^ ]*) ([^ ]*) ([^ ]*) ([^ ]*):([0-9]*) ([^ ]*)[:-]([0-9]*) ([-.0-9]*) ([-.0-9]*) ([-.0-9]*) (|[-0-9]*) (-|[-0-9]*) ([-0-9]*) ([-0-9]*) \"([^ ]*) (.*) (- |[^ ]*)\" \"([^\"]*)\" ([A-Z0-9-_]+) ([A-Za-z0-9.-]*) ([^ ]*) \"([^\"]*)\" \"([^\"]*)\" \"([^\"]*)\" ([-.0-9]*) ([^ ]*) \"([^\"]*)\" \"([^\"]*)\" \"([^ ]*)\" \"([^\\s]+?)\" \"([^\\s]+)\" \"([^ ]*)\" \"([^ ]*)\" ?([^ ]*)?( .*)?'
            )
            LOCATION 's3://DOC-EXAMPLE-BUCKET/AWSLogs/<ACCOUNT-NUMBER>/elasticloadbalancing/<REGION>/'
            TBLPROPERTIES
            (
             "projection.enabled" = "true",
             "projection.day.type" = "date",
             "projection.day.range" = "2022/01/01,NOW",
             "projection.day.format" = "yyyy/MM/dd",
             "projection.day.interval" = "1",
             "projection.day.interval.unit" = "DAYS",
             "storage.location.template" = "s3://DOC-EXAMPLE-BUCKET/AWSLogs/<ACCOUNT-NUMBER>/elasticloadbalancing/<REGION>/${day}"
            )
トラブルシューティングに使えそうなクエリ
問題が起こったときに頻繁に利用できそうなクエリをまとめました。
-
most_frequently_accessed_endpoints: 最もアクセスされたエンドポイントの確認
SELECT request_url, COUNT(*) AS request_count
FROM "alb_access_logs"
GROUP BY request_url
ORDER BY request_count DESC
LIMIT 100;
-
longest_average_response_time_endpoints: 応答時間が長いエンドポイントの特定
SELECT request_url, AVG(response_processing_time) AS avg_response_time
FROM "alb_access_logs"
GROUP BY request_url
ORDER BY avg_response_time DESC
LIMIT 100;
-
request_count_by_hour: 時間帯別のリクエスト数
SELECT
    date_trunc('hour', date_add('hour', 9, parse_datetime(time, 'yyyy-MM-dd''T''HH:mm:ss.SSSSSSZ'))) AS hour_jst,
    COUNT(*) AS request_count
FROM "alb_access_logs"
WHERE
    parse_datetime(time, 'yyyy-MM-dd''T''HH:mm:ss.SSSSSSZ') BETWEEN timestamp '2024-08-13 00:00:00.000' AND timestamp '2024-08-14 00:00:00.000'
GROUP BY
    date_trunc('hour', date_add('hour', 9, parse_datetime(time, 'yyyy-MM-dd''T''HH:mm:ss.SSSSSSZ')))
ORDER BY hour_jst;
-
analysis_of_abnormal_status_codes: ステータスコード別のリクエスト数
SELECT elb_status_code, COUNT(*) AS status_count
FROM "alb_access_logs"
GROUP BY elb_status_code
ORDER BY status_count DESC;
-
request_analysis_by_client_ip: クライアントIPアドレス別のリクエスト数
SELECT COUNT(request_verb) AS
 count,
 request_verb,
 client_ip
FROM "alb_access_logs"
GROUP BY request_verb, client_ip
LIMIT 100;
参考