scipy で正規分布に従うランダムデータの作り方
連続確率分布
Uniform Distribution(一様分布)
一様分布はscipy.stats.uniformを使う。
確率密度分布
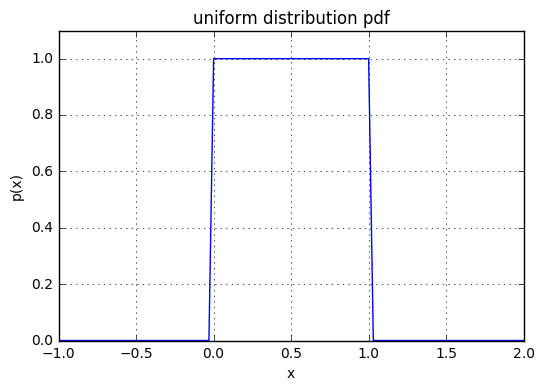
pdfで何もParameterを指定しない場合は、区間が[0,1]になる。
fig = plt.figure()
ax = fig.add_subplot(111)
x = np.linspace(-1,7,100)
ax.plot(x,scipy.stats.uniform.pdf(x,loc=0, scale=1), label='loc=0')
ax.plot(x,scipy.stats.uniform.pdf(x,loc=2, scale=1), label='loc=2')
ax.plot(x,scipy.stats.uniform.pdf(x,loc=5, scale=1), label='loc=5')
ax.set_xlabel('x')
ax.set_ylabel('p(x)')
ax.set_ylim(0,1.1)
ax.grid(True)
ax.legend(loc='best',frameon=False)
ax.set_title('uniform distribution pdf')
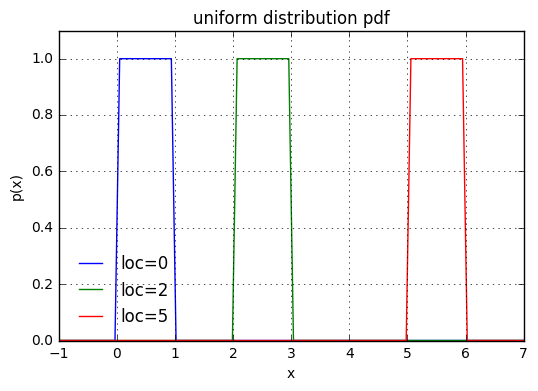
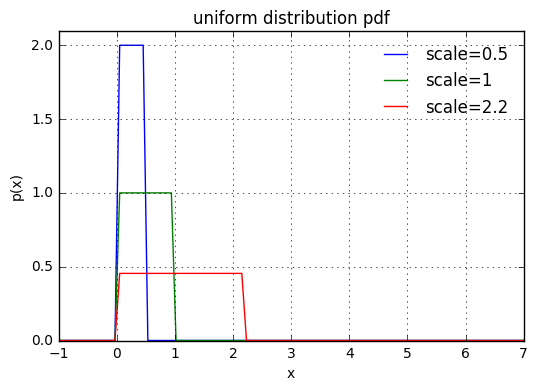
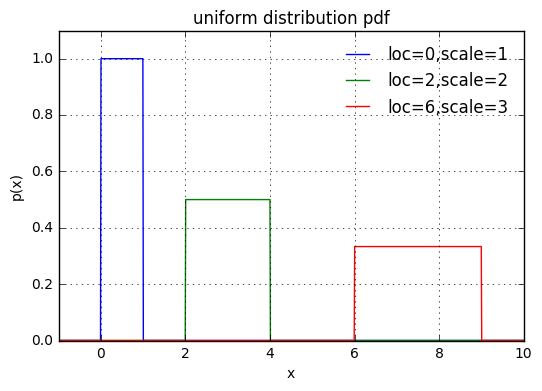
位置と区間はloc,scaleで指定する。loc, scaleを指定すると区間[loc, loc+scale]で確率が一定になり、pdfにより出力される値は1/scaleになる。
fig = plt.figure()
ax = fig.add_subplot(111)
x = np.linspace(-1,7,100)
ax.plot(x,scipy.stats.uniform.pdf(x,loc=0, scale=1), label='loc=0')
ax.plot(x,scipy.stats.uniform.pdf(x,loc=2, scale=1), label='loc=2')
ax.plot(x,scipy.stats.uniform.pdf(x,loc=5, scale=1), label='loc=5')
ax.set_xlabel('x')
ax.set_ylabel('p(x)')
ax.set_ylim(0,1.1)
ax.grid(True)
ax.legend(loc='best',frameon=False)
ax.set_title('uniform distribution pdf')
fig = plt.figure()
ax = fig.add_subplot(111)
x = np.linspace(-1,7,100)
ax.plot(x,scipy.stats.uniform.pdf(x,scale=0.5), label='scale=0.5')
ax.plot(x,scipy.stats.uniform.pdf(x,scale=1), label='scale=1')
ax.plot(x,scipy.stats.uniform.pdf(x,scale=2.2), label='scale=2.2')
ax.set_xlabel('x')
ax.set_ylabel('p(x)')
ax.set_ylim(0,2.1)
ax.grid(True)
ax.legend(loc='best',frameon=False)
ax.set_title('uniform distribution pdf')
fig = plt.figure()
ax = fig.add_subplot(111)
x = np.linspace(-1,10,1000)
ax.plot(x,scipy.stats.uniform.pdf(x,loc=0, scale=1), label='loc=0,scale=1')
ax.plot(x,scipy.stats.uniform.pdf(x,loc=2, scale=2), label='loc=2,scale=2')
ax.plot(x,scipy.stats.uniform.pdf(x,loc=6, scale=3), label='loc=6,scale=3')
ax.set_xlabel('x')
ax.set_ylabel('p(x)')
ax.set_ylim(0,1.1)
ax.set_xlim(-1,10)
ax.grid(True)
ax.legend(loc='best',frameon=False)
ax.set_title('uniform distribution pdf')
ランダムデータのサンプリング
一様分布に従うランダムデータはrvsを使って取得する。pdf同様何も指定しないと区間[0,1]の値になる。区間の変更は、pdfと同様にパラメータloc, scaleを使用する。複数データを取得したいときはパラメータsizeを指定する。
下図は実際にサンプリングしたデータを使って作成したヒストグラムと確率密度分布をグラフにしたもの。
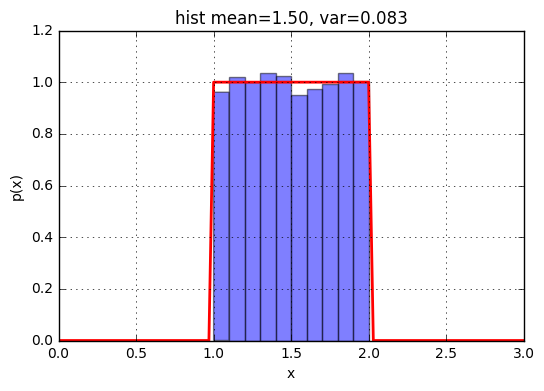
xs = scipy.stats.uniform.rvs(loc=1,scale=1,size=10000)
x = np.linspace(0,3,100)
p = scipy.stats.uniform.pdf(x,loc=1,scale=1)
v = np.var(xs)
m = np.mean(xs)
fig = plt.figure()
ax = fig.add_subplot(111)
ax.hist(xs, bins=10, alpha=0.5, normed=True)
ax.plot(x,p, 'r-', lw=2)
ax.set_xlabel('x')
ax.set_ylabel('p(x)')
ax.set_title('hist mean=%.2f, var=%.3f' % (m,v))
ax.grid(True)
Normal Distribution(Gauss分布)
一次元Gauss分布
一次元の時はscipy.stats.normを使う。
PDFの式は下記のようになる。
p(x)=\frac{1}{\sqrt{2\pi}\sigma}\exp\left(-\frac{1}{2\sigma^2}(x-\mu)^{2}\right)
確率密度分布
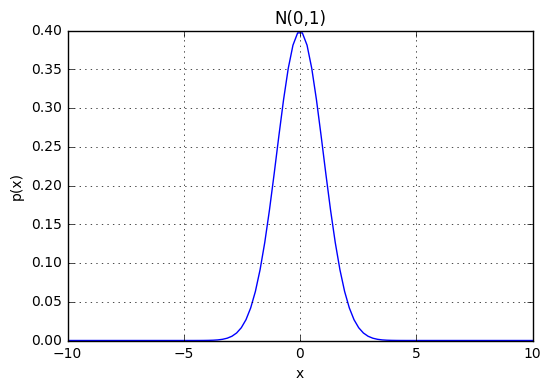
確率密度分布の値はpdfを使って取得する。パラメータを指定しないと平均0, 分散1の結果N(0,1)になる。
x = np.linspace(-10,10,100)
p = scipy.stats.norm.pdf(x)
fig = plt.figure()
ax = fig.add_subplot(111)
ax.plot(x, p)
ax.set_xlabel('x')
ax.set_ylabel('p(x)')
ax.set_title('N(0,1)')
ax.grid(True)
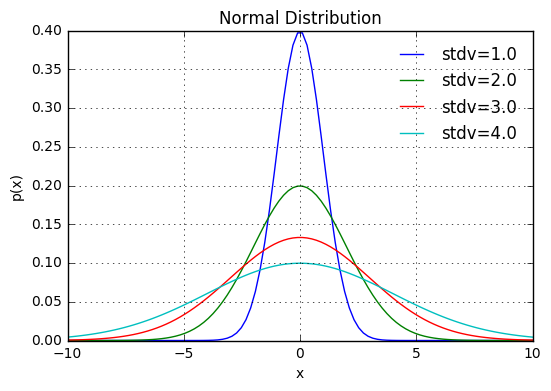
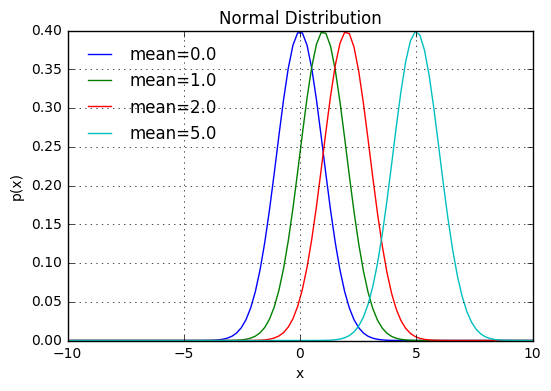
平均と標準偏差(分散)はパラメータloc, scaleで指定する。
標準偏差を変えた例
x = np.linspace(-10,10,100)
stdvs = [1.0, 2.0, 3.0, 4.0]
fig = plt.figure()
ax = fig.add_subplot(111)

for s in stdvs:
    ax.plot(x, scipy.stats.norm.pdf(x,scale=s), label='stdv=%.1f' % s)
ax.set_xlabel('x')
ax.set_ylabel('p(x)')
ax.set_title('Normal Distribution')
ax.legend(loc='best', frameon=False)
ax.grid(True)
平均を変えた例
x = np.linspace(-10,10,100)
mus = [0.0, 1.0, 2.0, 5.0]
fig = plt.figure()
ax = fig.add_subplot(111)

for mu in mus:
    ax.plot(x, scipy.stats.norm.pdf(x,loc=mu), label='mean=%.1f' % mu)
ax.set_xlabel('x')
ax.set_ylabel('p(x)')
ax.set_title('Normal Distribution')
ax.legend(loc='best', frameon=False)
ax.grid(True)
ランダムデータのサンプリング
正規分布に従うランダムデータはrvsを使って取得する。pdf同様何も指定しないとN(0,1)の値になる。平均と標準偏差の指定は、pdfと同様にパラメータloc, scaleを使用する。複数データを取得したいときはパラメータsizeを指定する。
下図は実際にサンプリングしたデータを使って作成したヒストグラムと確率密度分布をグラフにしたもの。
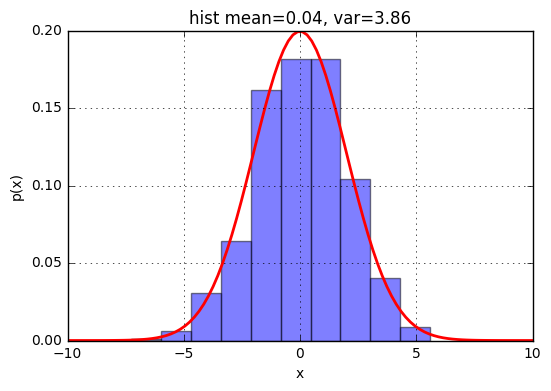
xs = scipy.stats.norm.rvs(scale=2,size=1000)
x = np.linspace(-10,10,100)
p = scipy.stats.norm.pdf(x,scale=2)
v = np.var(xs)
m = np.mean(xs)
fig = plt.figure()
ax = fig.add_subplot(111)
ax.hist(xs, bins=10, alpha=0.5, normed=True)
ax.plot(x,p, 'r-', lw=2)
ax.set_xlabel('x')
ax.set_ylabel('p(x)')
ax.set_title('hist mean=%.2f, var=%.2f' % (m,v))
ax.grid(True)
多次元Gauss分布
多次元の時はscipy.stats.multivariate_normalを使う。
PDFの式は下記のようになる。
p(x)=\frac{1}{(2\pi)^{D/2}|\Sigma|}\exp\left(-\frac{1}{2}(x-\mu)^T\Sigma^{-1}(x-\mu)\right)
確率密度分布
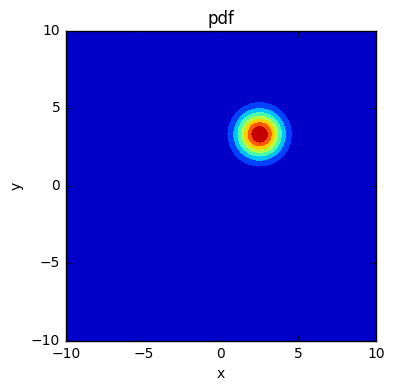
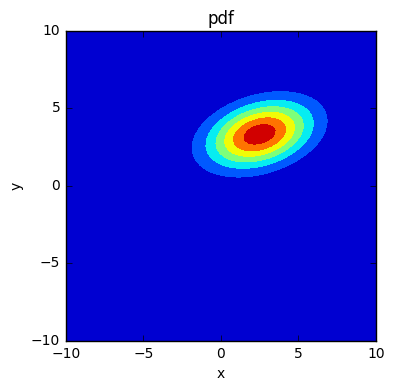
確率密度分布はpdfを使って取得する。
x,y = np.meshgrid(np.linspace(-10,10,100),np.linspace(-10,10,100))
pos = np.dstack((x,y))
mean = np.array([2.5, 3.3])
cov  = np.array([[1.0,0.0],[0.0,1.0]])
z = scipy.stats.multivariate_normal(mean,cov).pdf(pos)

fig = plt.figure()
ax = fig.add_subplot(111,aspect='equal')
ax.contourf(x,y,z)
ax.set_xlim(-10,10)
ax.set_ylim(-10,10)
ax.set_xlabel('x')
ax.set_ylabel('y')
ax.set_title('pdf')
x,y = np.meshgrid(np.linspace(-10,10,100),np.linspace(-10,10,100))
pos = np.dstack((x,y))
mean = np.array([2.5, 3.3])
cov  = np.array([[5.0,1.0],[1.0,2.0]])
z = scipy.stats.multivariate_normal(mean,cov).pdf(pos)

fig = plt.figure()
ax = fig.add_subplot(111,aspect='equal')
ax.contourf(x,y,z)
ax.set_xlim(-10,10)
ax.set_ylim(-10,10)
ax.set_xlabel('x')
ax.set_ylabel('y')
ax.set_title('pdf')
3次元Gauss分布
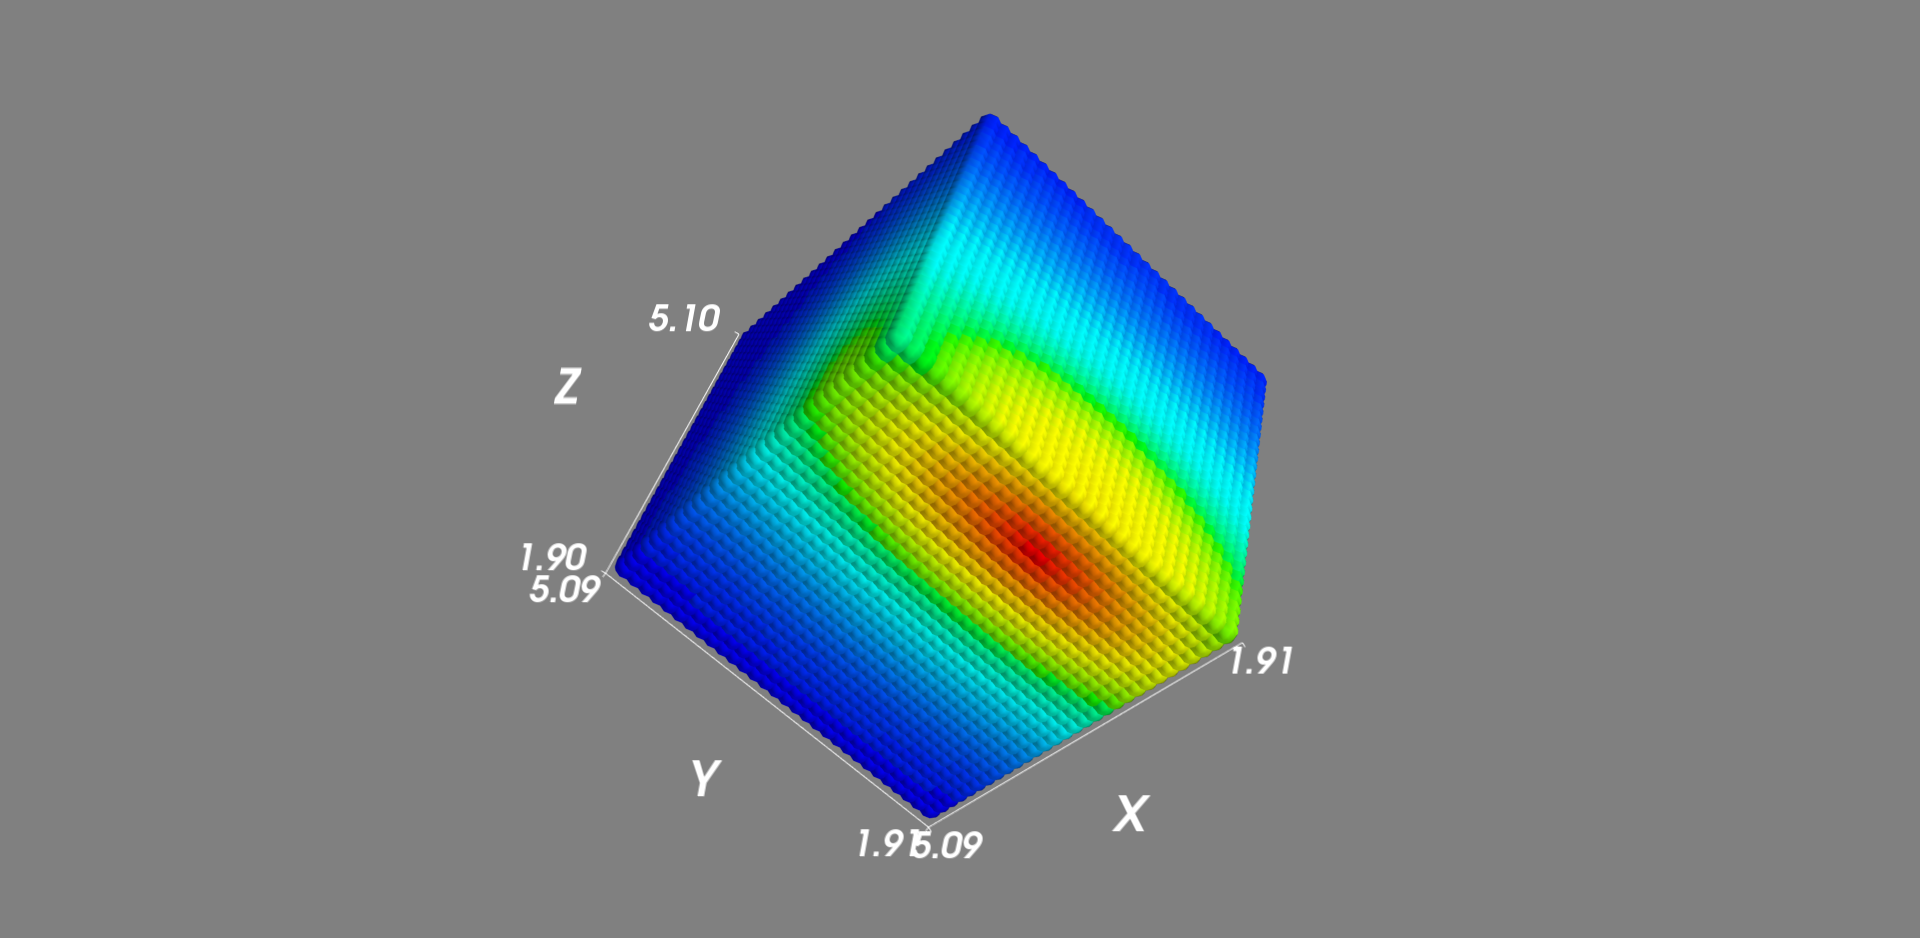
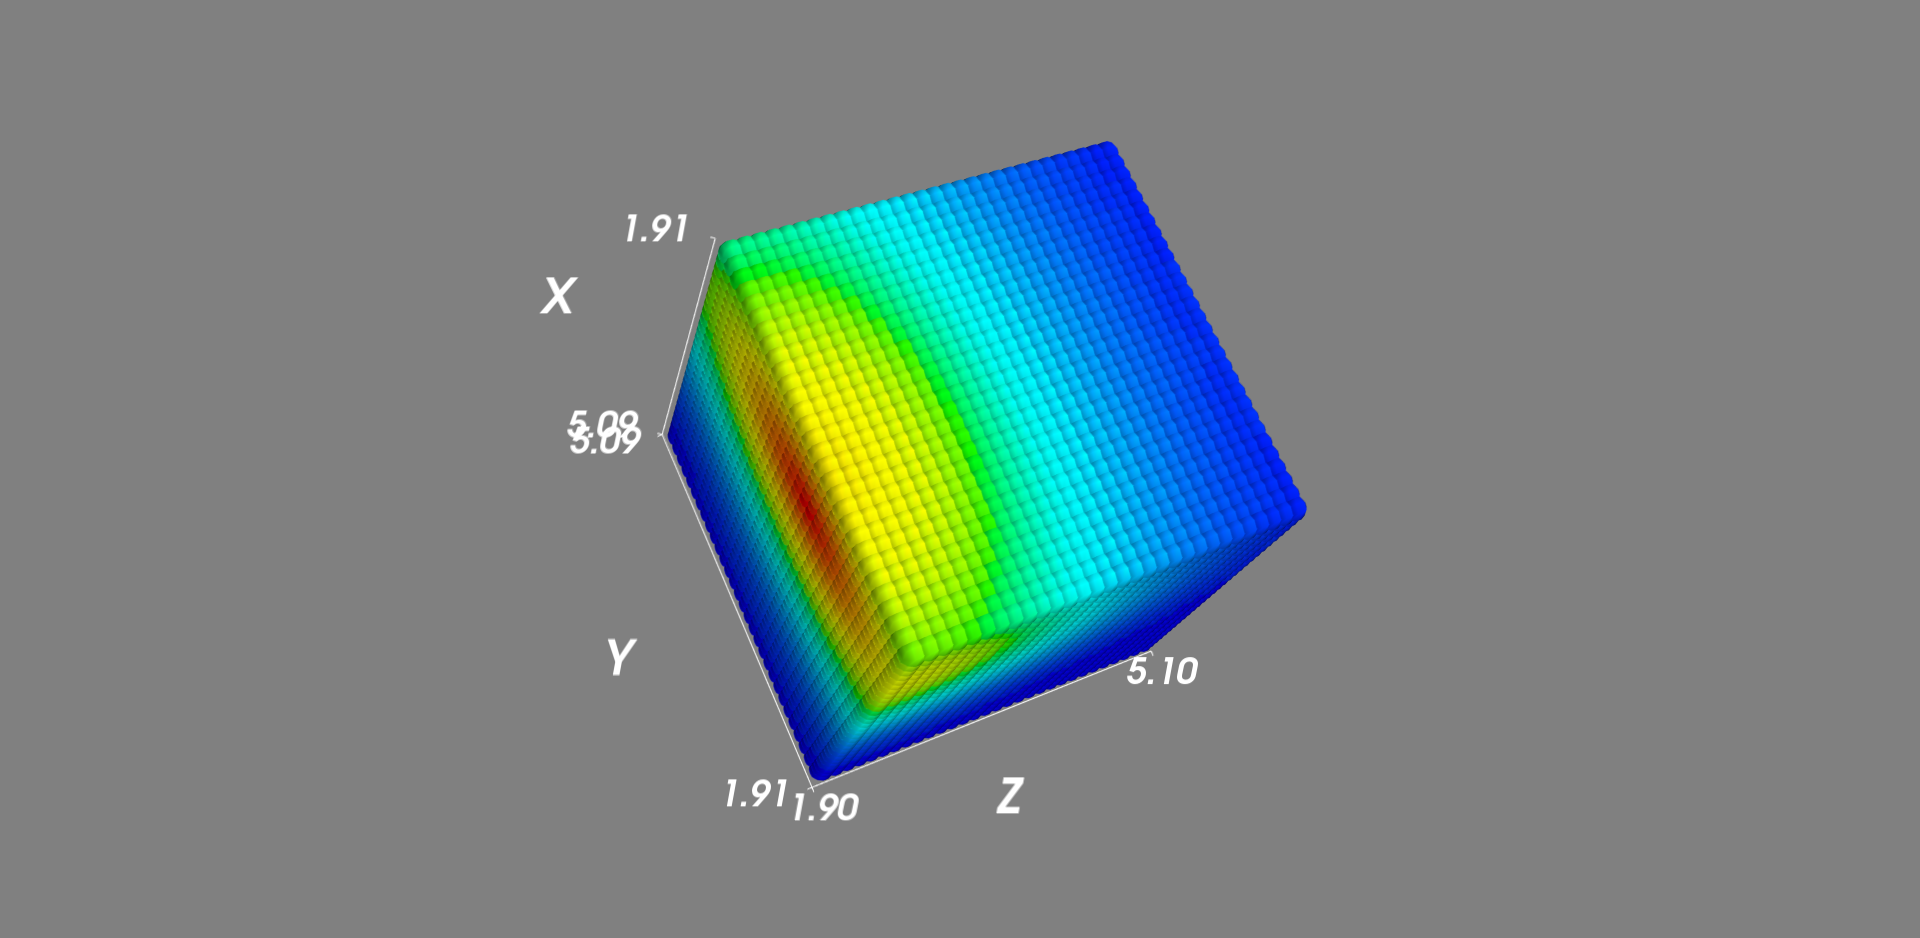
4次元データは描画できないので、確率の値は色で表現するようにした。
import scipy.stats
import numpy as np
from mayavi import mlab

x = np.linspace(2.0,5.0,30)
y = np.linspace(2.0,5.0,30)
z = np.linspace(2.0,5.0,30)
X,Y,Z=np.meshgrid(x,y,z)
pos = np.vstack((X.flatten(),Y.flatten(),Z.flatten())).T

mean = np.array([2.5, 3.3, 2.0])
cov  = np.diag([0.5,2.5,1.0])
p = scipy.stats.multivariate_normal(mean,cov).pdf(pos)
figure = mlab.figure('3d gaussian pdf')
pts = mlab.points3d(pos[:,0], pos[:,1], pos[:,2], p, scale_mode='none')
mlab.axes()
mlab.show()
ランダムデータのサンプリング
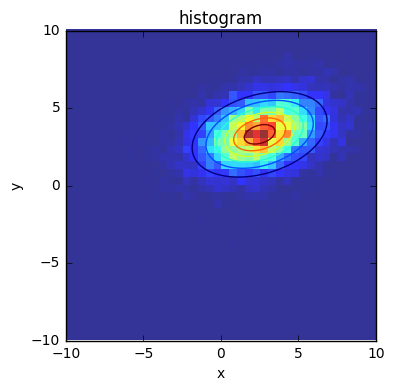
1次元と同じでrvsを使う。下図はデータをサンプリングしてヒストグラムを表示したもの
mean = np.array([2.5, 3.3])
cov  = np.array([[5.0,1.0],[1.0,2.0]])
mvn = scipy.stats.multivariate_normal(mean,cov)
ys = mvn.rvs(size=10000)

x,y = np.meshgrid(np.linspace(-10,10,100),np.linspace(-10,10,100))
pos = np.dstack((x,y))
z = mvn.pdf(pos)

fig = plt.figure()
ax = fig.add_subplot(111,aspect='equal')
H = ax.hist2d(ys[:,0],ys[:,1], bins=[np.linspace(-10,10,41),np.linspace(-10,10,41)],alpha=0.8)
ax.contour(x,y,z)
ax.set_xlabel('x')
ax.set_ylabel('y')
ax.set_title('histogram')
Truncated Normal Distribution
確率密度分布
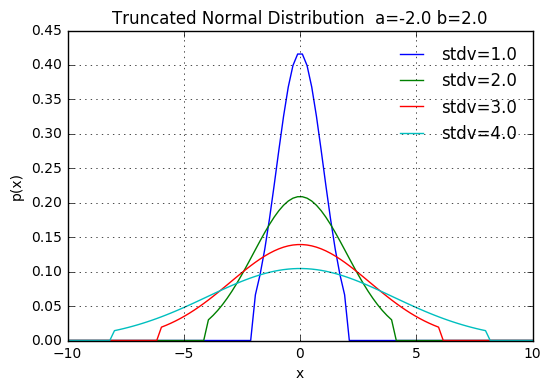
x = np.linspace(-10,10,100)
stdvs = [1.0, 2.0, 3.0, 4.0]
a = -2
b = 2
fig = plt.figure()
ax = fig.add_subplot(111)

for s in stdvs:
    ax.plot(x, scipy.stats.truncnorm.pdf(x,a, b, scale=s), label='stdv=%.1f' % s)
ax.set_xlabel('x')
ax.set_ylabel('p(x)')
ax.set_title('Truncated Normal Distribution  a=%.1f b=%.1f' % (a,b))
ax.legend(loc='best', frameon=False)
ax.grid(True)
ランダムデータサンプリング
a = -2
b = 2
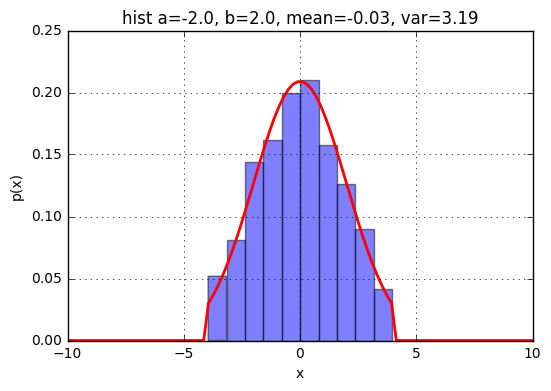
xs = scipy.stats.truncnorm.rvs(a, b, scale=2,size=1000)
x = np.linspace(-10,10,100)
p = scipy.stats.truncnorm.pdf(x, a, b, scale=2)
v = np.var(xs)
m = np.mean(xs)
fig = plt.figure()
ax = fig.add_subplot(111)
ax.hist(xs, bins=10, alpha=0.5, normed=True)
ax.plot(x,p, 'r-', lw=2)
ax.set_xlabel('x')
ax.set_ylabel('p(x)')
ax.set_title('hist a=%.1f, b=%.1f, mean=%.2f, var=%.2f' % (a,b,m,v))
ax.grid(True)
Gamma分布
確率密度関数は下記のように与えられる。
f(x|\alpha,\beta)=\frac{\beta^{\alpha}}{\Gamma(\alpha)} x^{\alpha-1}e^{-\beta x}
確率密度分布
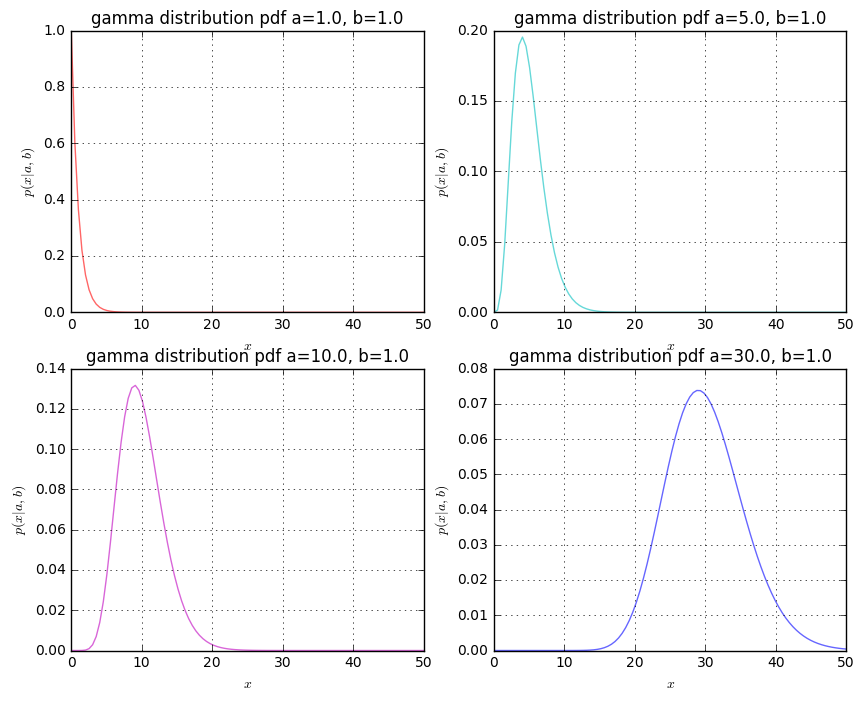
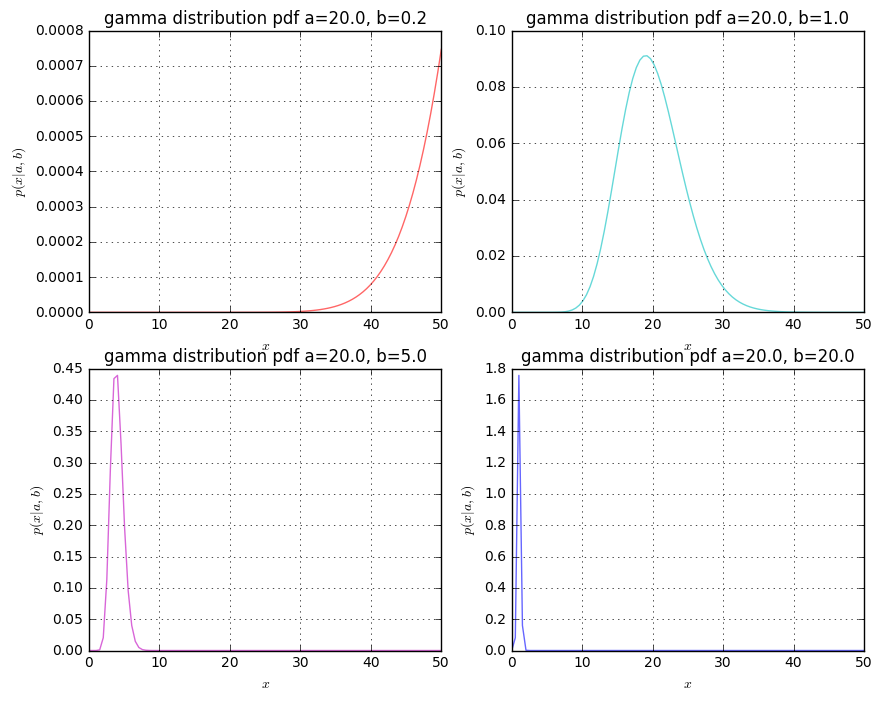
確率密度分布はgamma.pdfで取得する。aはShape parameterで、bはscale parameterを表す。
import matplotlib.pyplot as plt
from scipy.stats import gamma
import numpy as np
x = np.linspace(0,50,100)
fig, axes = plt.subplots(nrows=2,ncols=2,figsize=(10,8))
b = 1.0

a = 1.0
axes[0,0].plot(x,gamma.pdf(x,a,scale=1./b),'r-', lw=1,alpha=0.6,label='$a=%.1f, b=%.1f$' %(a,b))
axes[0,0].set_xlabel('$x$')
axes[0,0].set_ylabel('$p(x|a,b)$')
axes[0,0].set_title('gamma distribution pdf a=%.1f, b=%.1f' % (a,b))
axes[0,0].grid(True)
a = 5.0
axes[0,1].plot(x,gamma.pdf(x,a,scale=1./b),'c-', lw=1,alpha=0.6,label='$a=%.1f, b=%.1f$' %(a,b))
axes[0,1].set_xlabel('$x$')
axes[0,1].set_ylabel('$p(x|a,b)$')
axes[0,1].set_title('gamma distribution pdf a=%.1f, b=%.1f' % (a,b))
axes[0,1].grid(True)
a = 10.0
axes[1,0].plot(x,gamma.pdf(x,a,scale=1./b),'m-', lw=1,alpha=0.6,label='$a=%.1f, b=%.1f$' %(a,b))
axes[1,0].set_xlabel('$x$')
axes[1,0].set_ylabel('$p(x|a,b)$')
axes[1,0].set_title('gamma distribution pdf a=%.1f, b=%.1f' % (a,b))
axes[1,0].grid(True)
a = 30.0
axes[1,1].plot(x,gamma.pdf(x,a,scale=1./b),'b-', lw=1,alpha=0.6,label='$a=%.1f, b=%.1f$' %(a,b))
axes[1,1].set_xlabel('$x$')
axes[1,1].set_ylabel('$p(x|a,b)$')
axes[1,1].set_title('gamma distribution pdf a=%.1f, b=%.1f' % (a,b))
axes[1,1].grid(True)
import matplotlib.pyplot as plt
from scipy.stats import gamma
import numpy as np
x = np.linspace(0,50,100)
fig, axes = plt.subplots(nrows=2,ncols=2,figsize=(10,8))
a = 20.0

b = 0.2
axes[0,0].plot(x,gamma.pdf(x,a,scale=1./b),'r-', lw=1,alpha=0.6,label='$a=%.1f, b=%.1f$' %(a,b))
axes[0,0].set_xlabel('$x$')
axes[0,0].set_ylabel('$p(x|a,b)$')
axes[0,0].set_title('gamma distribution pdf a=%.1f, b=%.1f' % (a,b))
axes[0,0].grid(True)
b = 1.0
axes[0,1].plot(x,gamma.pdf(x,a,scale=1./b),'c-', lw=1,alpha=0.6,label='$a=%.1f, b=%.1f$' %(a,b))
axes[0,1].set_xlabel('$x$')
axes[0,1].set_ylabel('$p(x|a,b)$')
axes[0,1].set_title('gamma distribution pdf a=%.1f, b=%.1f' % (a,b))
axes[0,1].grid(True)
b = 5.0
axes[1,0].plot(x,gamma.pdf(x,a,scale=1./b),'m-', lw=1,alpha=0.6,label='$a=%.1f, b=%.1f$' %(a,b))
axes[1,0].set_xlabel('$x$')
axes[1,0].set_ylabel('$p(x|a,b)$')
axes[1,0].set_title('gamma distribution pdf a=%.1f, b=%.1f' % (a,b))
axes[1,0].grid(True)
b = 20.0
axes[1,1].plot(x,gamma.pdf(x,a,scale=1./b),'b-', lw=1,alpha=0.6,label='$a=%.1f, b=%.1f$' %(a,b))
axes[1,1].set_xlabel('$x$')
axes[1,1].set_ylabel('$p(x|a,b)$')
axes[1,1].set_title('gamma distribution pdf a=%.1f, b=%.1f' % (a,b))
axes[1,1].grid(True)
ランダムデータのサンプリング
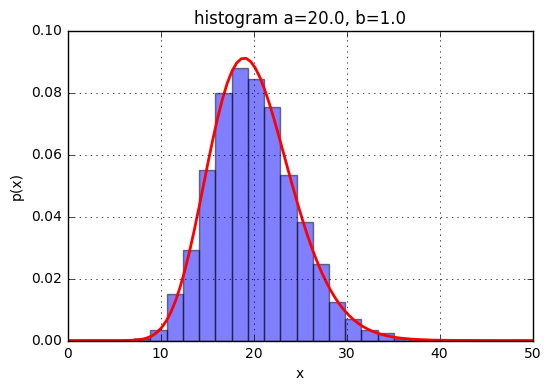
ランダムデータはrvsを使って取得する。
import matplotlib.pyplot as plt
from scipy.stats import gamma
import numpy as np

a = 20.0
b = 1.0

xs = gamma.rvs(a,scale=1.0/b,size=10000)

x = np.linspace(0,50,100)
p = gamma.pdf(x,a,scale=1.0/b)

fig = plt.figure()
ax = fig.add_subplot(111)
ax.hist(xs, bins=20, alpha=0.5, normed=True)
ax.plot(x,p, 'r-', lw=2)
ax.set_xlabel('x')
ax.set_ylabel('p(x)')
ax.set_title('histogram a=%.1f, b=%.1f' % (a,b))
ax.grid(True)
離散確率分布
ベルヌーイ分布
ベルヌーイ分布はscipy.stats.bernoulliを使う。
ベルヌーイ分布は値が0か1の離散的な確率分布で確率質量分布は下記のような数式で表される。
f(x|p)=p^{x}(1-p)^{1-x} \quad \textrm{for} \quad x \in {0,1}
確率質量分布
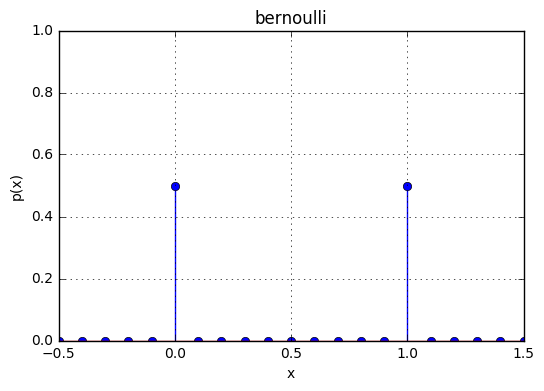
ベルヌーイ分布は離散的な確率分布なので確率密度分布ではなく確率質量分布になりそれに伴って使う関数名もpmfになる。
scipy.stats.bernoulli.pmf(x,p)
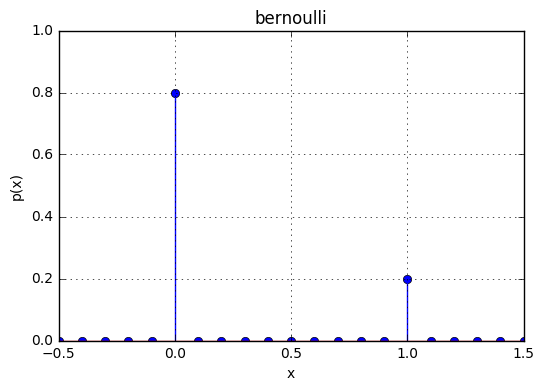
xには0か1の値を、pには1の時の確率を指定する。
ベルヌーイ分布の定義域は0,1なのでそれ以外の区間ではpmfが0になる。
x = np.linspace(-0.5,1.5,21)
p = scipy.stats.bernoulli.pmf(x, 0.5)

fig = plt.figure()
ax = fig.add_subplot(111)
ax.stem(x, p)
ax.set_xlabel('x')
ax.set_ylabel('p(x)')
ax.set_ylim(0,1)
ax.set_title('bernoulli')
ax.grid(True)
x = np.linspace(-0.5,1.5,21)
p = scipy.stats.bernoulli.pmf(x, 0.2)

fig = plt.figure()
ax = fig.add_subplot(111)
ax.stem(x, p)
ax.set_xlabel('x')
ax.set_ylabel('p(x)')
ax.set_ylim(0,1)
ax.set_title('bernoulli')
ax.grid(True)
ランダムデータのサンプリング
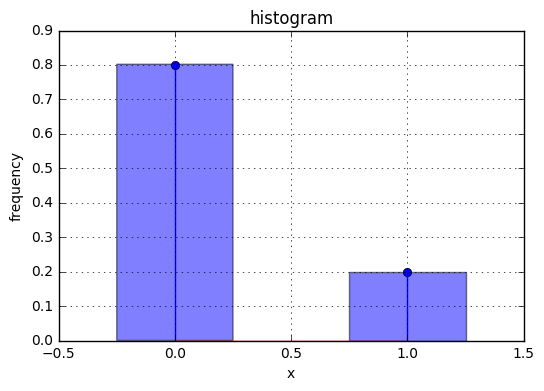
ランダムデータはrvsを使って取得する。
scipy.stats.bernoulli.rvs(p, size)
下図はサンプリングしたデータのヒストグラムを描画したもの。
xs = scipy.stats.bernoulli.rvs(p=0.2, size=1000)

x = np.linspace(0,1,2)
p = scipy.stats.bernoulli.pmf(x, 0.2)

fig = plt.figure()
ax = fig.add_subplot(111)
ax.hist(xs, bins=np.linspace(-0.5,1.5,3), alpha=0.5, normed=True, rwidth=0.5)
ax.stem(x, p)
ax.set_xlabel('x')
ax.set_ylabel('frequency')
ax.set_title('histogram')
ax.grid(True)
ポアソン分布
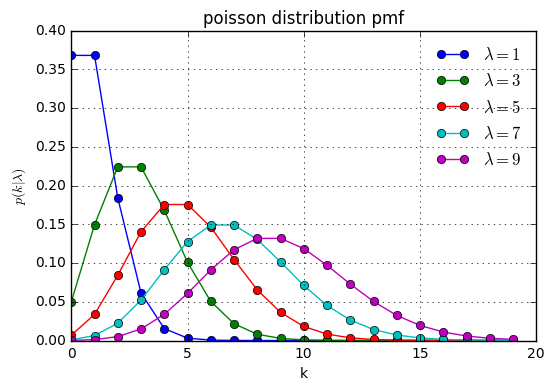
確率質量分布
k = np.arange(0,20)
mus = [1, 3, 5, 7, 9]
y = np.zeros((len(mus),k.size))

for i, mu in enumerate(mus):
    y[i,:] = scipy.stats.poisson.pmf(k, mu)

fig = plt.figure()
ax = fig.add_subplot(111)
for i in range(len(mus)):
    ax.plot(k,y[i,:],marker='o', label='$\lambda=%d$' % mus[i])

ax.set_xlabel('k')
ax.set_ylabel('$p(k|\lambda)$')
ax.set_title('poisson distribution pmf')
ax.grid(True)
ax.legend(loc='best', frameon=False)
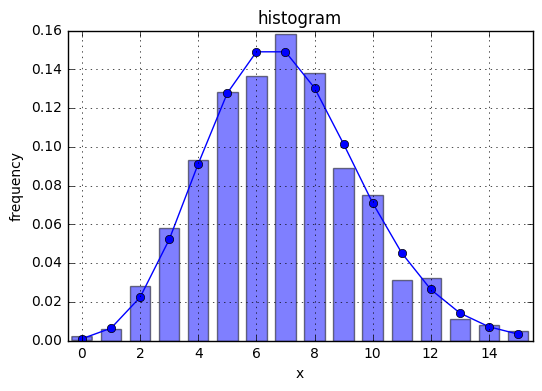
ランダムデータのサンプリング
xs = scipy.stats.poisson.rvs(7, size=1000)

k = np.linspace(0,15,16)
p = scipy.stats.poisson.pmf(k, 7)

fig = plt.figure()
ax = fig.add_subplot(111)
ax.hist(xs, bins=np.linspace(-0.5,15.5,17), alpha=0.5, normed=True, rwidth=0.7)
ax.plot(k,p,'bo-')
ax.set_xlabel('x')
ax.set_ylabel('frequency')
ax.set_xlim(-0.5,15.5)
ax.set_title('histogram')
ax.grid(True)
