経緯
NW構成図をExcelやPowerPointで作っていますか?
自身の経験上、NW構成図は作るのが大変、構成情報に変更があった際の修正が大変、管理が大変、など色々思うところがありました。
構成図を自動で描きたい、構成情報の変更を即座に反映したいと思って、
「NW構成図 作成」などで検索してみたもののなかなかいい記事にたどりつけなかったため、
無いなら自分で作ってしまおうということで、チャレンジしてみました。
やったこと
- 構成図情報のインプット形式の検討
- 構成図表示のロジック、アルゴリズム検討
- 構成図の画面表示
- 障害箇所の強調、接続されている線の縞々化
- 疎通が通っていること示すようなアニメーション表示
- ユーザーがドラッグ&ドロップで自由に配置を編集
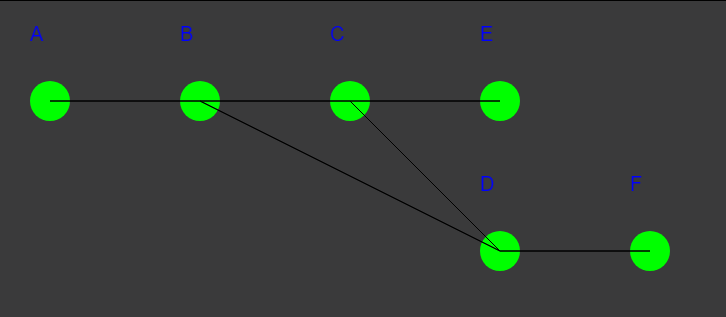
自動生成した構成図がこちら

今回は入力を以下のjson形式で与えようと考えました。
{"-": ["A"], "A":["B"], "B":["C", "D"], "C":["E", "D"], "D":["F"]}
「-」 が始まり(左上)を表します。
その他は、どこのホストからどこのホストに繋がっているかを示しています。
(jsonなので順不同です)
この入力を元に上記の構成図を描画するロジックを検討
STEP1
最初に以下について算出します。以下の情報がわかれば、あとは取得した位置に図形を表示していくだけとなります。
- 各ホストが配置される位置
- 各ホストの接続関係を示す線の始点と終点
インプットから、
- 「-」のホストを左上に配置します(位置を覚えます)
- 「-」のホストに接続されているホストを右側に配置します(位置を覚えます、呼び出し元とつながる線を覚えます)
- そのホストからさらに接続されていれば、右側に配置します(位置を覚えます、呼び出し元とつながる線を覚えます)
- 複数のホストが接続されている場合は縦軸が同じ位置に縦に配置します(位置を覚えます、呼び出し元とつながる線を覚えます)
- これを再帰的に行います
- 位置が被らないような工夫も加えています
再帰関数で実現
複数構成図を描画できるように、jsonのリスト [{構成図1},{構成図2}] を用意し、
structure_info = {"-": ["A"], "A":["B"], "B":["C", "D"], "C":["E", "D"], "D":["F"]}
を再帰関数のインプットとします。
STEP1の成果物は以下が出来上がります。
-
location_info_dict_list
[{ホスト名: [x, y]}, {ホスト名: [x, y]},・・・] -
line_list_list
[[[[ホスト名,ホスト名],[[x,y],[x,y]]], [[ホスト名,ホスト名],[[x,y],[x,y]]], ・・・], [[[ホスト名,ホスト名],[[x,y],[x,y]]], [[ホスト名,ホスト名],[[x,y],[x,y]]], ・・・]]
コードは以下です
      /*---------------------------------------------------------------*/
      /*     NW構成図をの配置を計算する関数(再帰的に実行される)           */
      /*---------------------------------------------------------------*/
      // 再帰関数を定義
      // 引数:構成図情報のkey
      const calculate = function(key, structure_info){
        // 構成図情報にkeyが存在しない場合return(線をつなぐ先がない)
        if (key in structure_info){
          ;
        }else{
          return;
        }
        // すでに見たkeyならreturn(既にチェック済み)
        if (checked_key_list.includes(key)){
          return;
        }

        /*---------------------------------------------------------------*/
        /*     始点を配置                                                 */
        /*---------------------------------------------------------------*/
        // 構成図内でまだ何も配置していない場合(始点を一番最初に配置する)
        if (checked_key_list.length == 0){
          // 始点でなければスキップ
          if (key != '-'){
            return;
          }

          // チェック済みリストにkeyを追加('-'は1つのみ存在)
          checked_key_list.push(key);
          // structure_info[key]のリストでループ(接続されている点をすべて配置する)
          for (const next_key of structure_info[key]) {
            // 位置を定義
            var x = 50;
            var y = 100;
            if (last_y!=0){
              y = last_y + 150;
            }
            // 位置を覚える
            location_info_dict[next_key] = [x, y];
            if (x>max_x){
              max_x = x;
            }
            if (y>max_y){
              max_y = y;
            }

            // 再帰的に次の点以降の配置を実行
            calculate(next_key, structure_info);
          }
        }
        /*---------------------------------------------------------------*/
        /*     始点以外を配置                                             */
        /*---------------------------------------------------------------*/
        // 構成図内ですでに何かしら配置されている場合
        else{
          // チェック済みリストにkeyを追加
          checked_key_list.push(key);

          // structure_info[key]のリストでループ(接続されている点をすべて配置する)
          for (const next_key of structure_info[key]) {
            // まだ配置されていない場合に配置
            if (next_key in location_info_dict){
              ;
            }else{
              // 位置を定義
              // key(親)が置かれている位置を取得
              var key_location = location_info_dict[key];
              var x = key_location[0] + 150;
              var y = key_location[1];
              // 既に配置したものと被らないように位置を調整
              for (let location_info_key in location_info_dict) {
                if (x <= location_info_dict[location_info_key][0] && y <= location_info_dict[location_info_key][1]){
                  y = location_info_dict[location_info_key][1] + 150;
                }
              }
              // 位置を覚える
              location_info_dict[next_key] = [x, y];
              last_y = y;
              if (x>max_x){
                max_x = x;
              }
              if (y>max_y){
                max_y = y;
              }
            }

            /*---------------------------------------------------------------*/
            /*     線の情報を格納                                             */
            /*---------------------------------------------------------------*/
            var start_location = location_info_dict[key];
            var end_location = location_info_dict[next_key];
            line_list.push([[key,next_key],[start_location,end_location]]);

            // 再帰的に次の点以降の配置を実行
            calculate(next_key, structure_info);
          }
        }
      }
STEP2
算出した位置情報と線情報を元にcanvasを用いて描画していきます。
html側で定義してもいいですが、今回はinnerHTMLでJavaScript側で定義しています。
    /*---------------------------------------------------------------*/
    /*     Shadow DOM(メイン処理)                                   */
    /*---------------------------------------------------------------*/
    const shadowRoot = document.body.attachShadow({mode: 'open'});
    shadowRoot.innerHTML = `
    <header>
    <h1 class="headline">
    <a id="title" ></a>
    </h1>
    </header>
    <!--キャンバスの背景色/枠線を指定-->
    <link rel="stylesheet" href="./style.css">
    <!--キャンバスの準備-->
    <canvas id="cv" width="1000" height="600" >ブラウザが描写に対応していません。</canvas>
    <div>
    <p id="detail"></p>
    </div>
    `;
      // キャンバスを用意
      var cv_canvas = shadow.getElementById("cv");
      var cv_ctx = cv_canvas.getContext("2d");
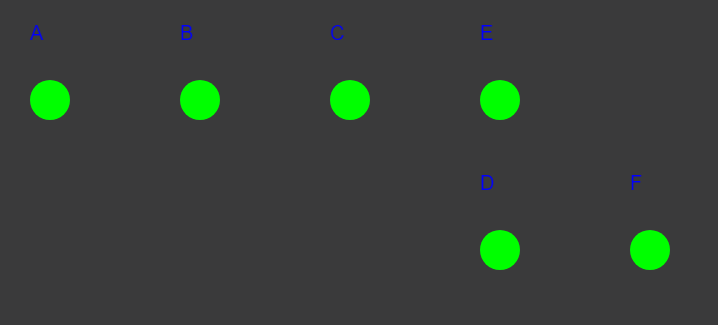
各ホストの場所に●を表示します

          for (const location_info_dict of location_info_dict_list) {
            /*---------------------------------------------------------------*/
            /*     各ホストの位置に丸を表示                                    */
            /*---------------------------------------------------------------*/
            for(let key in location_info_dict) {
              cv_ctx.beginPath();
              // 塗りつぶす色を指定する
              cv_ctx.fillStyle = 'rgb(0, 255, 0)';
              // 円を描く位置を決める
              cv_ctx.arc(location_info_dict[key][0], location_info_dict[key][1], 20, 0, Math.PI * 2, false);
              // 円を描く
              cv_ctx.fill();
            }
各ホストの名前を表示します
            /*---------------------------------------------------------------*/
            /*     文字説明を表示                                             */
            /*---------------------------------------------------------------*/
            for(let key in location_info_dict) {
              cv_ctx.fillStyle = 'rgba(0, 0, 255)';
              cv_ctx.font = '15pt Arial';
              cv_ctx.fillText(key, location_info_dict[key][0]-20, location_info_dict[key][1]-60);
            }
各ホストをつなぐ線を表示します
            /*---------------------------------------------------------------*/
            /*     線でつなぐ                                                 */
            /*---------------------------------------------------------------*/
            for (const line_location of line_list_list[nw_count]) {
              // 線を引く
              cv_ctx.beginPath();
              // 開始位置に移動する
              cv_ctx.moveTo(line_location[1][0][0], line_location[1][0][1]);
              // 線を引く
              cv_ctx.lineTo(line_location[1][1][0], line_location[1][1][1]);
              cv_ctx.closePath();
              cv_ctx.strokeStyle = "Black";
              cv_ctx.lineWidth = 1;
              cv_ctx.stroke();
            }
これで構成図の骨組みは、完成となります。
付加価値をつける
ここから先はさらに踏み込んで付加価値をつけていきます。
障害中のホストと繋がる線を縞々にする

障害中のホストは、
failure_host_list = [structure_infoのキー名, structure_infoのキー名]
として与えておきます。
            /*---------------------------------------------------------------*/
            /*     障害が起きている点に関係する線を縞々にする                   */
            /*---------------------------------------------------------------*/
            // 線の等分数
            var step_times = 10;
            for (const line_location of line_list_list[nw_count]) {
              for (const line_key of line_location[0]) {
                // 障害発生中の場合
                if (failure_host_list.includes(line_key)){
                  // 縞々の間隔
                  var step_x = (line_location[1][1][0] - line_location[1][0][0])/step_times;
                  var step_y = (line_location[1][1][1] - line_location[1][0][1])/step_times;
                  cv_ctx.lineWidth = 1;
                  for (var i=0; i<step_times; i++){
                    // 線を引く
                    cv_ctx.beginPath();
                    // 開始位置に移動する
                    cv_ctx.moveTo(line_location[1][0][0] + step_x*i, line_location[1][0][1] + step_y*i);
                    // 線を引く
                    cv_ctx.lineTo(line_location[1][0][0] + step_x*(i+1), line_location[1][0][1] + step_y*(i+1));
                    // 色を指定
                    if (i%2==0){
                      cv_ctx.strokeStyle = "Black";
                    }else{
                      cv_ctx.strokeStyle = "Yellow";
                    }
                    cv_ctx.closePath();
                    cv_ctx.stroke();
                  }
                }
              }
            }
障害中のホストと繋がる線の真ん中に×を表示する

            /*---------------------------------------------------------------*/
            /*     障害が起きている線の中間に×を描画する                       */
            /*---------------------------------------------------------------*/
            for (const line_location of line_list_list[nw_count]) {
              for (const line_key of line_location[0]) {
                // 障害発生中の場合
                if (failure_host_list.includes(line_key)){
                  var midpoint_x = (line_location[1][0][0] + line_location[1][1][0])/2
                  var midpoint_y = (line_location[1][0][1] + line_location[1][1][1])/2
                  var x1 = midpoint_x - 10;
                  var y1 = midpoint_y - 10;
                  var x2 = midpoint_x + 10;
                  var y2 = midpoint_y + 10;

                  // 線を引く
                  cv_ctx.beginPath();
                  // 開始位置に移動する
                  cv_ctx.moveTo(x1, y1);
                  // 線を引く
                  cv_ctx.lineTo(x2, y2);
                  // 開始位置に移動する
                  cv_ctx.moveTo(x1, y2);
                  // 線を引く
                  cv_ctx.lineTo(x2, y1);

                  cv_ctx.closePath();
                  cv_ctx.strokeStyle = "Red";
                  cv_ctx.lineWidth = emphasis_anumation_cycle;
                  cv_ctx.stroke();
                }
              }
            }
正常な線にボールのアニメーションを付ける

アニメーションはsetIntervalを用いて、一定時間ごとに画面クリアと再描画の処理を繰り返すことで、実現します。
setInterval( () => {処理内容を記載}, 800);
Canvasのリフレッシュ
cv_ctx.clearRect(0, 0, cv_canvas.width, cv_canvas.height);
            /*---------------------------------------------------------------*/
            /*     線上を動く●点を描画する                                    */
            /*---------------------------------------------------------------*/
            for (const line_location of line_list_list[nw_count]){
              var check_count = 0;
              // 線をつなぐ要素で障害中のものをカウント
              for (const line_key of line_location[0]) {
                // 障害発生中の場合
                if (failure_host_list.includes(line_key)){
                  check_count += 1;
                }
              }
              // 線をつなぐ要素が全て障害中ではない場合
              if (check_count != line_location[0].length-1){
                // 円を描画
                cv_ctx.beginPath();
                cv_ctx.arc(line_location[1][0][0] + point_animation_count * (line_location[1][1][0]-line_location[1][0][0])/point_animation_cycle,
                          line_location[1][0][1] + point_animation_count * (line_location[1][1][1]-line_location[1][0][1])/point_animation_cycle,
                          5, 0, 2 * Math.PI);    // 円の描画
                cv_ctx.fillStyle = 'Orange';    // 塗りつぶす色
                cv_ctx.fill();                  // 塗りつぶし
              }
            }
障害発生中のホストを強調させる

            /*---------------------------------------------------------------*/
            /*     障害発生中の要素を強調表示する                              */
            /*---------------------------------------------------------------*/
            for(let key in location_info_dict) {
              // 障害発生中の場合
              if (failure_host_list.includes(key)){
                cv_ctx.beginPath();
                cv_ctx.arc(location_info_dict[key][0], location_info_dict[key][1], 20*emphasis_anumation_count, 0, 2 * Math.PI);
                cv_ctx.fillStyle = 'Red';
                cv_ctx.fill();
              }
            }
各ホストを画像で表示

            /*---------------------------------------------------------------*/
            /*     構成図に画像をかぶせる                                     */
            /*---------------------------------------------------------------*/
            for (let key in location_info_dict){
              cv_ctx.drawImage(img, location_info_dict[key][0]-25, location_info_dict[key][1]-50);
            }
マウスのドラッグ&ドロップを検知して、ユーザーが配置を自由に変更できるようにする
マウスのクリックの検知は、addEventListenerで行います。
押下時は、mousedown
指を離した時は、mouseup
移動時は、mousemove
- マウスクリック時に、カーソルの位置情報を取得し、その位置がホストの配置場所と重なっていれば、マウスの移動の検知を開始
- 移動を検知したら、そのカーソル位置にホストの画像を描画
- マウスから指を離した時に、位置情報location_info_dict_list、線情報line_list_listを更新し、マウスの移動の検知を終了
      /*---------------------------------------------------------------*/
      /*     ドラッグ&ドロップの検知                                   */
      /*---------------------------------------------------------------*/
      var xx;
      var yy;
      // クリックされた構成図のキー
      var click_key;
      // クリックの直後の1回を判定
      var click_start = true;
      // 構成図番号
      var num = 0;
      // マウスの移動を検知した時に実行される
      let move = (e) => {
        let rect = e.target.getBoundingClientRect() ;
        xx = e.clientX - rect.left;
        yy = e.clientY - rect.top;
        // クリックした直後の1回のみ処理する
        if (click_start){
          num = 0;
          for (const location_info_dict of location_info_dict_list) {
            for (let key in location_info_dict){
              var x = e.clientX - rect.left;
              var y = e.clientY - rect.top;
              var a = (x > location_info_dict[key][0] - 40);
              var b = (x < location_info_dict[key][0] + 40);
              var c = (y > location_info_dict[key][1] - 40);
              var d = (y < location_info_dict[key][1] + 40);
              if (a && b && c && d){
                click_key = key;
                break_flag = true;
                break;
              }
            }
            if (break_flag){
              break;
            }
            num += 1;
          }
        }
        if (break_flag){
          cv_ctx.drawImage(img, xx-25, yy-50);
        }
        click_start = false;
      }

      // マウスをクリック後指を離した時に実行される
      let moveup = (e) => {
        let rect = e.target.getBoundingClientRect() ;
        xx = e.clientX - rect.left;
        yy = e.clientY - rect.top;
        break_flag = false;
        click_start = true;
        // 位置情報を更新する
        location_info_dict_list[num][click_key] = [xx, yy];
        var position = 0;
        var arr = line_list_list.slice(0, line_list_list.length);
        for (const line_location of arr[num]){
          // line_locationは、[[キー名,キー名],[[x,y],[x,y]]]
          if (line_location[0][0] == click_key){
            line_list_list[num][position][1][0] = [xx,yy]
          }
          if (line_location[0][1] == click_key){
            line_list_list[num][position][1][1] = [xx,yy]
          }
          position += 1;
        }
        // マウスの移動の検知を終了
        cv_canvas.removeEventListener('mousemove',move);
      }

      // マウスがクリックされたことを検知
      cv_canvas.addEventListener('mousedown', ()=> {
        // マウスの移動を検知開始
        cv_canvas.addEventListener('mousemove',move);
      });
      // マウスのクリックを離したことを検知
      cv_canvas.addEventListener('mouseup', moveup);
    }
まとめ
構成図の自動生成のロジックを考え、コード化しました。
もっと作りこむことで、色々とできそうです。
構成図描画メインの記事になっていますので、以下の技術的な内容は他の方の記事等を参考にされたいです。
- canvas
- setInterval
- EventListener
- Shadow DOM
- InnerHTML
参考(MDN)
Canvas_API
setInterval
EventListener
Web_Components
innerHTML