はじめに
こんにちは!AI開発事業部の須藤です。
この記事は、Advent Calendar 2022の20日目の記事になります。
主に画像系のアプリ開発に携わっておりますが、分析業務なども経験してきました。
この記事はMatplotlibで生成したグラフをHTMLとして出力する方法を紹介します。
背景
Jupyterサーバで分析業務をしており結果をそのままノートブックで共有していたが、色んなケースごとにグラフを出力する必要があり、ノートブックから結果を分離したかった。
ノートブックで生成したグラフをHTMLファイルとして出力できれば、そのままJupyterサーバで共有することができると考えた。
さっそく実践してみる
ソースコード
import numpy as np
import matplotlib.pyplot as plt
import io
import base64

HTML_TMP = """
<!doctype html>
<html lang="ja">
  <body>
    <img src="data:image/png;base64,{image_bin}">
  </body>
</html>
"""

def img2html(fig):
    sio = io.BytesIO()
    fig.savefig(sio, format='png')
    image_bin = base64.b64encode(sio.getvalue())
    return HTML_TMP.format(image_bin=str(image_bin)[2:-1])

x = np.random.random_sample(100)
y = np.random.random_sample(100)

fig = plt.figure(figsize=(8, 6))
plt.title("sample")
plt.scatter(x, y)

html = img2html(fig)
plt.close()

with open("./sample.html", "w") as w:
    w.write(html)
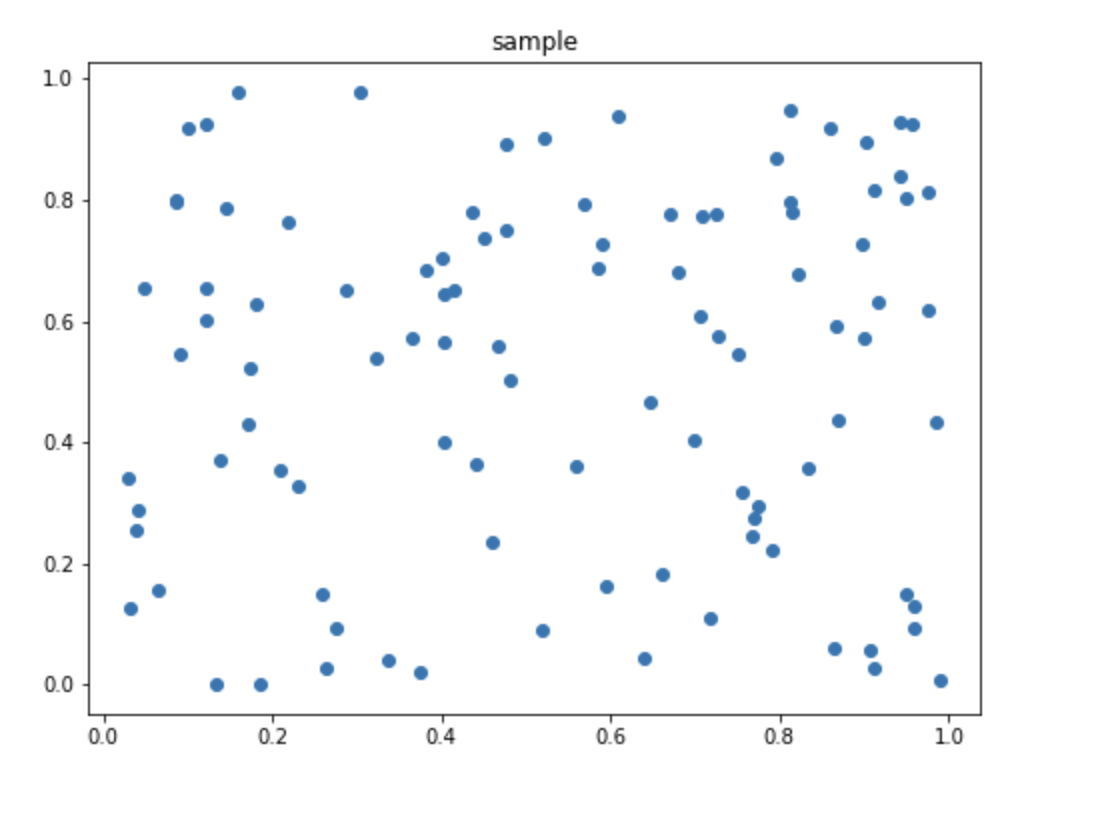
こちらを実行して、出力されたsample.htmlを開くと以下のような散布図が表示されます。

解説
- HTMLのテンプレート文を用意します
HTML_TMP = """
<!doctype html>
<html lang="ja">
  <body>
    <img src="data:image/png;base64,{image_bin}">
  </body>
</html>
"""
以下はBase64にエンコードされた画像データを埋め込む為のコードになります。
<img src="data:image/png;base64,{image_bin}">
最終的に{image_bin}のところに、エンコードされた画像データが入ります。
- 散布図を作成します
x = np.random.random_sample(100)
y = np.random.random_sample(100)

fig = plt.figure(figsize=(8, 6))
plt.title("sample")
plt.scatter(x, y)
上記のコードは、ランダムな数字をx, yでそれぞれ100個ずつ取得しplt.scatter(x, y)でグラフを生成します。
- 生成したグラフをBase64にエンコードし、HTMLに埋め込みます。
def img2html(fig):
    sio = io.BytesIO()
    fig.savefig(sio, format='png')
    image_bin = base64.b64encode(sio.getvalue())
    return HTML_TMP.format(image_bin=str(image_bin)[2:-1])
sio = io.BytesIO()でバイト列を扱う為の入れ物を作ります。
fig.savefig(sio, format='png')savefigメソッドの中に、先ほどのバイト列を扱う為の入れ物とフォーマットを指定して入れ物の中にデータを入れます。
image_bin = base64.b64encode(sio.getvalue())入れ物からデータを取り出しBase64にエンコードします。
return HTML_TMP.format(image_bin=str(image_bin)[2:-1])エンコードしたデータを文字列に変換し、前後の余計な部分をカットしてHTMLのテンプレート文の中に埋め込みます。
- 埋め込んだHTMLをファイルに出力します。
html = img2html(fig)
plt.close()

with open("./sample.html", "w") as w:
    w.write(html)
先ほど解説したimg2html関数を呼んで、グラフが埋め込まれたHTML文を取得し、sample.htmlとしてファイル出力します。
実践的なコードに改良
ここまでHTMLにグラフを埋め込む方法を紹介してきました。
最後に改良を加えてクラス化したものと、使い方を少し紹介して終わりにしたいと思います。
グラフをHTMLに変換し出力するクラス
import numpy as np
import os, sys, io
import base64

HTML_TMP = """
<!doctype html>
<html lang="ja">
  <head>
    <meta charset="utf-8">
    <meta name="viewport" content="width=device-width, initial-scale=1, shrink-to-fit=no">
    <link rel="stylesheet" href="https://maxcdn.bootstrapcdn.com/bootstrap/4.0.0/css/bootstrap.min.css">
  </head>
  <style>
      header {{
          background-color: #FFF;
          position: sticky;
          top: 0;
      }}
  </style>
  <body>
    <script src="https://code.jquery.com/jquery-3.2.1.min.js"></script>
    <script src="https://cdnjs.cloudflare.com/ajax/libs/popper.js/1.12.9/umd/popper.min.js"></script>
    <script src="https://maxcdn.bootstrapcdn.com/bootstrap/4.0.0/js/bootstrap.min.js"></script>
    <div class="container">
        {head}
        {body}
    </div>
  </body>
</html>
"""

HTML_IMG_TMP = '''
<img src="data:image/png;base64,{image_bin}">
'''


def make_dirs(target_dir):
    if os.path.exists(target_dir) or target_dir=="":
        return
    os.makedirs(target_dir)
    print('create dir ' + target_dir)
    return True


def figure2html(fig):
    sio = io.BytesIO()
    fig.savefig(sio, format='png')
    image_bin = base64.b64encode(sio.getvalue())
    return HTML_IMG_TMP.format(image_bin=str(image_bin)[2:-1])


class Myhtml():
    def __init__(self, body=''):
        self.body = body
        self.head = ''

    def add_header(self, header, h='h1'):
        self.head = '<header><{h}>{header}</{h}><hr size=10></header>\n'.format(header=header, h=h)
        return self

    def add_title(self, title, h='h1'):
        self.body += '<{h}>{title}</{h}>\n'.format(title=title, h=h)
        return self

    def add_figure(self, fig):
        self.body += figure2html(fig)
        return self

    def clear_body(self):
        self.body = ''

    def to_html(self):
        return HTML_TMP.format(body=self.body, head=self.head)

    def join(self, other):
        if other is not None:
            self.body += other.body
        return self

    def output_file(self, path):
        make_dirs(os.path.dirname(path))
        with open(path, 'w') as f:
            f.write(self.to_html())
Myhtmlクラスを利用するサンプルコード
from myhtml import Myhtml
import numpy as np
import matplotlib.pyplot as plt


html = Myhtml()
html.add_header("Advent Calendar 2022")

for i in range(10):
    html.add_title(f"sample {(i+1)}")

    x = np.random.random_sample(100)
    y = np.random.random_sample(100)
    fig = plt.figure(figsize=(8, 6))
    plt.title("sample")
    plt.scatter(x, y)

    html.add_figure(fig)
    plt.close()

html.output_file("sample.html")
上記のサンプルコードは前項の「グラフをHTMLに変換し出力するクラス」で書いたコードをmyhtml.pyに書き写したものを利用しています。
冒頭のfrom myhtml import Myhtmlでクラスを呼び出しています。
html.add_header("Advent Calendar 2022")で出力されるHTMLファイルにヘッダを作成し、for文内でランダムに生成される散布図をhtml.add_figure(fig)で埋め込んでいきます。埋め込む際に、html.add_title(f"sample {(i+1)}")でグラフに対してタイトルを付けます。
最後にhtml.output_file("sample.html")で出力します。
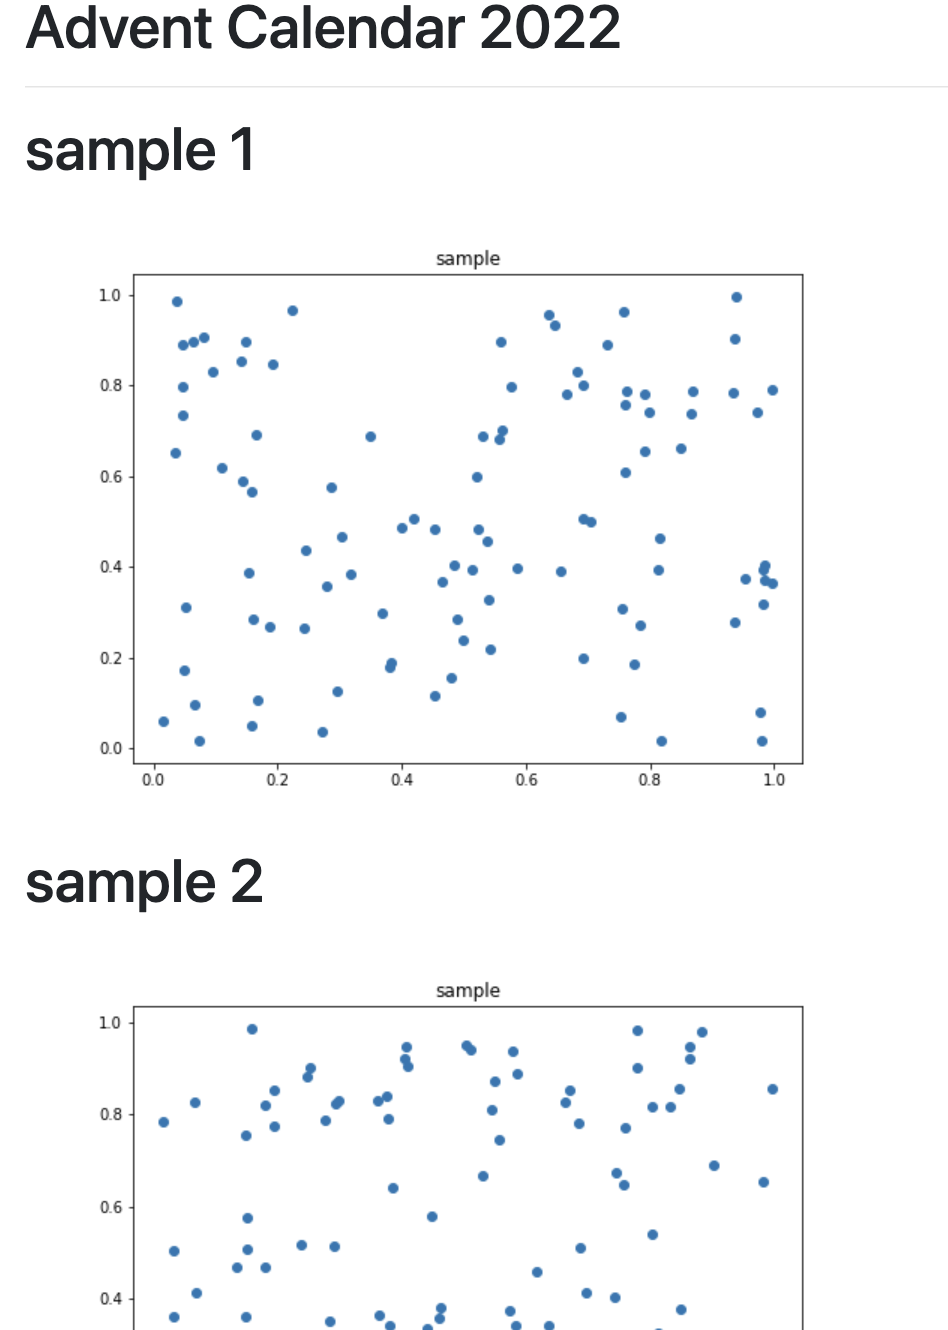
出力されたHTMLファイルは以下のように表示されます。

途中で切れておりますが、ヘッダが上にあり、タイトル → グラフ → タイトル → グラフという順で表示されました。
おわりに
いかがでしたでしょうか?
振り返ると大分冗長的なコードになっているように感じますが、そこはご愛嬌ということでご容赦下さい笑
今回はJupyterファイルからグラフを分離する目的で利用しておりましたが、Pythonでグラフや画像をHTMLに埋め込む手法は、Webアプリ開発など利用する機会が意外と多いのではないかと感じます。そんな中でこの記事が少しでもみなさまのお役に立てれは幸いです。
最後までお読みいただきありがとうございました!