There is a csv file
sample.csv
     Apple  Orange  Lemon
age
10代     23      53     14
20代     35      24      9
30代     24      13     10
40代      9       8      5
50代      3       2      2
csvファイルがあります。データに意味はありません。
これを良い感じにグラフにしたいとします。
highcharts
highchartsとはJavaScriptグラフライブラリです。これを使ってみようと思います。
index.html
<head>
<meta charset="utf-8">
<script src="https://code.jquery.com/jquery-3.1.1.min.js"
  crossorigin="anonymous"></script>
</head>
<body>
<h1>Graph Sample</h1>
<div id="graph" style="width:800px;height:300px;"></div>
</body>

<script src="https://code.highcharts.com/stock/highstock.js"></script>
<script src="https://code.highcharts.com/stock/modules/exporting.js"></script>
<link href="https://cdnjs.cloudflare.com/ajax/libs/intro.js/2.5.0/introjs.min.css" rel="stylesheet">
<script type="text/javascript" src="https://cdnjs.cloudflare.com/ajax/libs/intro.js/2.5.0/intro.min.js"></script>
<script>
function draw_basic_column_graph(data, categories, graph_ref){
    var option = {
        chart: {
            type: 'column'
        },
        title: {
            text: 'Graph Title'
        },
        xAxis: {
            categories: categories,
            crosshair: true
        },
        yAxis: {
            min: 0,
            title: {
                text: '人数'
            }
        },
        tooltip: {
            headerFormat: '<span style="font-size:10px">{point.key}</span><table>',
            pointFormat: '<tr><td style="color:{series.color};padding:0;font-size:12px">{series.name}: </td>' +
                '<td style="padding:0;font-size:12px"><b>{point.y:.0f} 人</b></td></tr>',
            footerFormat: '</table>',
            shared: true,
            useHTML: true
        },
        plotOptions: {
            column: {
                pointPadding: 0.2,
                borderWidth: 0
            }
        },
        colors: ['#8085e9', '#f45b5b', '#8d4654', '#7798BF', '#aaeeee', '#ff0066', '#eeaaee',
      '#55BF3B', '#DF5353', '#7798BF', '#aaeeee'],
        series: data
    }
    $(graph_ref).highcharts('Chart', option);
}

$(document).ready(function(){
   $.ajax({
     url: '/graph',
     type: 'GET'
     }).done(function (data) {
        draw_basic_column_graph(
            data.series, data.categories, '#graph'
        );
   })
});
</script>
Flask
Flaskとは、pythonの軽量webフレームワークです。今回はこれを使って上記のcsvのデータをhighchartsに渡すことにします。
pipでインストール
$ pip install flask
process.py
def format_for_highcharts(df):
    """
    see https://www.highcharts.com/demo
    :param df: pd.DataFrame
    :return:
    """
    df.index = list(df.index.fillna('NODATA'))
    categories = list(df.columns.fillna('NODATA'))

    df = df.fillna(0)
    series = [{'name': index, 'data': list(map(int, row))} for index, row in df.iterrows()]
    return {'categories': categories, 'series': series}
flaskでサーバを立てます。
app.py
from flask import Flask, render_template
from flask import request, jsonify, url_for, redirect
from process import format_for_highcharts

app = Flask(__name__)
app.config['DEBUG'] = True

import pandas as pd


@app.route("/", methods=['GET'])
def index():
    return render_template('index.html')


@app.route("/graph", methods=['GET'])
def graph():
    df = pd.read_csv('sample.csv', index_col=0)
    return jsonify(format_for_highcharts(df))


if __name__ == "__main__":
    app.run(host="127.0.0.1", port=5000, debug=True)
起動します。
$ python app.py
http://127.0.0.1:5000/ を開くと以下のようなグラフが表示されるはずです。

リアルタイムに項目をフィルタすることもできます。
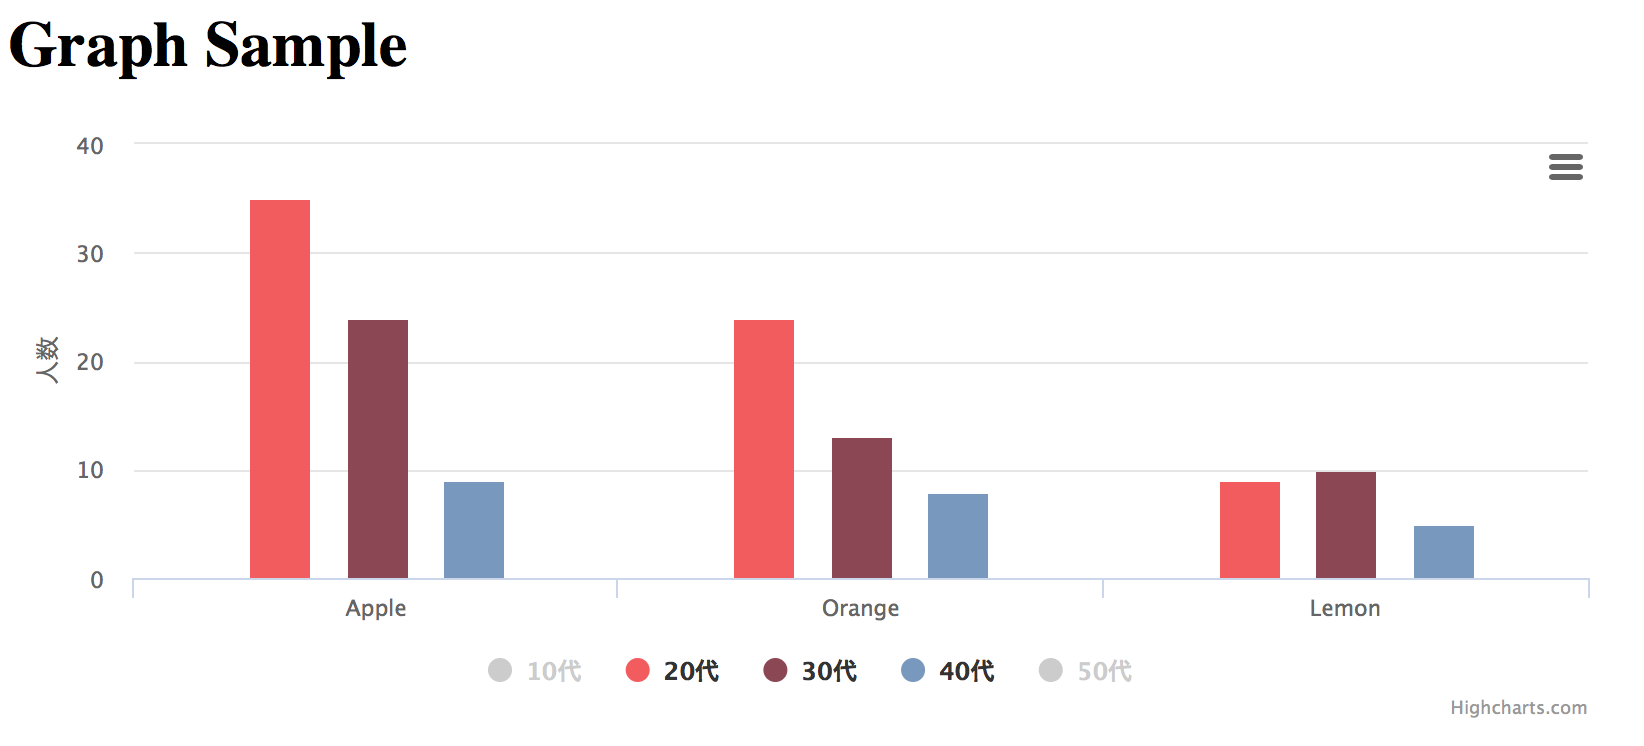
まあpythonなら普通にmatplotlibとか使えよという話なのですが、デザイン性のある/綺麗なグラフを作りたい時に使えるかもしれません。動きもカッコいいです。テーマは自由に設定でき、サンプルも用意されています。