pythonの代表的なグラフ描画ツールであるmatplotlibを勉強するついでに、Rの代表的なグラフ描画ツールであるggplotとmatplotlibのコードを比較していこうと思います。備忘録的要素が強いですが、ggplotに慣れている方や、逆にmatplotlibに慣れている方がもう片方を勉強する際の助けになれば幸いです。
データセットの読み込み
今回は、定番であるirisデータセットを使っていきます。
# python
import matplotlib.pyplot as plt
import seaborn as sns
df=sns.load_dataset("iris")
df.head()
# python
   sepal_length  sepal_width  petal_length  petal_width species
0           5.1          3.5           1.4          0.2  setosa
1           4.9          3.0           1.4          0.2  setosa
2           4.7          3.2           1.3          0.2  setosa
3           4.6          3.1           1.5          0.2  setosa
4           5.0          3.6           1.4          0.2  setosa
# R
library(tidyverse)
df <- iris
df %>% head()
# R
  Sepal.Length Sepal.Width Petal.Length Petal.Width Species
1          5.1         3.5          1.4         0.2  setosa
2          4.9         3.0          1.4         0.2  setosa
3          4.7         3.2          1.3         0.2  setosa
4          4.6         3.1          1.5         0.2  setosa
5          5.0         3.6          1.4         0.2  setosa
6          5.4         3.9          1.7         0.4  setosa
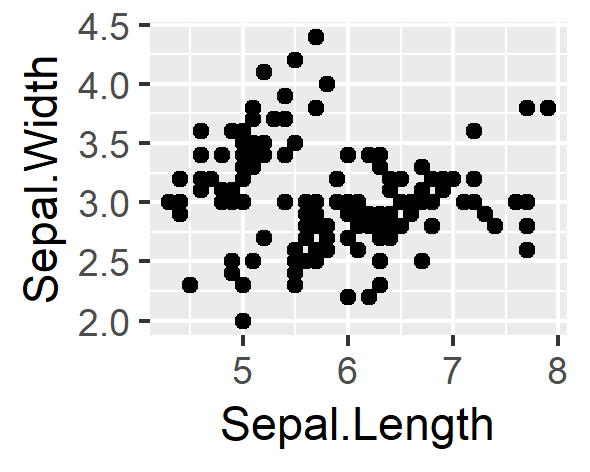
散布図
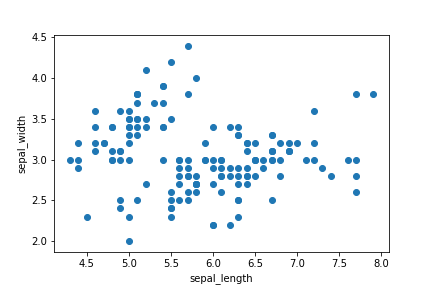
geom_point()関数 / Axes.scatter()メソッド
# ggplot
ggplot(data = df,aes(x=Sepal.Length,y=Sepal.Width))+
  geom_point()
# matplotlib
fig=plt.figure()#pyplot.figureクラスをインスタンス化
ax=fig.add_subplot(1,1,1)#1行1列のサブプロットを作成し、1番目にaxを配置
ax.scatter(df["sepal_length"],df["sepal_width"])#axに散布図を描画
ax.set_xlabel("sepal_length")#x軸ラベルを指定
ax.set_ylabel("sepal_width")#y軸ラベルを指定
plt.show()
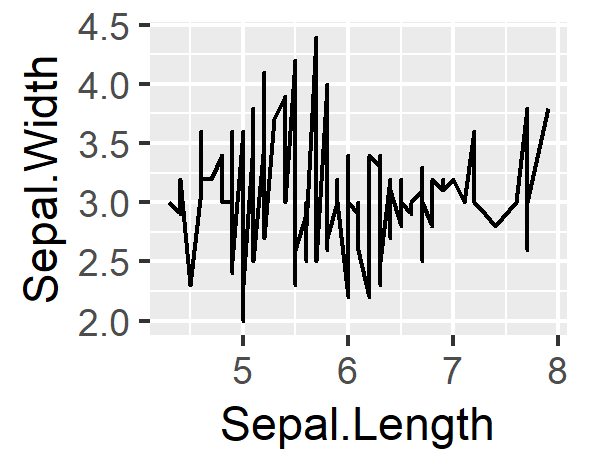
折れ線グラフ
geom_line()関数 / Axes.plot()メソッド
# ggplot
ggplot(data = df,aes(x=Sepal.Length,y=Sepal.Width))+
  geom_line()
# matplotlib

fig=plt.figure()#pyplot.figureクラスをインスタンス化
ax=fig.add_subplot(1,1,1)#1行1列のサブプロットを作成し、axを配置
ax.plot(df["sepal_length"],df["sepal_width"])#axに折れ線グラフを描画
ax.set_xlabel("sepal_length")#x軸ラベルを指定
ax.set_ylabel("sepal_width")#y軸ラベルを指定

plt.show()
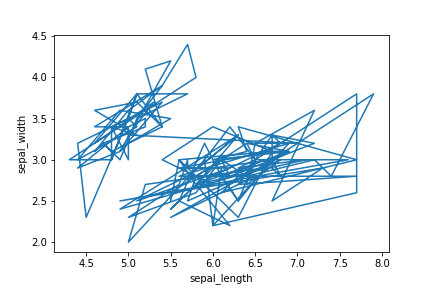
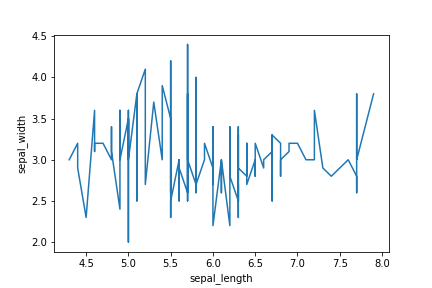
上記のコードでは、データの上の行の点から順番に結んでしまうらしい。そこで、x軸の列であるsepal_lengthをsortしたデータフレームを用意する。
# matplotlib
df1=df.sort_values(by=["sepal_length"])#sepal_lengthによって、dfをsortする

fig=plt.figure()#pyplot.figureクラスをインスタンス化
ax=fig.add_subplot(1,1,1)#1行1列のサブプロットを作成し、1番目にaxを配置
ax.plot(df1["sepal_length"],df1["sepal_width"])#axに折れ線グラフを描画

ax.set_xlabel("sepal_length")#x軸ラベルを指定
ax.set_ylabel("sepal_width")#y軸ラベルを指定
棒グラフ
geom_bar()関数 / Axes.bar()メソッド
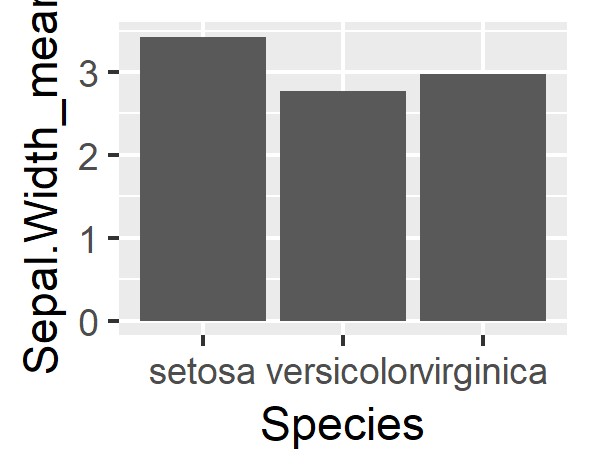
棒グラフを作成するためのデータとして、SpeciesごとのSepal.Widthの平均値をgroup_byにより作成する。
# R
df1 <-
  df %>%
  group_by(Species) %>%
  summarise(Sepal.Width_mean=mean(Sepal.Width))
df1
# R
  Species    Sepal.Width_mean
  <fct>                 <dbl>
1 setosa                 3.43
2 versicolor             2.77
3 virginica              2.97
# python
df2=\    #"\"を書くことで、コードの途中でも改行できる。
df.groupby("species").aggregate({"sepal_width":"mean"})
df2
# python
            sepal_width
species
setosa            3.428
versicolor        2.770
virginica         2.974
# ggplot
ggplot(data = df1,aes(x=Species,y=Sepal.Width_mean))+
  geom_bar(stat = "identity")
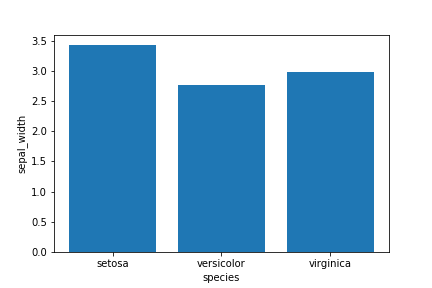
# matplotlib
fig=plt.figure()#pyplot.figureクラスをインスタンス化
ax=fig.add_subplot(1,1,1)#1行1列のサブプロットを作成し、1番目にaxを配置
x=[1,2,3]#x座標を与える
y=[df2.query("species=='setosa'").sepal_width,\
   df2.query("species=='versicolor'").sepal_width,\
   df2.query("species=='virginica'").sepal_width]#y軸の値を与える
labels=["setosa","versicolor","virginica"]
ax.bar(x,y,tick_label=labels)##axに棒グラフを描画し、x座標をlabelsに置き換える
ax.set_xlabel("species")#x軸ラベルを指定
ax.set_ylabel("sepal_width")#y軸ラベルを指定

plt.show()
随時更新していきます。2018/10/24
[参考文献]
Pythonによるデータ分析入門 第2版 ―NumPy、pandasを使ったデータ処理
Pythonデータサイエンスハンドブック ―Jupyter、NumPy、pandas、Matplotlib、scikit-learnを使ったデータ分析、機械学習
PythonユーザのためのJupyter[実践]入門
Rグラフィックスクックブック ―ggplot2によるグラフ作成のレシピ集
Rではじめるデータサイエンス
Tidyverse