はじめに
OCI(Oracle Cloud Infrastructure)には、クラウド上のリソースのメトリックを収集して監視を行うためのサービスが提供されています。以下の2種類のサービスを組み合わせることで実現が出来ます。
- Monitoring : リソースのメトリック収集、及び、アラームの定義
- Notifications : メールなどへの通知
CPU使用率のアラームを定義後、CPUの負荷を掛けることで、正常にメールで通知されるかを確認します。
事前準備
Compute Instance 作成
以下の名前のCompute Instance を、CentOS7で作成します。
- Web 1
OracleCloudAgentの確認
OCI で提供されている Compute Instance のイメージに、メトリックを収集するための OracleCloudAgent が Install されています。
イメージ持ち込みなどで Agent が導入されていない場合は、AgentをInstallする必要があります。以下のDocumentにインストール方法が記載されています。
SSHでインスタンスにログインします。systemdで管理されている OracleCloudAgentが稼働しています
[opc@web-1 ~]$ systemctl status oracle-cloud-agent
● oracle-cloud-agent.service - Oracle Cloud Infrastructure agent for management and monitoring
   Loaded: loaded (/etc/systemd/system/oracle-cloud-agent.service; enabled; vendor preset: disabled)
   Active: active (running) since Wed 2019-08-07 10:07:01 GMT; 1 weeks 0 days ago
     Docs: https://docs.cloud.oracle.com/iaas/
 Main PID: 2377 (oracle-cloud-ag)
   CGroup: /system.slice/oracle-cloud-agent.service
           ├─2377 /usr/sbin/oracle-cloud-agent
           └─2387 /usr/sbin/oracle-cloud-agent

Aug 07 10:07:01 web-1 systemd[1]: Started Oracle Cloud Infrastructure agent for management and monitoring.
systemd の設定ファイルを確認します
[opc@web-1 ~]$ cat /etc/systemd/system/oracle-cloud-agent.service
# coding: utf-8
# Copyright (c) 2019 Oracle and/or its affiliates.
# Licensed under the Universal Permissive License v 1.0 as shown at http://oss.oracle.com/licenses/upl.

# Service config file for Oracle Compute-Experience Metrics Agent

[Unit]
Description=Oracle Cloud Infrastructure agent for management and monitoring
Documentation=https://docs.cloud.oracle.com/iaas/
After=local-fs.target network-online.target
Requires=local-fs.target network-online.target

[Service]
PermissionsStartOnly=True
RuntimeDirectory=oracle-cloud-agent
RuntimeDirectoryMode=0700
WorkingDirectory=/var/lib/oracle-cloud-agent/
ExecStart=/usr/sbin/oracle-cloud-agent
User=oracle-cloud-agent
Group=oracle-cloud-agent
ProtectHome=true

# Tell systemd it will receive a notification from collectd over it's control
# socket once the daemon is ready. See systemd.service(5) for more details.
Type=simple

# Restart the process when it fails.
Restart=always
RestartSec=15

[Install]
WantedBy=multi-user.target
設定ファイルを確認します。metric_emitting_interval が 10 となっているため、10秒間隔でMetricを Oracle Cloud Infrastructure へ送付していることがわかります。
[opc@web-1 ~]$ cat /etc/oracle-cloud-agent/config.yml
agent:
  metric_emitting_interval: 10
  update_interval: 3600
  upgrade_interval: 7200
  heartbeat_interval: 3600
  log_dir:
    linux: /var/log/oracle-cloud-agent
    windows: '%LOCALAPPDATA%\OracleCloudAgent'
  cache_dir:
    linux: /var/lib/oracle-cloud-agent
    windows: '%LOCALAPPDATA%\OracleCloudAgent'
  repos:
  - url: 'https://objectstorage.us-phoenix-1.oraclecloud.com/n/oci-i3/b/agents/o/'
    region: us-phoenix-1
  - url: 'https://objectstorage.eu-frankfurt-1.oraclecloud.com/n/oci-i3/b/agents/o/'
    region: eu-frankfurt-1
  - url: 'https://objectstorage.us-ashburn-1.oraclecloud.com/n/oci-i3/b/agents/o/'
    region: us-ashburn-1
  - url: 'https://objectstorage.uk-london-1.oraclecloud.com/n/oci-i3/b/agents/o/'
    region: uk-london-1
logging:
  agent:
    formatters:
      simple:
        format: '%(asctime)s - %(levelname)s - %(message)s'
    handlers:
      agent_rotating_file:
        backupCount: 5
        class: logging.handlers.RotatingFileHandler
        delay: false
        encoding: utf-8
        filename: agent.log
        formatter: simple
        maxBytes: 5242880
    loggers:
      agent:
        handlers:
        - agent_rotating_file
        level: INFO # Change the level to DEBUG to enable debug logging of the agent
        propagate: true
    version: 1
  updater:
    formatters:
      simple:
        format: '%(asctime)s - %(levelname)s - %(message)s'
    handlers:
      updater_rotating_file:
        backupCount: 5
        class: logging.handlers.RotatingFileHandler
        delay: false
        encoding: utf-8
        filename: updater.log
        formatter: simple
        maxBytes: 5242880
    loggers:
      updater:
        handlers:
        - updater_rotating_file
        level: INFO # Change the level to DEBUG to enable debug logging of the updater
        propagate: true
    version: 1
telemetry:
  endpoint_format: 'https://telemetry-ingestion.{}.oraclecloud.com'
  endpoint_path: /20180401/metrics
  submission_headers:
    accept: application/json
    content-type: application/json
  get_headers:
    accept: application/json
  metrics:
  - friendly_name: CPU Utilization
    name: CpuUtilization
    unit: Percent
    min_range: 0
    max_range: 100
  - friendly_name: Memory Utilization
    name: MemoryUtilization
    unit: Percent
    min_range: 0
    max_range: 100
  - friendly_name: Network Receive Bytes
    name: NetworksBytesIn
    unit: Bytes
  - friendly_name: Network Transmit Bytes
    name: NetworksBytesOut
    unit: Bytes
  - friendly_name: Disk Read Bytes
    name: DiskBytesRead
    unit: Bytes
  - friendly_name: Disk Write Bytes
    name: DiskBytesWritten
    unit: Bytes
  - friendly_name: Disk Read I/O
    name: DiskIopsRead
    unit: Operations
  - friendly_name: Disk Write I/O
    name: DiskIopsWritten
    unit: Operations
  perfmon:
    metrics:
    - path: \Processor(_Total)\% Processor Time
      telemetry_metric_name: CpuUtilization
      type: double
    - path: \Memory\% Committed Bytes In Use
      telemetry_metric_name: MemoryUtilization
      type: double
    - path: \PhysicalDisk(_Total)\Disk Reads/sec
      telemetry_metric_name: DiskIopsRead
      type: raw
    - path: \PhysicalDisk(_Total)\Disk Writes/sec
      telemetry_metric_name: DiskIopsWritten
      type: raw
    - path: \PhysicalDisk(_Total)\Disk Read Bytes/sec
      telemetry_metric_name: DiskBytesRead
      type: raw
    - path: \PhysicalDisk(_Total)\Disk Write Bytes/sec
      telemetry_metric_name: DiskBytesWritten
      type: raw
    - path: \Network Interface(*)\Bytes Received/sec
      telemetry_metric_name: NetworksBytesIn
      type: raw
    - path: \Network Interface(*)\Bytes Sent/sec
      telemetry_metric_name: NetworksBytesOut
      type: raw
Notificationの設定(メール送付の設定)
OCIのメニューから、Application Integration > Notifications へ移動
Create Topic をクリックし、以下のパラメータを入力
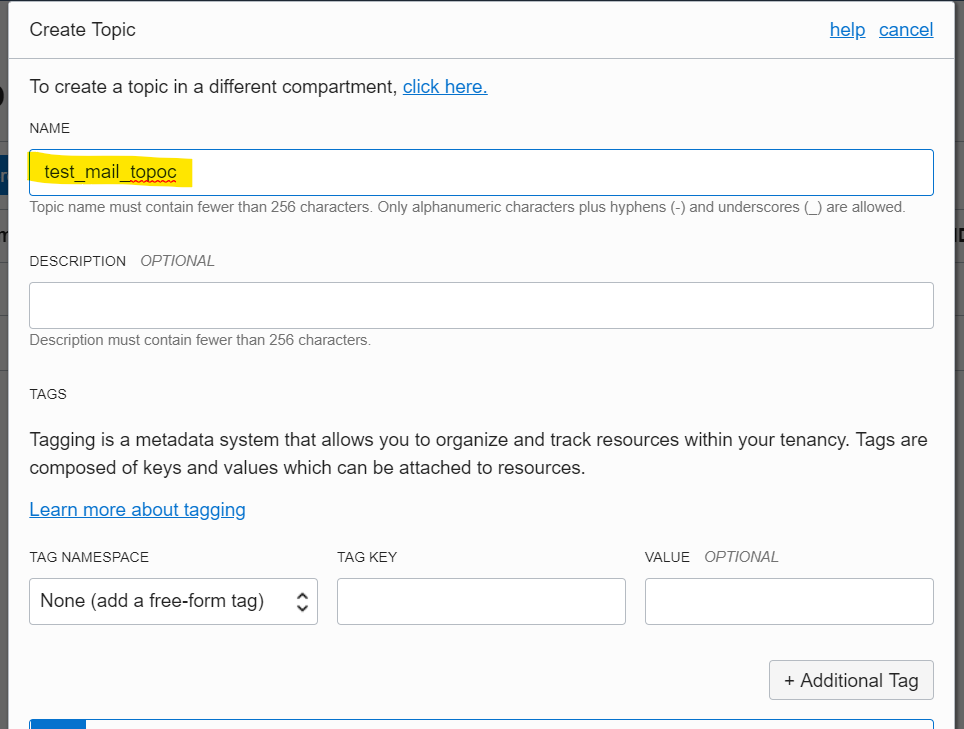
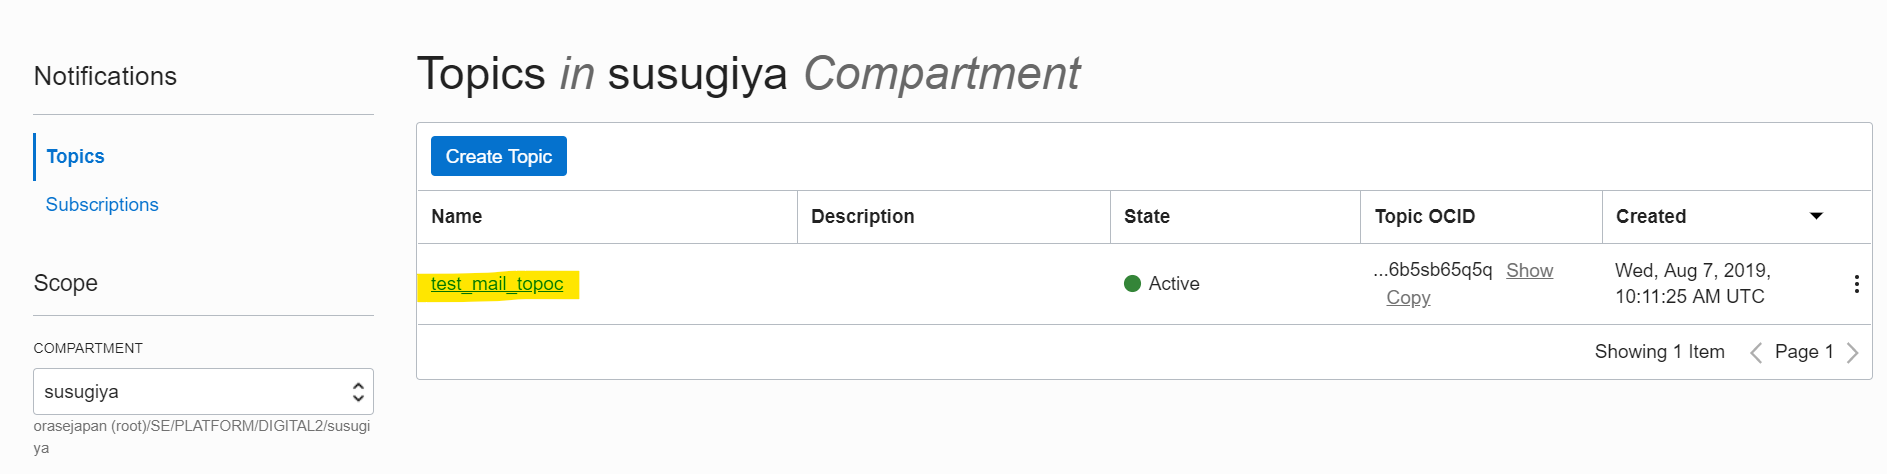
Topic が作成されたため、青い文字をクリックして詳細画面へ移動
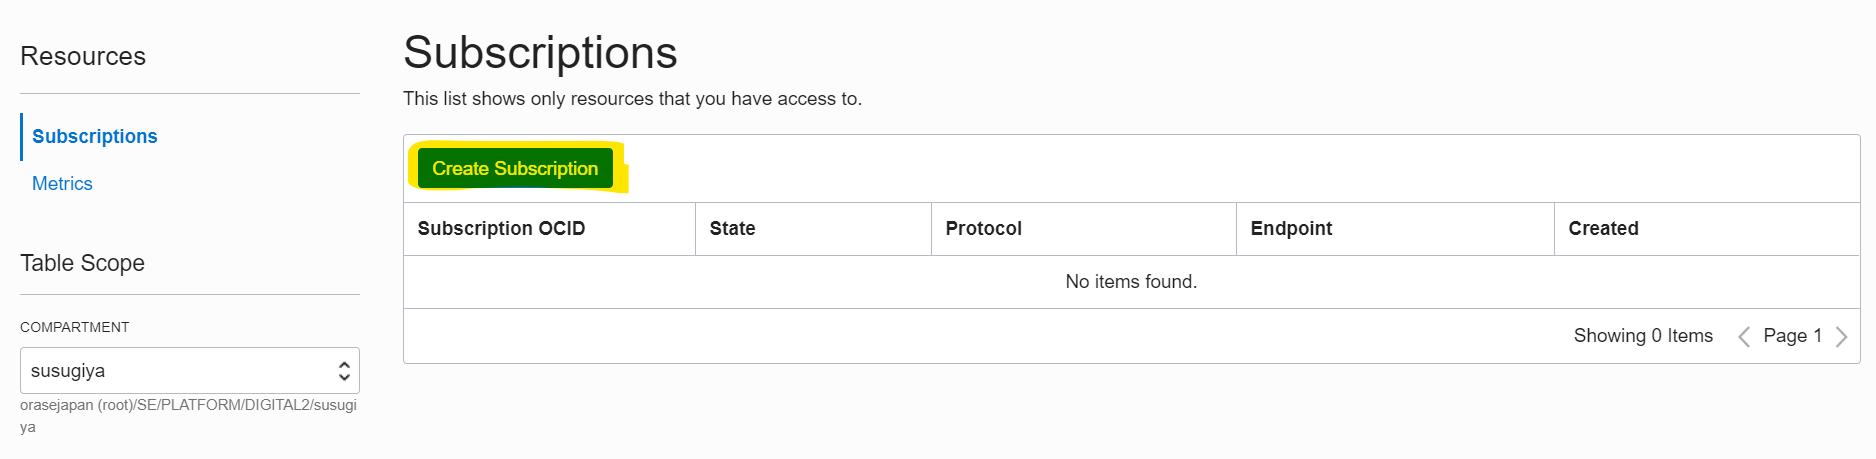
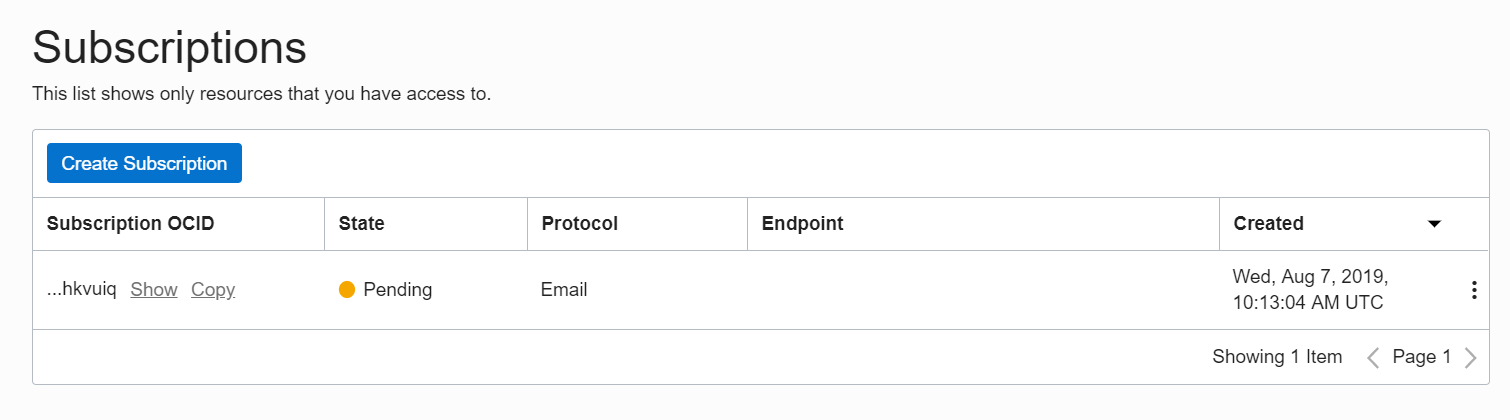
作成したTopic内で、Subscriptionを作成します。Create Subscriptionを押します。
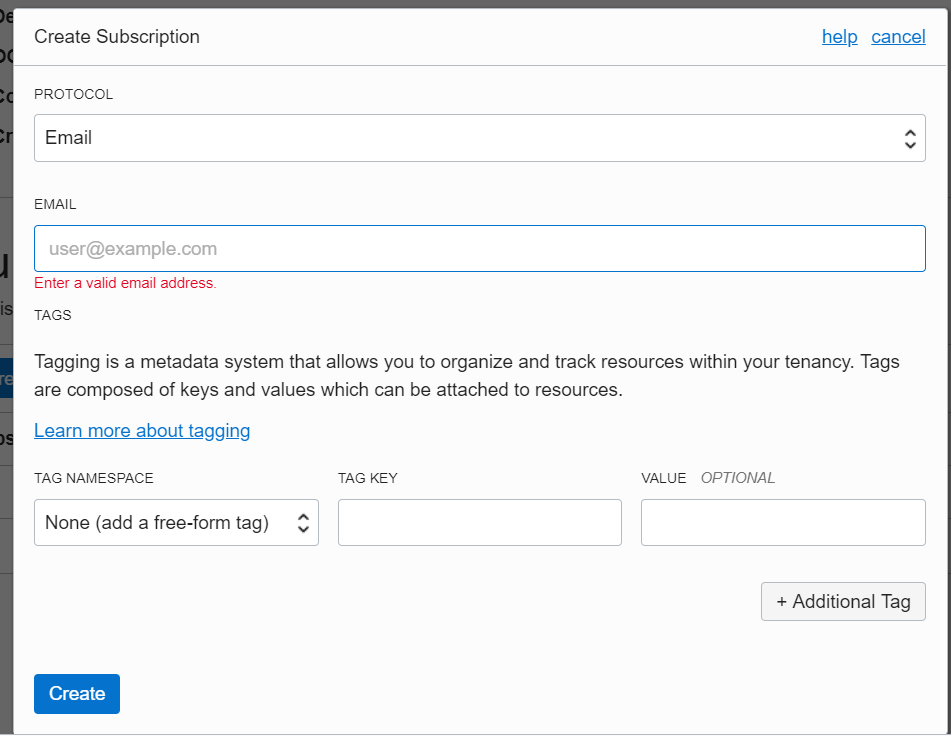
以下のパラメータを入力して、Createを押します
- PROTOCOL : Email
- EMAIL : 通知先のメールアドレスを指定
画面が切り替わり、StateがPendingになります。
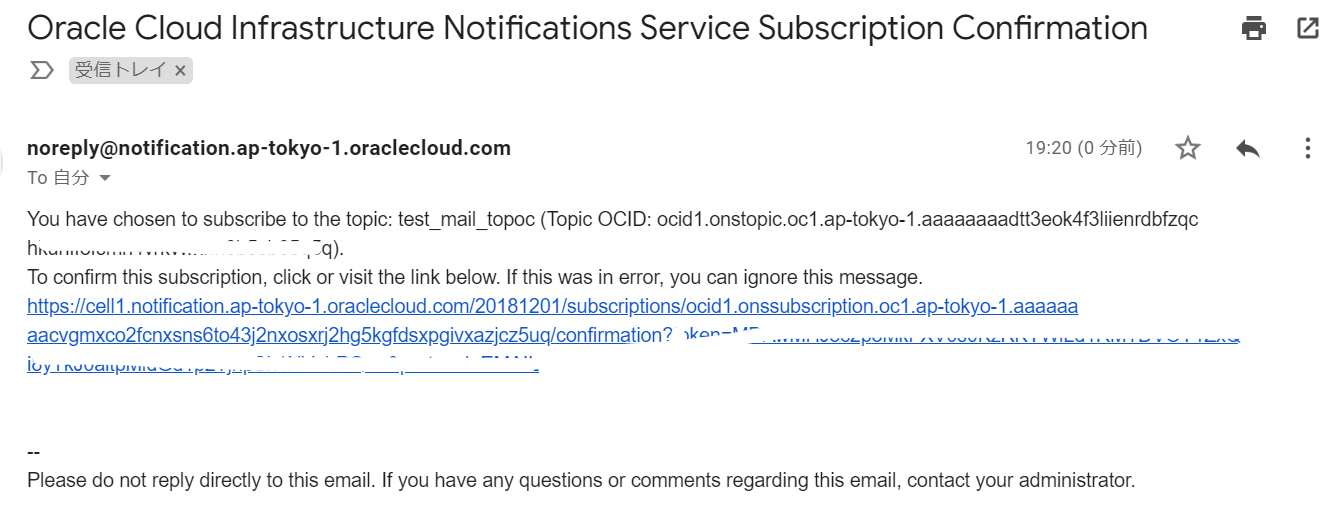
指定したメールアドレス宛に、確認メールが自動的に送付されます。メール内部のHTTPリンクを押して確認を行います。
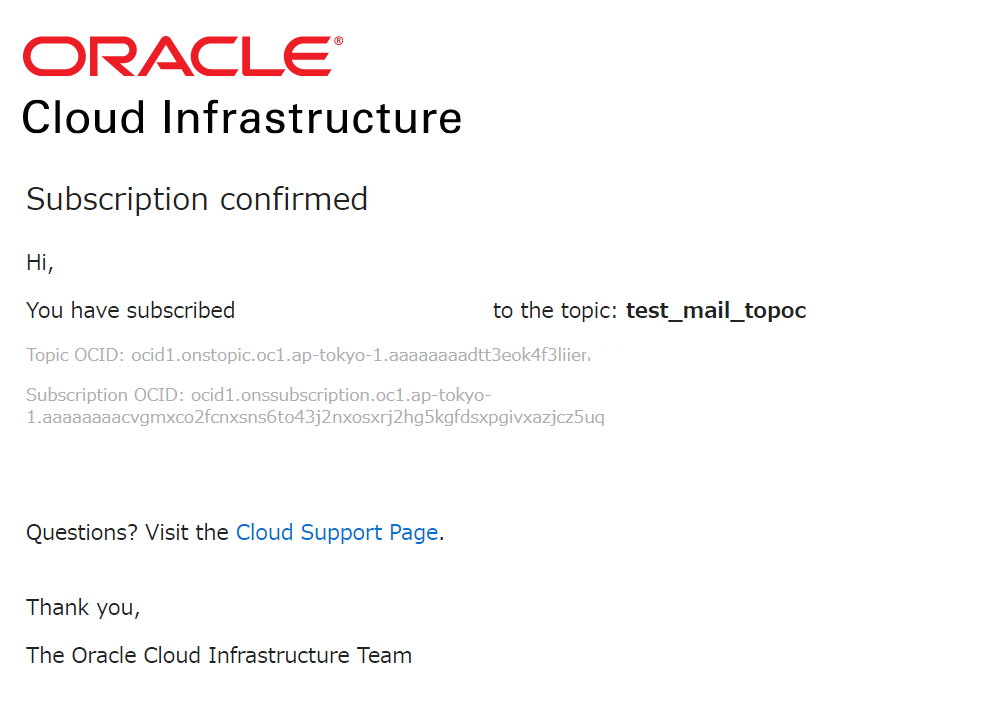
Confirm (確認) が出来ました。
Alarm
OCIのメニューから、Monitoring > Alarm Definitionsへ移動します。
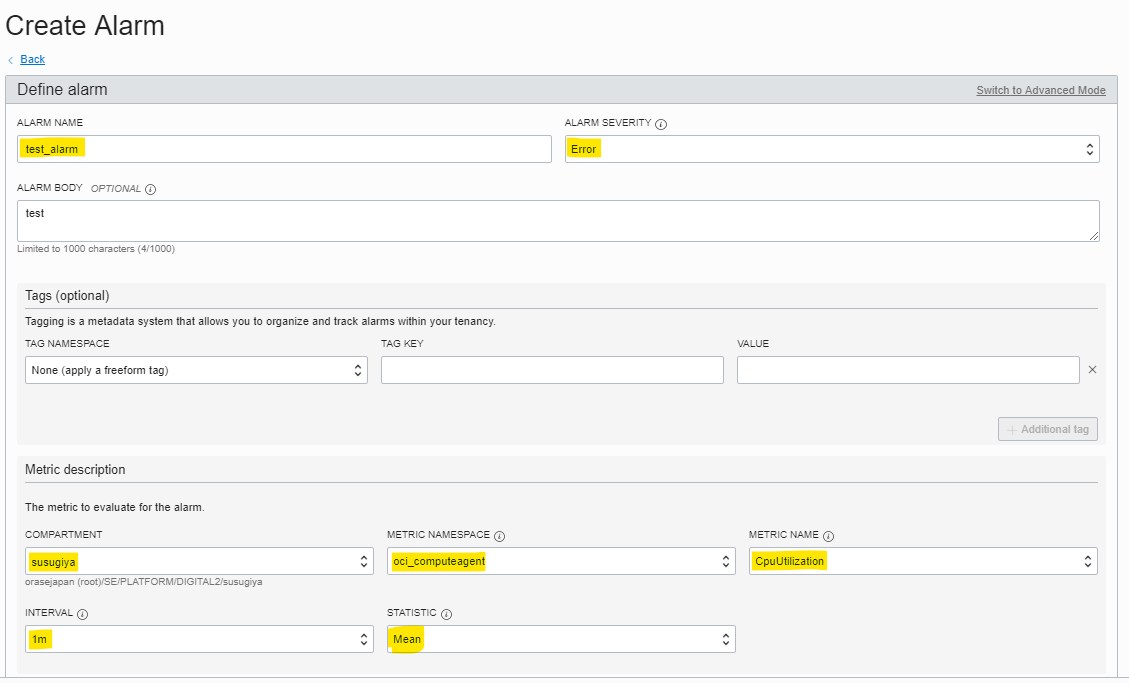
Create Alarmボタンを押して、アラームの定義を行います。
以下のパラメータを入力
- ALARM NAME : アラームの名前
- ALARM SEVERITY : アラームの重要度を定義。Info, Warning, Error, Critical の4つのなかから選択
- COMPARTMENT : コンパーメントの指定
- METRIC NAMESPACE : 対象とするサービスの指定。今回は、Compute Instance の CPU 使用率をターゲットとするため、
oci_computeagentを指定 - METRIC NAME : 対象とするメトリックを指定。 今回は、CPU使用率を表す
CpuUtilizationを指定 - INTERVAL : OCIで収集しているメトリックを、どの単位で集約するかのインターバル期間を指定。最小の
1mと指定すると、10秒ごとに収集しているメトリックを6個集約 = 10秒x6 = 1分 ということを意味する - STATISTIC : INTERVAL で指定した期間にあてはまるメトリックをどのように表現するかを指定。
Meanは平均値ということになり、6個のメトリックを平均した値を使用する
STATISTIC の意味が記載されている Documentはこちら
https://docs.cloud.oracle.com/iaas/Content/Monitoring/Reference/mql.htm#statistic
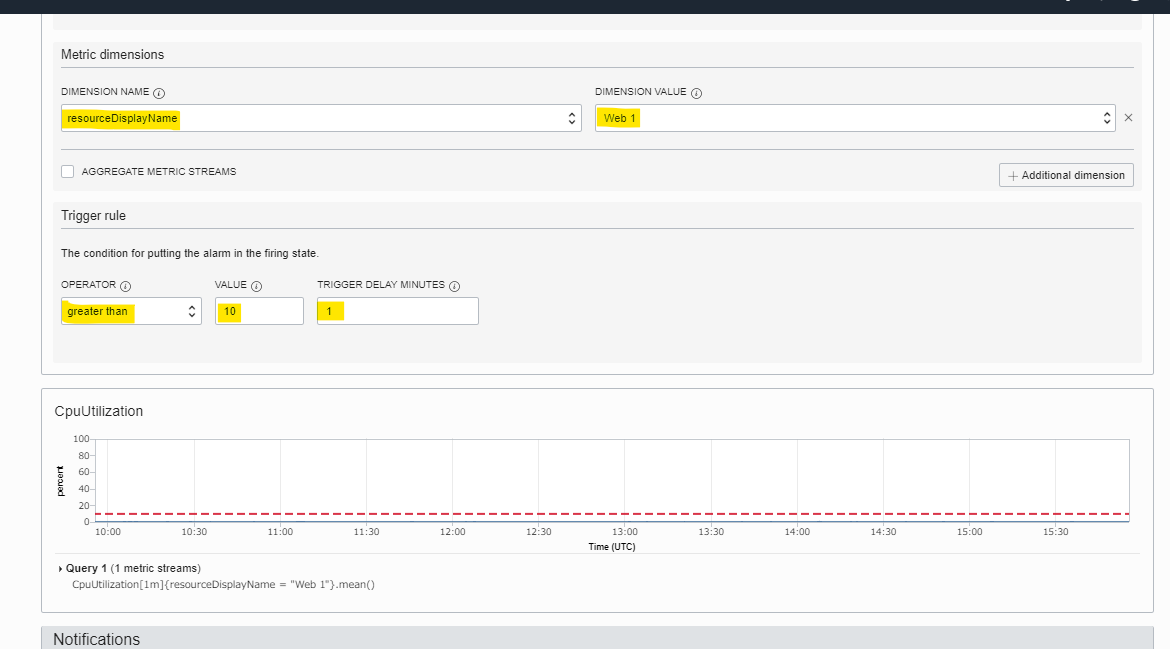
以下のパラメータを指定します
- Metric dimensions
- DIMENSION NAME : どのCompute Instanceを対象にするかを指定。
resourceDisplayNameを指定することで、特定の名前を持つインスタンスを対象にすることが出来る - DIMENSION VALUE : DIMENSION NAME に紐づく値を指定。作成したインスタンス
Web 1と指定
- DIMENSION NAME : どのCompute Instanceを対象にするかを指定。
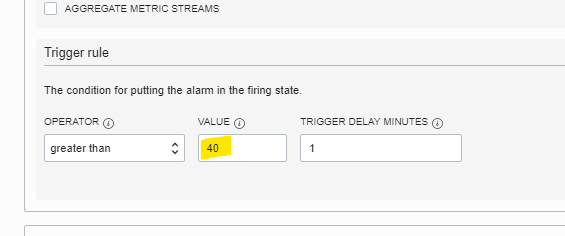
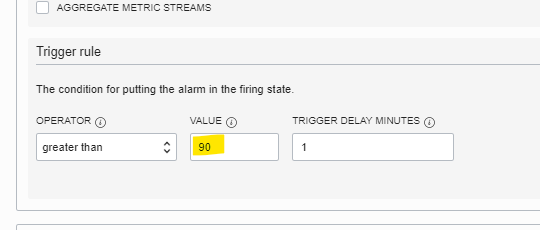
- Trigger rule : アラームを発行するときの条件の指定
- OPERATOR : CPU使用率を考えると、特定の値より大きい場合にアラートを発行したいため、
greater thanと指定 - VALUE : 特定の値の指定。10を指定することで、10%以上の使用率の場合はアラートとする
- TRIGGER DELAY MINUTES : アラーム状態と判定するために、指定した条件を満たしている時間を指定。最小値は 1 となる。空白を指定しても 1 と認識されて処理がされる。
- OPERATOR : CPU使用率を考えると、特定の値より大きい場合にアラートを発行したいため、
トリガー発行時に起動する Notifications の Topic を指定します。
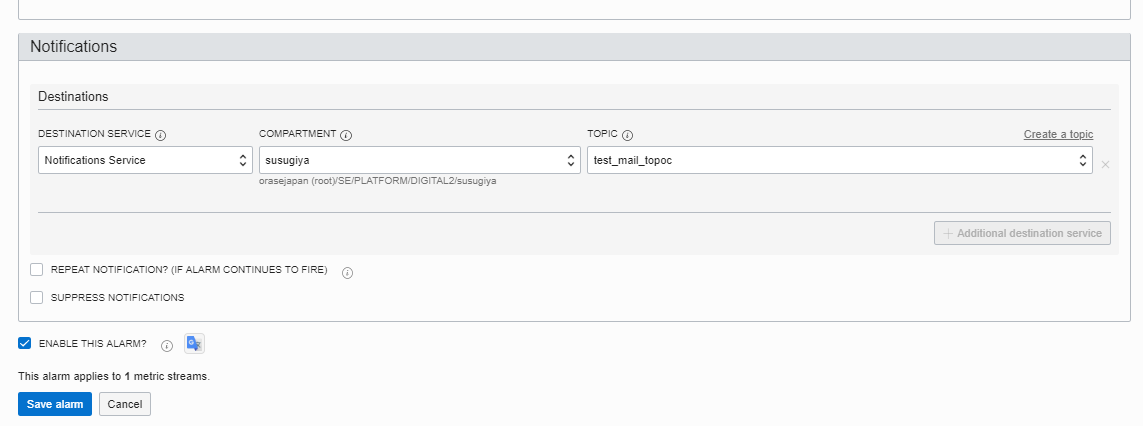
設定完了
CPUの負荷を上げてアラーム発行のテスト
Web 1 に SSHログインし、ストレスコマンドをインストール
yum install -y stress
ストレスコマンドを実行
stress --cpu 2 --timeout 10m
dstat でCPU使用率が、全て100となっていることを確認。
[root@web-1 ~]# dstat
You did not select any stats, using -cdngy by default.
----total-cpu-usage---- -dsk/total- -net/total- ---paging-- ---system--
usr sys idl wai hiq siq| read  writ| recv  send|  in   out | int   csw
  0   0 100   0   0   0| 573B 1057B|   0     0 |   0     0 | 124   235
100   0   0   0   0   0|   0     0 | 214B  972B|   0     0 |2054   176
100   0   0   0   0   0|   0     0 |  60B  342B|   0     0 |2032   172
100   0   0   0   0   0|   0     0 |  60B  342B|   0     0 |2044   181
100   0   0   0   0   0|   0     0 |  60B  342B|   0     0 |2079   212
100   0   0   0   0   0|   0     0 |6263B   11k|   0     0 |2048   181
100   0   0   0   0   0|   0     0 |  60B  342B|   0     0 |2042   169
100   0   0   0   0   0|   0     0 |  60B  342B|   0     0 |2051   186
100   0   0   0   0   0|   0     0 |  60B  342B|   0     0 |2043   177
100   0   0   0   0   0|   0   764k|  60B  342B|   0     0 |2074   184
100   0   0   0   0   0|   0     0 | 120B  406B|   0     0 |2041   169
100   0   0   0   0   0|   0     0 |  60B  342B|   0     0 |2043   179
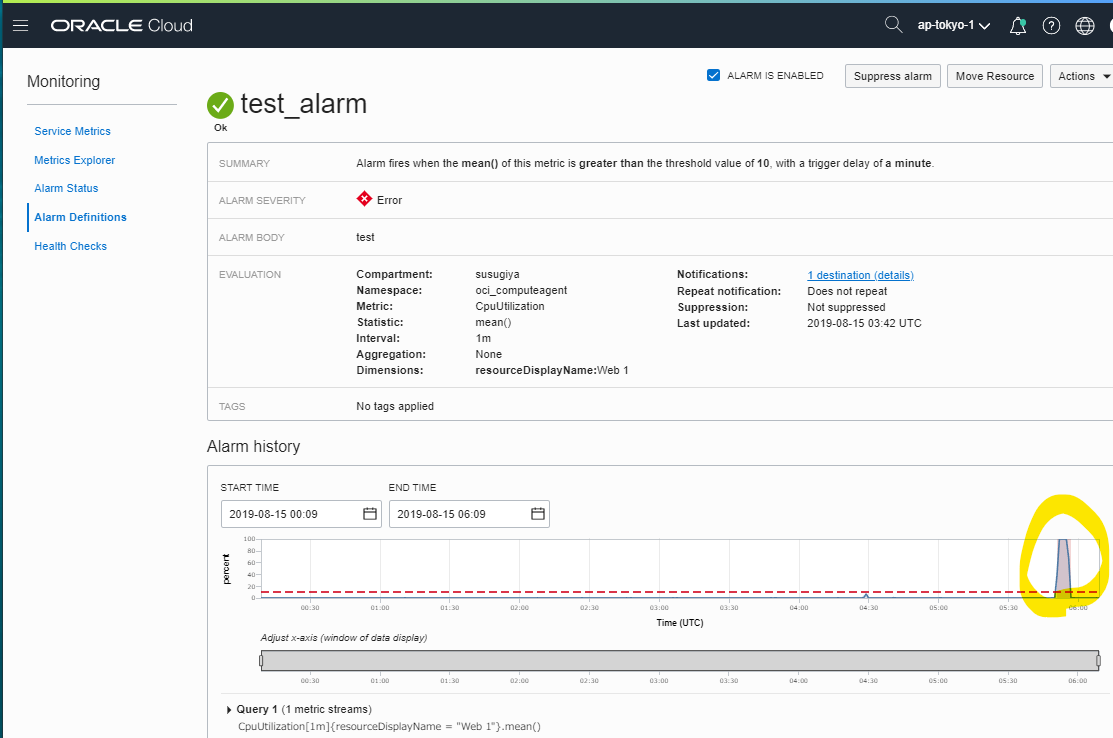
この時に、OCIコンソールのMonitoringのグラフも上がっています
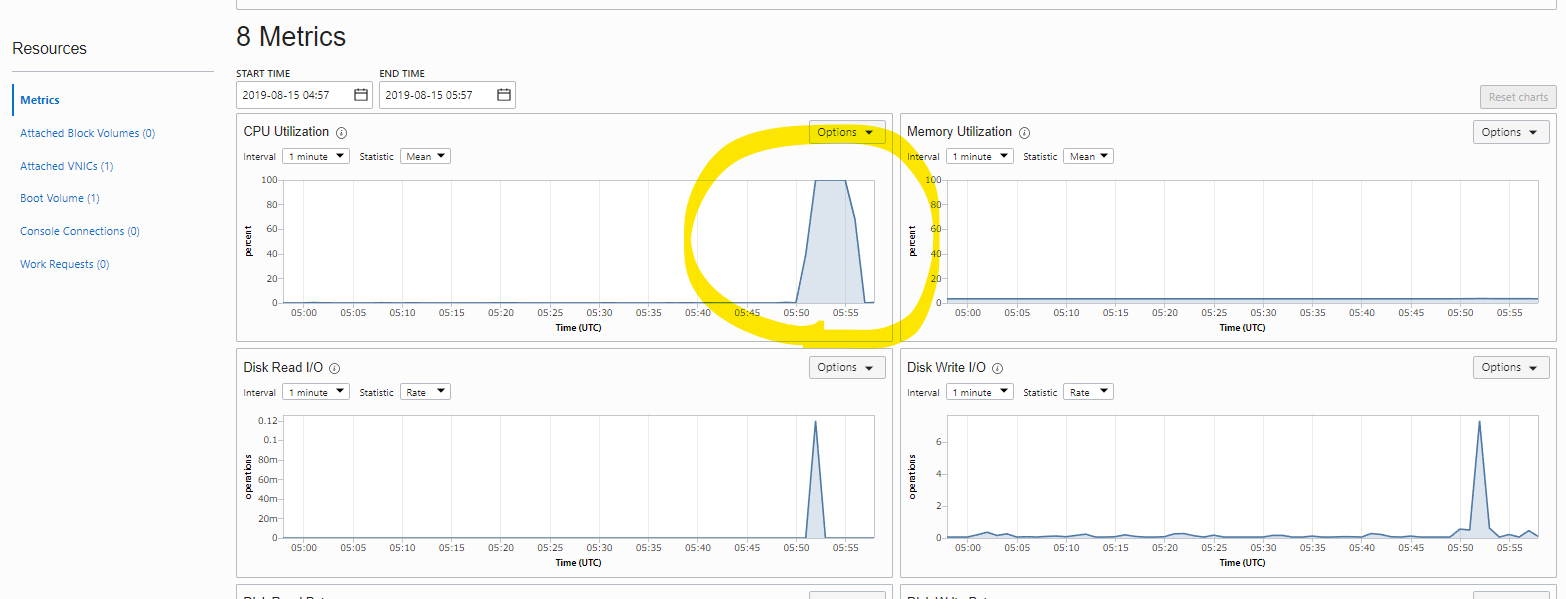
Alarm 設定画面上を見ると、閾値10を超えていることが確認できます
設定した閾値を超えた結果、NotificationsのTopic経由で、メールが送られてきています。
閾値を超えてから、メール到着するまでに3-4分ほど掛かりました
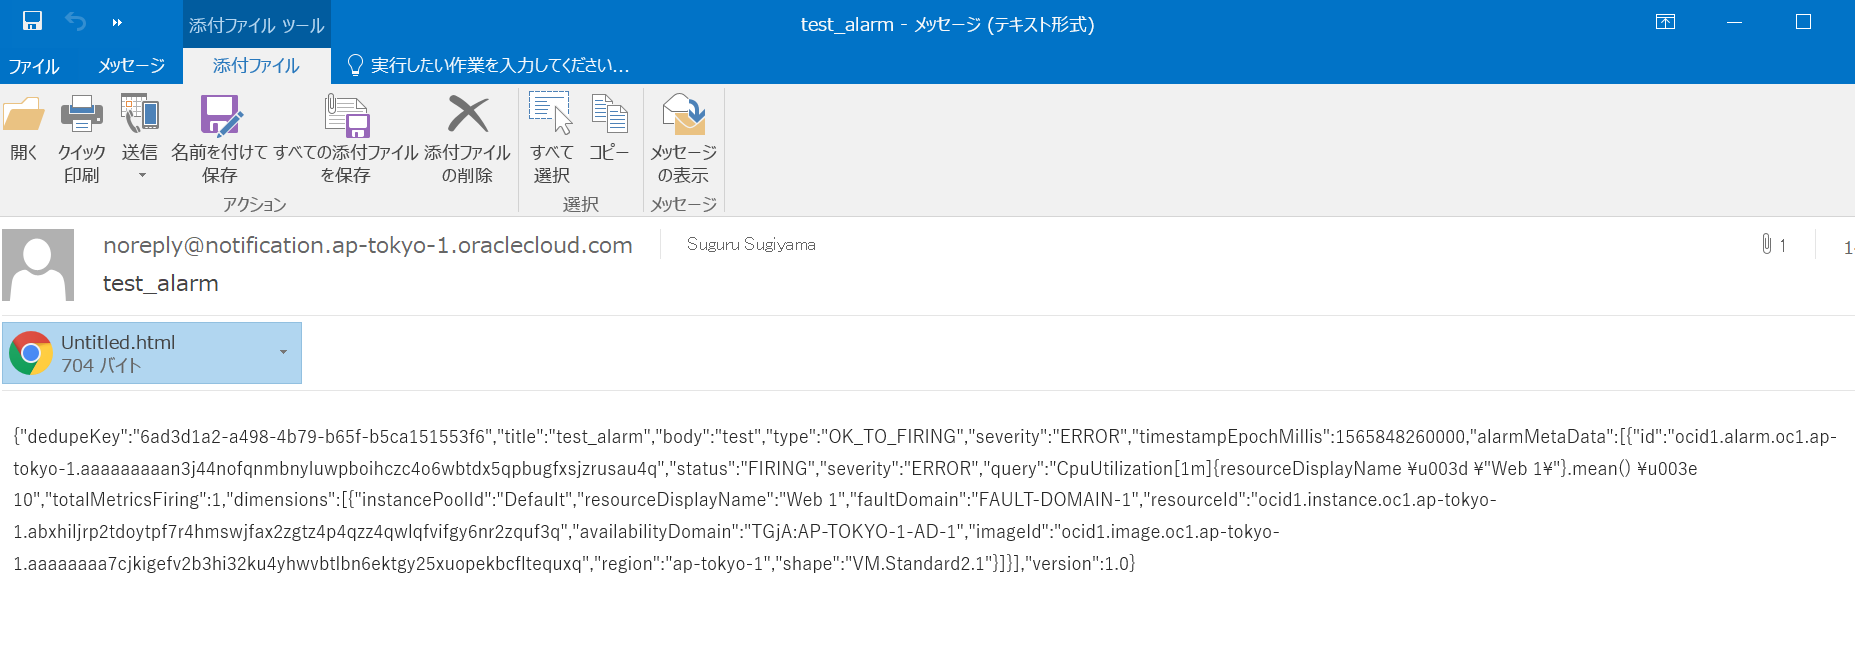
メールの中身はJSONとなっているため、JSONを整形します。TYPEが OK_TO_FIRING となっています。
{
    "dedupeKey": "6ad3d1a2-a498-4b79-b65f-b5ca151553f6",
    "title": "test_alarm",
    "body": "test",
    "type": "OK_TO_FIRING",
    "severity": "ERROR",
    "timestampEpochMillis": 1565848260000,
    "alarmMetaData": [
        {
            "id": "ocid1.alarm.oc1.ap-tokyo-1.aaaaaaaaan3j44nofqnmbnyluwpboihczc4o6wbtdx5qpbugfxsjzrusau4q",
            "status": "FIRING",
            "severity": "ERROR",
            "query": "CpuUtilization[1m]{resourceDisplayName = \"Web 1\"}.mean() > 10",
            "totalMetricsFiring": 1,
            "dimensions": [
                {
                    "instancePoolId": "Default",
                    "resourceDisplayName": "Web 1",
                    "faultDomain": "FAULT-DOMAIN-1",
                    "resourceId": "ocid1.instance.oc1.ap-tokyo-1.abxhiljrp2tdoytpf7r4hmswjfax2zgtz4p4qzz4qwlqfvifgy6nr2zquf3q",
                    "availabilityDomain": "TGjA:AP-TOKYO-1-AD-1",
                    "imageId": "ocid1.image.oc1.ap-tokyo-1.aaaaaaaa7cjkigefv2b3hi32ku4yhwvbtlbn6ektgy25xuopekbcfltequxq",
                    "region": "ap-tokyo-1",
                    "shape": "VM.Standard2.1"
                }
            ]
        }
    ],
    "version": 1
}
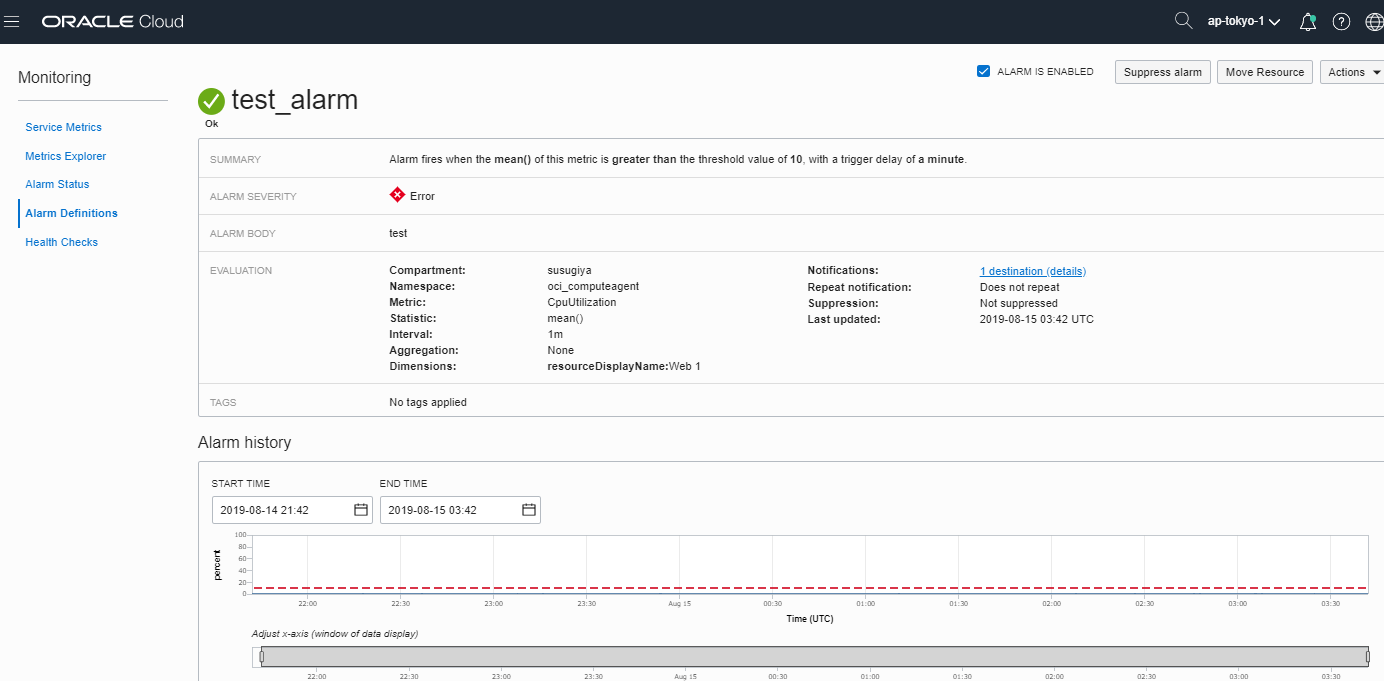
負荷を解除後、Alarm Definitions を見ると、アラームステータス遷移の履歴が見えます
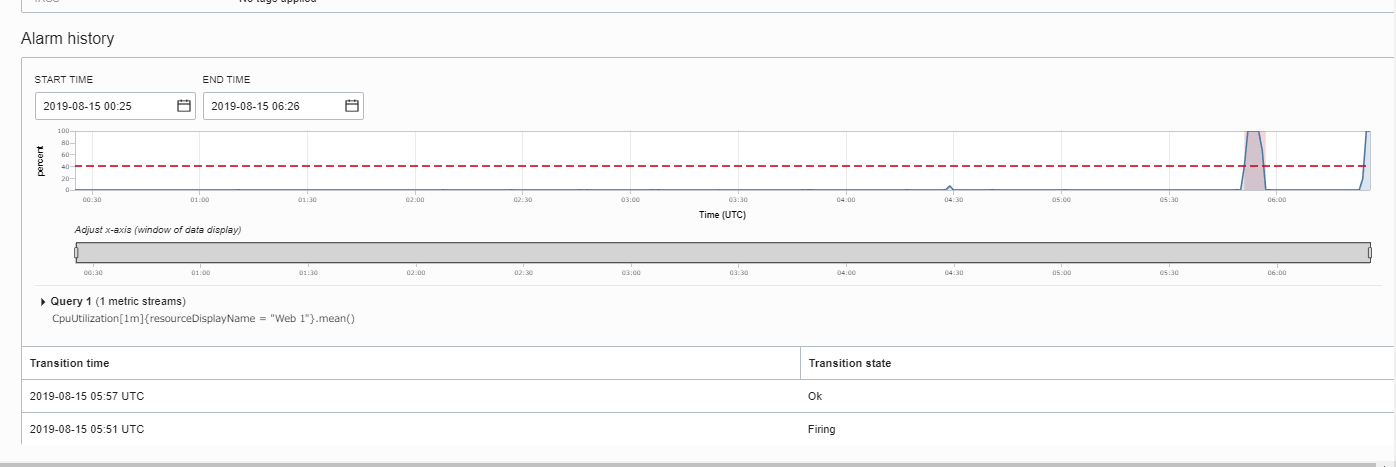
Error から OK のステータスに変更したタイミングでもメールが送付されます。TYPEが FIRING_TO_OK となっている
{
    "dedupeKey": "6ad3d1a2-a498-4b79-b65f-b5ca151553f6",
    "title": "test_alarm",
    "body": "test",
    "type": "FIRING_TO_OK",
    "severity": "ERROR",
    "timestampEpochMillis": 1565848620000,
    "alarmMetaData": [
        {
            "id": "ocid1.alarm.oc1.ap-tokyo-1.aaaaaaaaan3j44nofqnmbnyluwpboihczc4o6wbtdx5qpbugfxsjzrusau4q",
            "status": "OK",
            "severity": "ERROR",
            "query": "CpuUtilization[1m]{resourceDisplayName = \"Web 1\"}.mean() > 10",
            "totalMetricsFiring": 0,
            "dimensions": []
        }
    ],
    "version": 1
}
他の閾値のテスト
確認のため、閾値40, 90 でもやってみて、アラート通知がされたことを確認
参考URL