何回やっても忘れるのでメモ
ヒートマップ
ヒートマップ(ヒートマップとは言っていない(pm3d))
# 出力先は1280x720pxのpngファイル
set terminal pngcairo size 1280,720
# 出力ファイルを指定
set output '/path/to/output.png'

# 軸ラベル
set xlabel 'x axis'
set ylabel 'y axis'
set zlabel 'z axis'

# 範囲指定
set xrange [0:100]
set yrange [0:1000]
set zrange [0:1000]

# 見えないところを処理しない
set hidden3d
# 離散データを連続として扱う
set dgrid3d 100,100,10

# 3D色付きマップ
set pm3d map
# グリッドの左上を色にする(初期値は4つ角の平均)
set pm3d corners2color c1
# 色補間の分解能
set pm3d interpolate 5,5
# 上から見る
set view 0,0

# 色軸を白青赤黄に
set palette defined(0"#ffffff",1"#0000ff",2"#ff0000",3"#ffff00")

splot exp(-(x*x + y*y) / 2)
これで↓みたいなグラフが作れます。
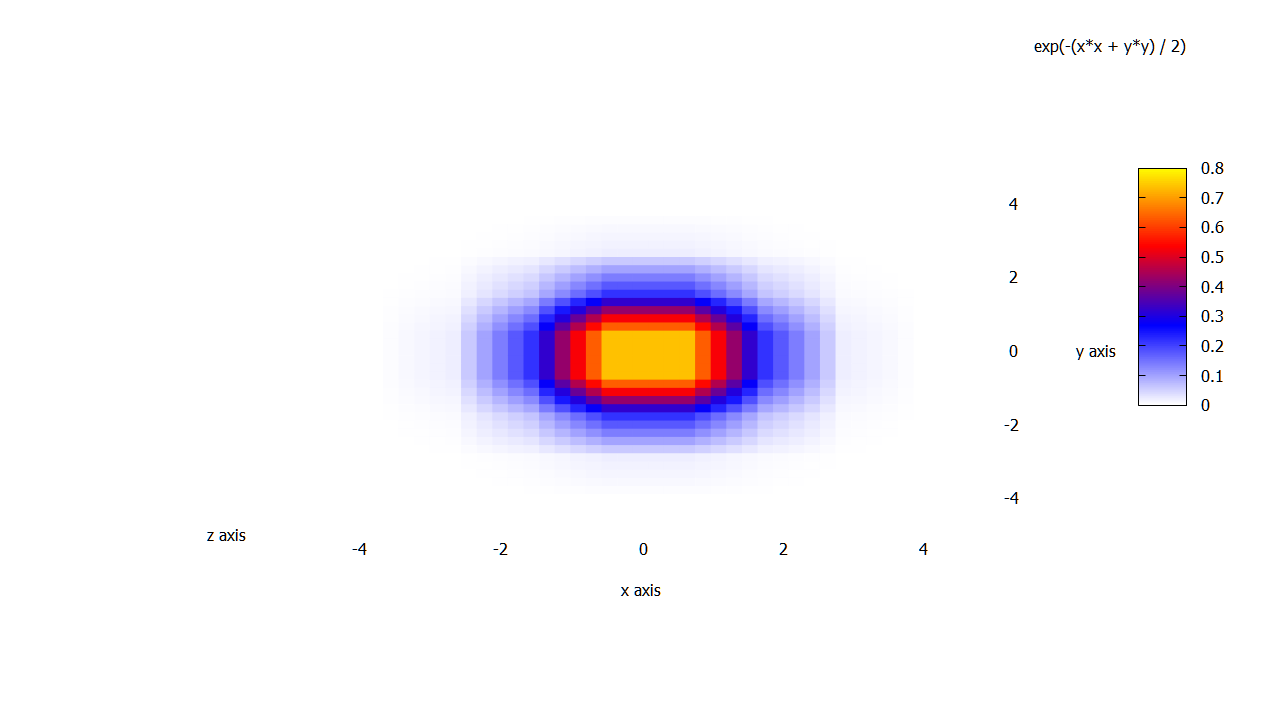
たぶんz=0のときの白で目盛りが消えてる気がする…?
あとY軸ラベルが右に表示されるのはなんなんだ
箱ひげ図
四分位図?boxplot?
を作ります。
# 出力先は1280x720pxのpngファイル
set terminal pngcairo size 1280,720
# 出力ファイルを指定
set output '/path/to/output.png'

# 軸ラベル
set xlabel 'x axis'
set ylabel 'y axis'

# 例外点を作らない
set style boxplot fraction 1

# using (x座標):データの列:(箱の幅(0のときデフォルト値)):データ区分の列
plot '/path/to/data.tsv' using (1.0):2:(0):1 with boxplot
これで↓みたいなグラフが作れます。
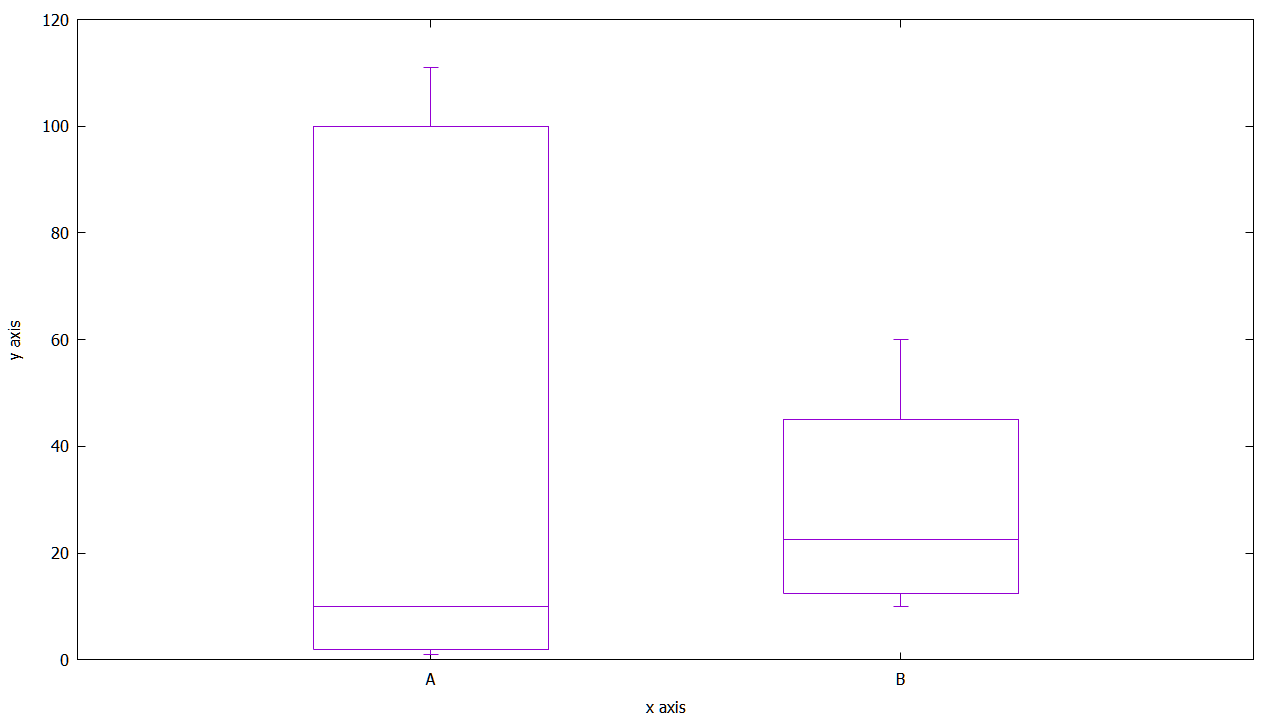
(テストデータが適当過ぎた)
幅はset boxwidthで決められます。
参考文献
pm3d
- http://www-ise2.ist.osaka-u.ac.jp/~shinkai/gnuplot/
- http://takeno.iee.niit.ac.jp/~foo/gp-jman/data/20111114/gnuplot-ja-div/node246.html