-
Windows10環境でAnaconda、Pycharmインストール・設定トライ(1)
https://qiita.com/suJiJi/items/665f24b823506df0b5ab
の続き -
PyCharmのインストール
ちょっとした苦労あり。何度もインストールし直してようやくできた。よく解説したサイトがないように思われる。
PyCharmをダウンロードして、気軽にnext.......とやってインストールするのだが、Anacondaをインストールしたのに、numpy、matplotlibなどがimportできない事象がでた。
どうも、AnacondaとPyCharm間の連携がうまくできていないのだな、と分かったが色々調べて、次のサイトで、合点がいった。
Getting numpy to import in Python (Pycharm), Anaconda installed
2.1 PyCharm のダウンロード
PyCharm のダウンロードページにアクセスし、Community 版をダウンロード。
https://www.jetbrains.com/pycharm/download/#section=windows
Community
2.2 PyCharm のインストール
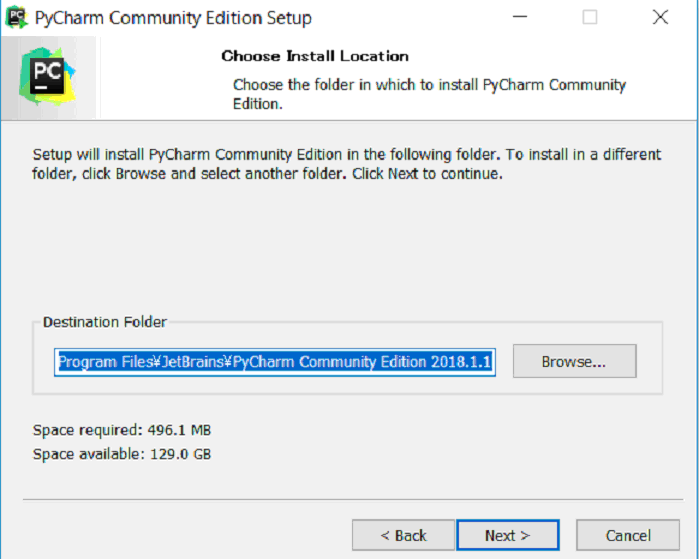
ダウンロードしたインストーラを開く。
Next
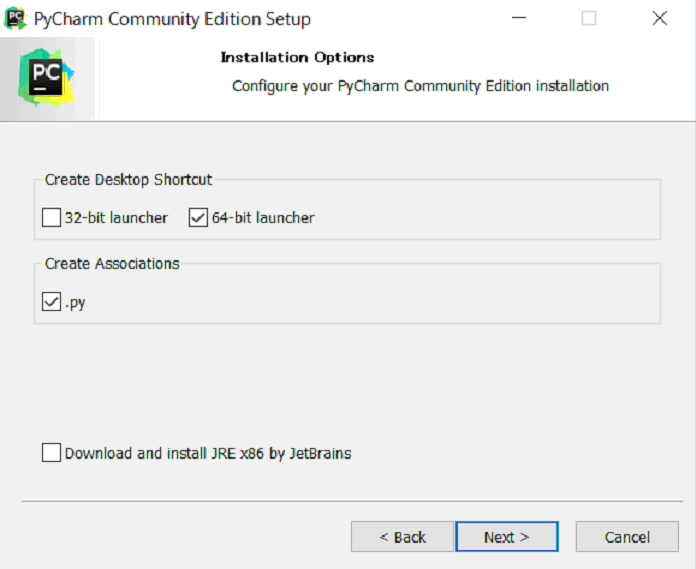
64-bit launcher、Create Associationsにチェック
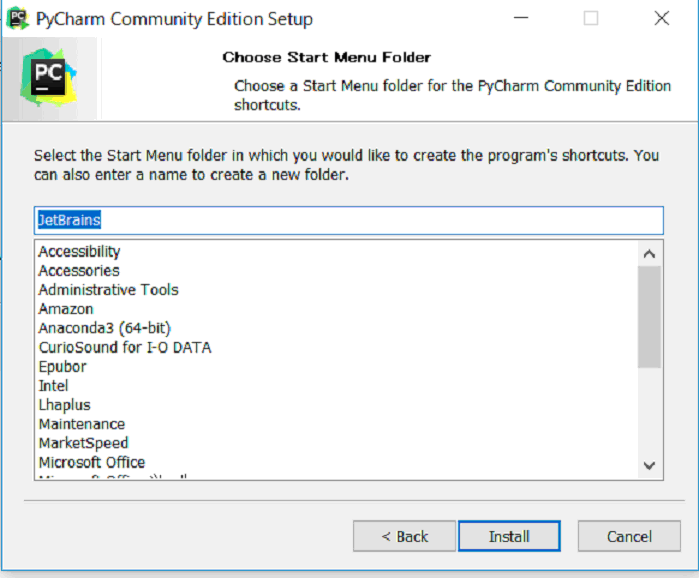
Install
Run PyCharm Community Editionにチェック、Finish
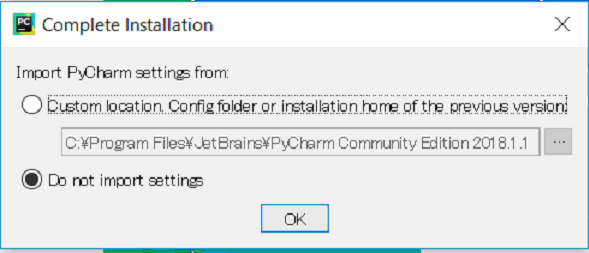
Do not import setteings選択
OK
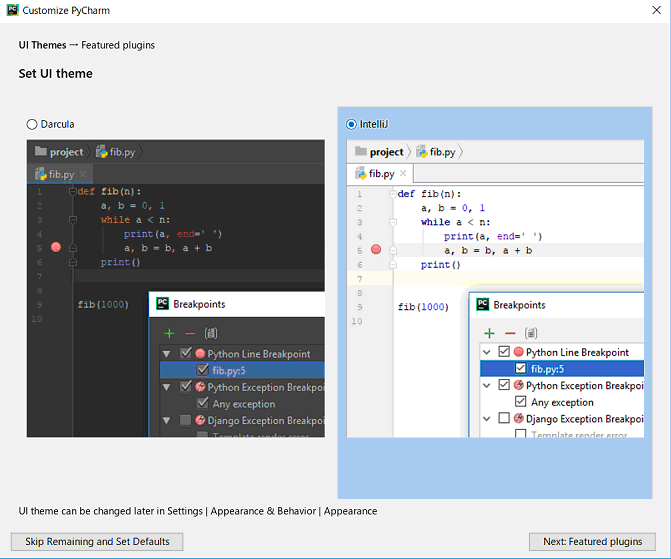
IntelliJ選択(Darculaでも良い、好みによる)、Next Featured plugins
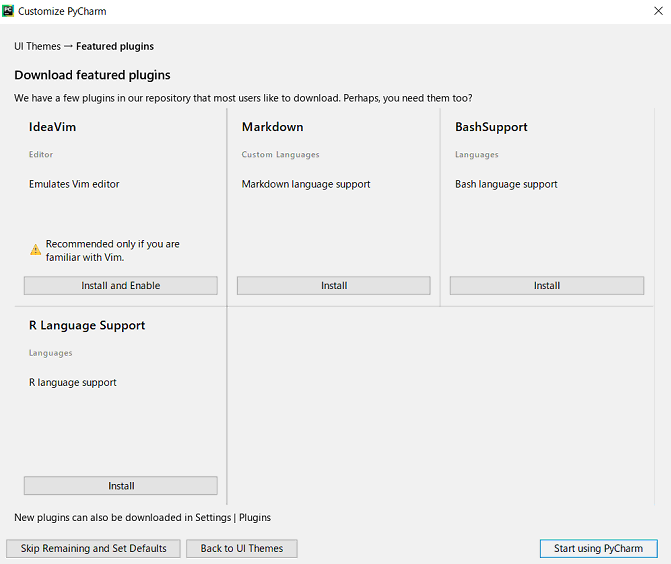
そのまま、Start using PyCharm
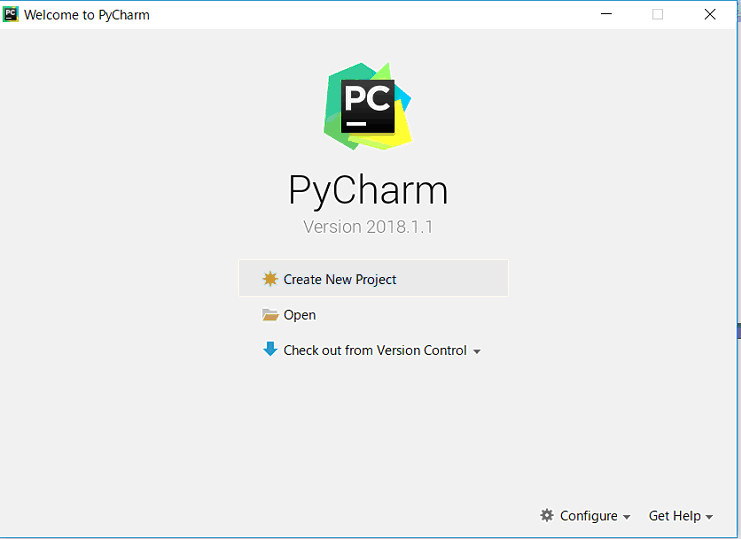
Create New Projectクリック
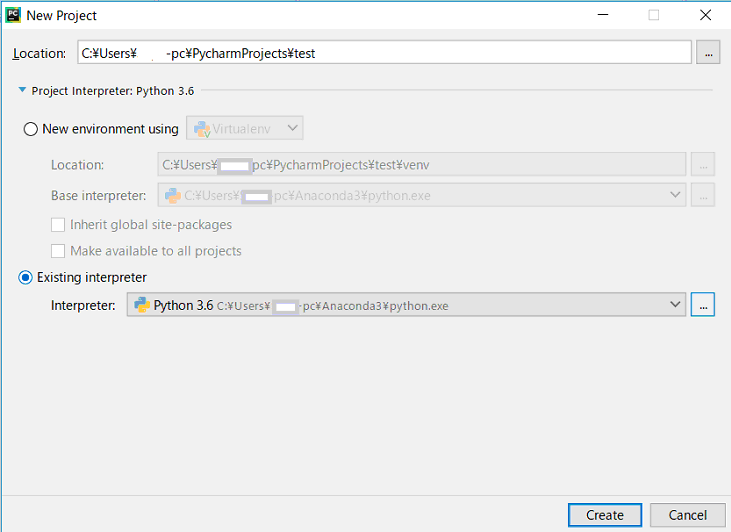
untitledを例えばtestへ、
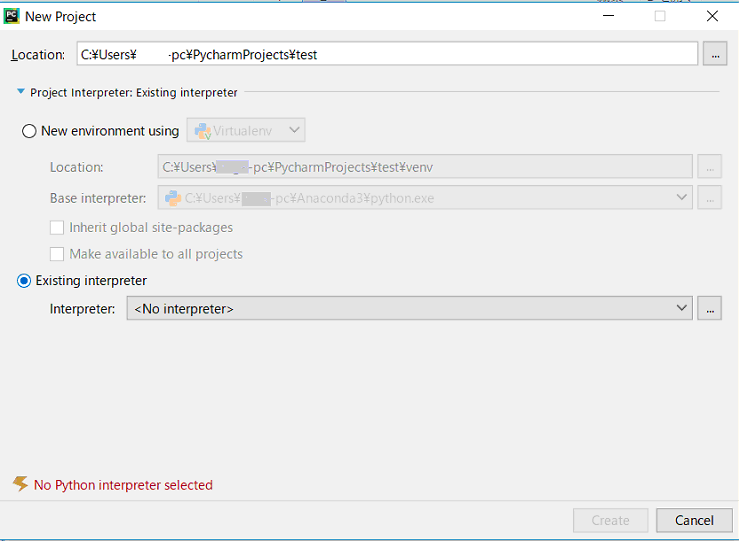
▶Project interpreter: New Virtualenv environment展開
(これ重要)
場合によっては、3つ先の画面ように、Exising interpreterに、
Python.......\Anaconda\Python.exe表示される。この場合は、そこから先に進んでいく。
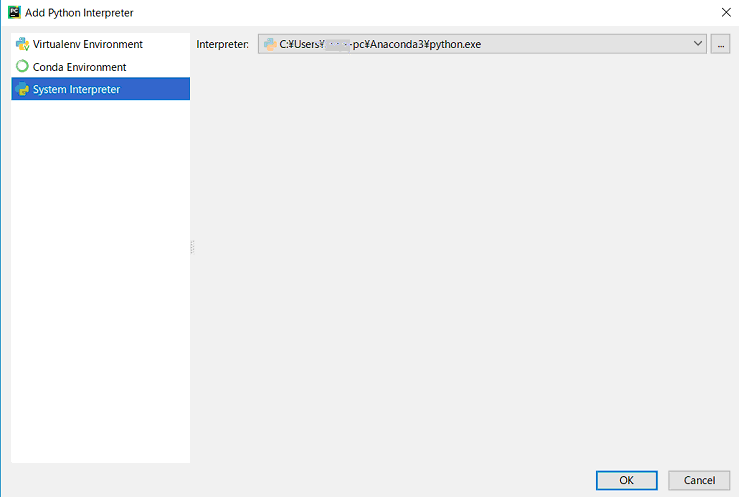
Existing interpreter選択、 Interpreter: 右ボタン …クリック
System Interpreter選択 → Anaconda3\python.exe自動選択される 、OK
Existing interpreterに、Python.......\Anaconda\Python.exe表示 → Create
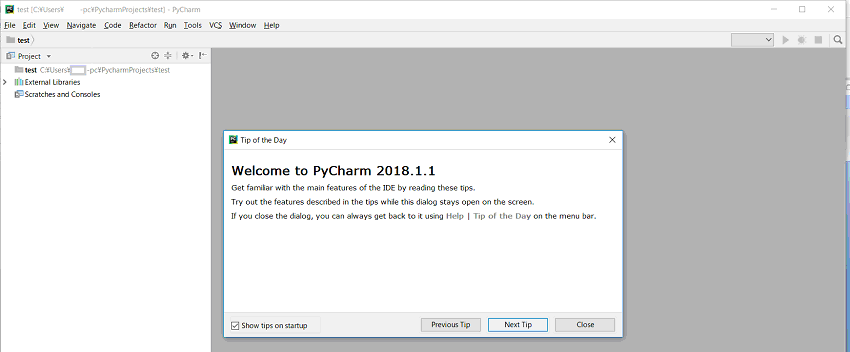
右下Closeクリック
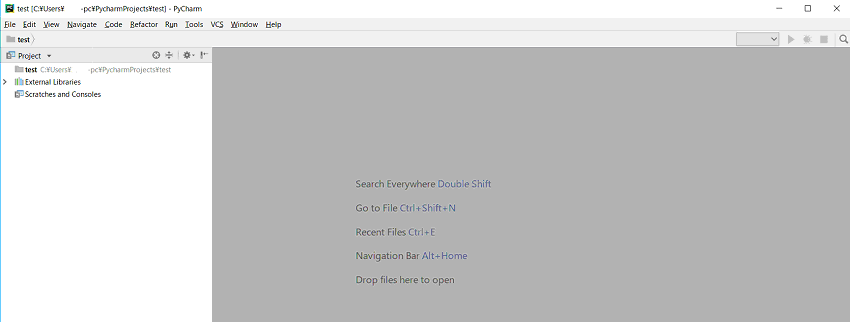
この時点で、いろいろな設定が開始しているようだ。
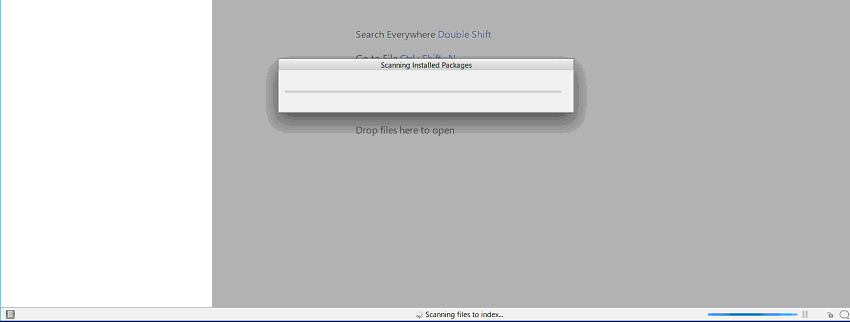
Scanning installed Packagesの表示、
下部ステータスバーに Scanning Files to index….と表示。
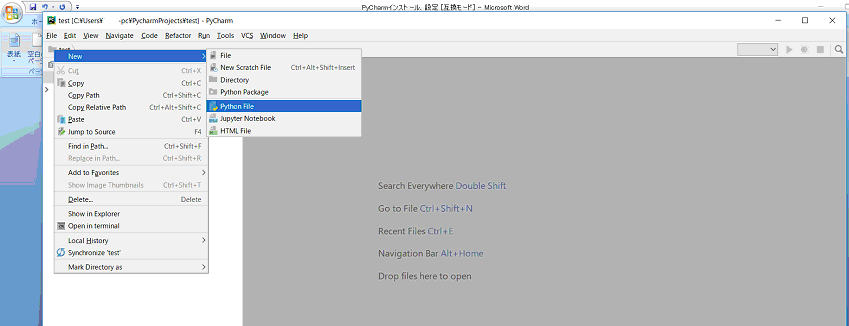
testプロジェクト右クリック、New、Python File
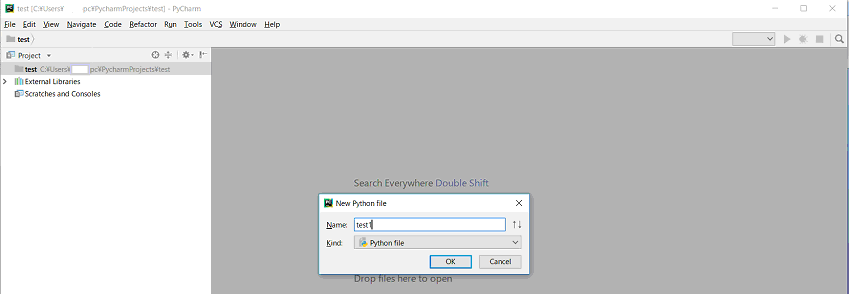
Name: 例えばtest1、OK
test1のコードを記入。
例 #複数のグラフを同一の領域に描画。 sin波とcos波を描画、併せてsy=-1とy=1の直線をhlines関数で描画。
import numpy as np
import matplotlib.pyplot as plt
xmin, xmax = -np.pi, np.pi
x = np.arange(xmin, xmax, 0.1)
y_sin = np.sin(x)
y_cos = np.cos(x)
plt.plot(x, y_sin)
plt.plot(x, y_cos)
plt.hlines([-1, 1], xmin, xmax, linestyles="dashed") # y=-1, 1に破線を描画
plt.title(r"$\sin(x)$ and $\cos(x)$")
plt.xlim(xmin, xmax)
plt.ylim(-1.3, 1.3)
print('グラフ表示')
plt.show()
記入後RUN
Edit Configulations…の表示。まだ設定中の様子。
下部ステータスバーに Indexing…と表示。10分くらい経過、、、
更に、いろいろ設定中。Indexing…から下記に変わった。
ここで再びRUNトライ。test1実行の準備ができたようだ。
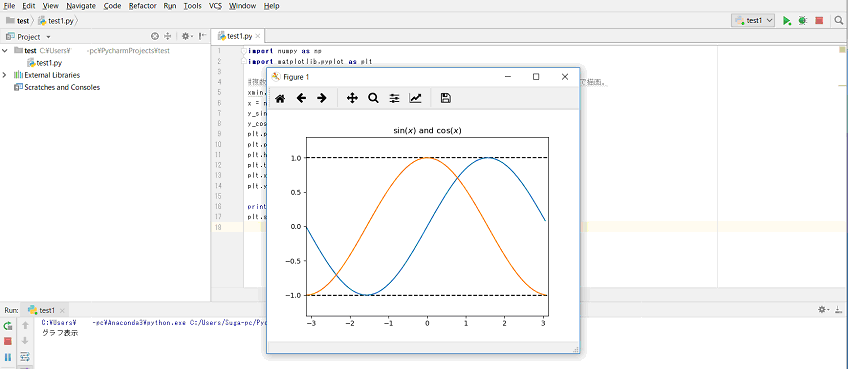
test1クリック → グラフ表示、下部に“グラフ表示”メッセージ。
20分以上経過して漸く終了。PCによってはもっとかかる?
グラフを閉じて、
File>Save Allで作成コード念のため保存。
RUNしたコードは、自動的に保存されているようである。
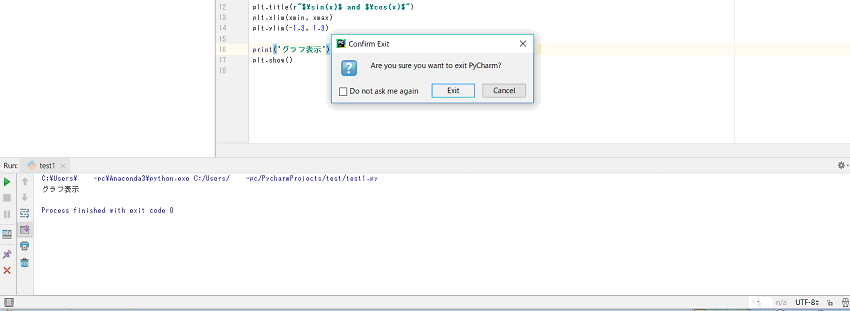
終了は、
File>Exit
まだ何かやっているようなので、cancel待機。
かなり時間が経過して、下部ステータスバー表示が無くなったところで、
再び、File>Exit、準備できたようである。
Exitで終了。
ずいぶん時間がかかるものだ、と嘆息。
PyCharmを再起動してみる。
ステータスバーを見ると、Scanning…Indexing…など表示。しかし短時間で終わる。
よし!
test1コードは、windows(C:)>user>...?pc(コンピューター名)>PycharmProjects>testフォルダーに入っている。
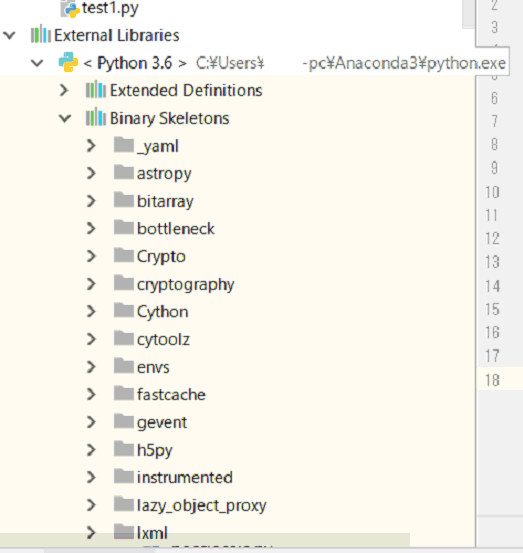
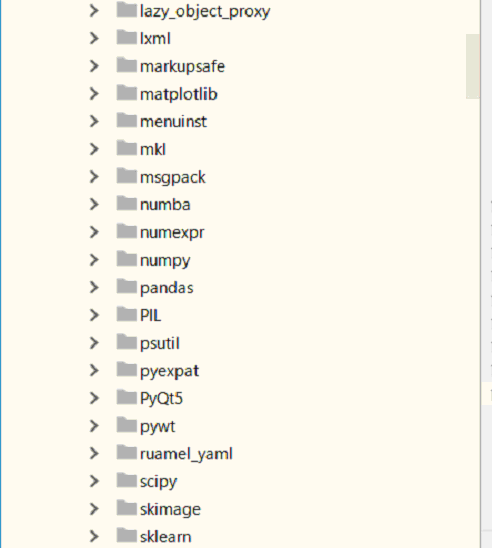
バイナリー スケルトンに何が入っているか、、
matplotlib、numpy、pandasなど入っているのが分かる。
既存の.pyファイル群が
Python-anaconaインストール時に生成された、
C:\user>コンピューター名\Documents\Python Scripts フォルダーに入っている場合、
その呼び出しはどうするか?
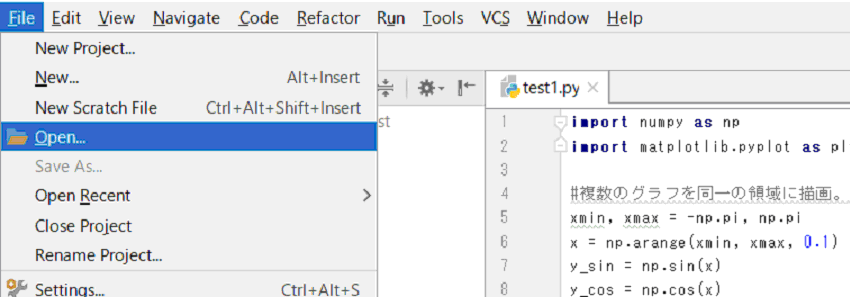
File>Open...から
C:\user..._pc(コンピューター名)\Documents\Python Scripts\を辿って、ターゲットファイルまたはフォルダーを指定。
OK
次回の起動では、
File>Open Recent ...から容易に指定可能である。

