時系列データから特徴量を作成する為のpythonライブラリであるtsfreshのチュートリアルをやってみました
tsfresh
https://tsfresh.readthedocs.io/en/latest/
1. インストール
pipで入ります
pip install tsfresh
2. データの準備
from tsfresh.examples.robot_execution_failures import download_robot_execution_failures, load_robot_execution_failures
download_robot_execution_failures()
timeseries, y = load_robot_execution_failures()
timeseries
サンプルデータはスタックした時系列データになっているようです

IDが3であるデータだけ取り出してみます
import matplotlib.pyplot as plt
timeseries[timeseries['id'] == 3].plot(subplots=True, sharex=True, figsize=(6,12))
plt.show()
 IDが21だとこんな感じ
import matplotlib.pyplot as plt
timeseries[timeseries['id'] == 21].plot(subplots=True, sharex=True, figsize=(6,12))
plt.show()
 見るからに違いますが、これを上手く表現する特徴量にしなければ機械学習に使えませんのでtsfreshにやってもらおうという事ですね
3. 特徴量をつくる
とりあえずブワーッとつくるには以下を実行します
from tsfresh import extract_features
extracted_features = extract_features(timeseries, column_id="id", column_sort="time")
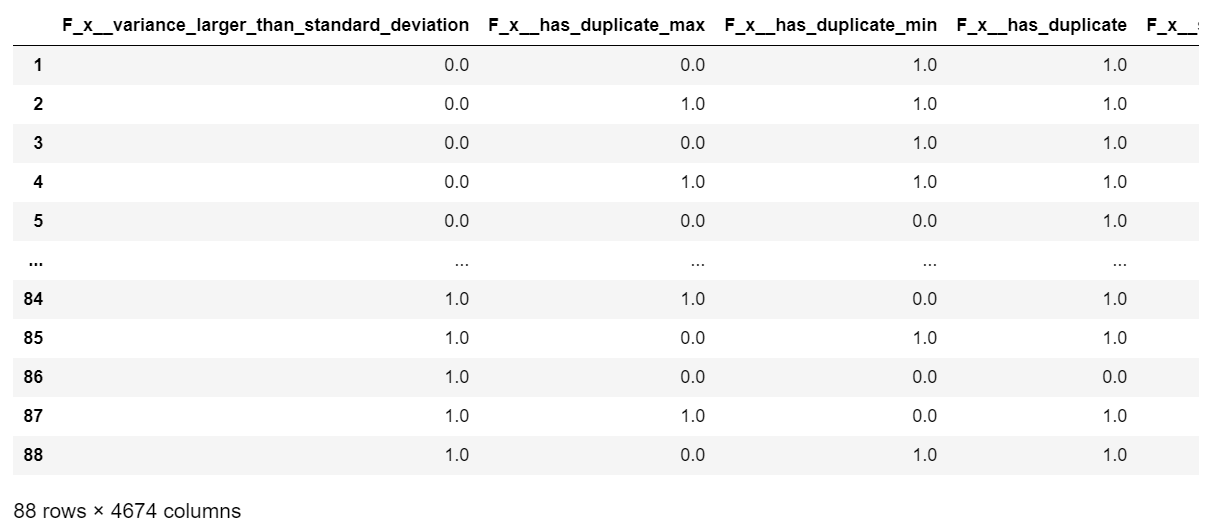
extracted_features
4674特徴量が作成されました。6次元の時系列データからそれぞれ779特徴量作成して、779×6=4674特徴量というわけです。
tsfreshが使用できる特徴量一覧は以下にまとめられています
https://tsfresh.readthedocs.io/en/latest/text/list_of_features.html
特徴量が足りない場合は独自に作成することも出来ます
https://tsfresh.readthedocs.io/en/latest/text/how_to_add_custom_feature.html
4. 不要な特徴量を消す
上記の特徴量には全部同じ値だったり、nanやinfになっている特徴量もたくさんあります。tsfreshにはそれを消す機能が用意されているのでこれを使って消しておきます。
from tsfresh import select_features
from tsfresh.utilities.dataframe_functions import impute
impute(extracted_features)
features_filtered = select_features(extracted_features, y)
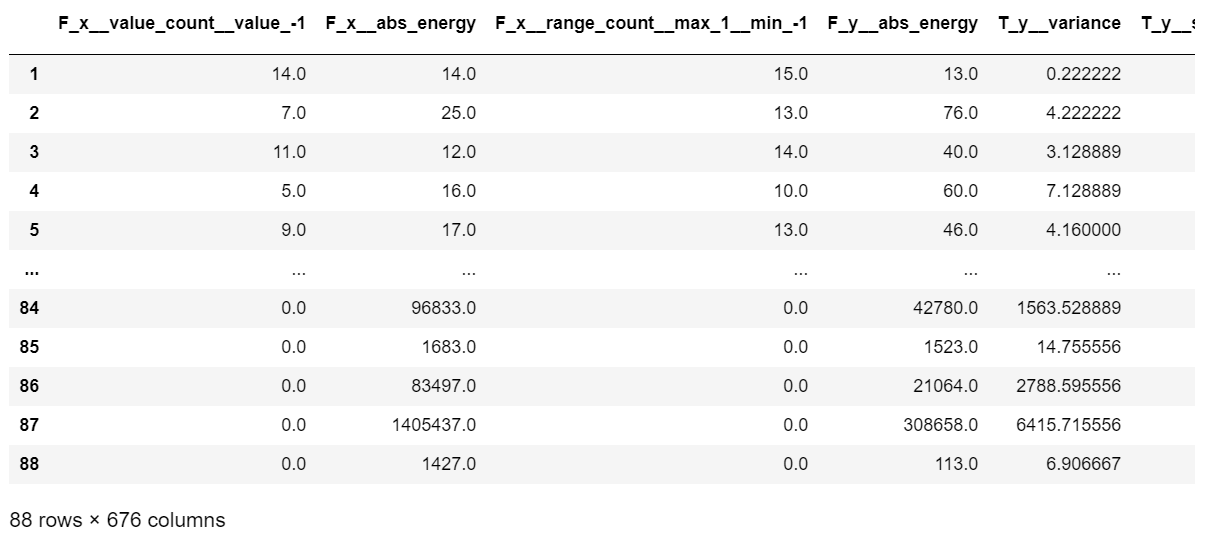
features_filtered
4674特徴量から676特徴量まで減りました
上記の手順を一気にやってしまう関数もあります
from tsfresh import extract_relevant_features

features_filtered_direct = extract_relevant_features(timeseries, y,
                                                     column_id='id', column_sort='time')
features_filtered_direct
5. 入力フォーマット
データ形式
pandas.DataFrame, Dask, PySparkの3つのデータ形式が使用可能ですが、まずはpandas.DataFrameでやるのが良いと思います。
https://tsfresh.readthedocs.io/en/latest/text/large_data.html#large-data-label
データ容量が大きくなると必然的にDaskやPySparkを使うことになります。
https://tsfresh.readthedocs.io/en/latest/text/large_data.html
column typesについて
tsfreshには4つのcolumn typeがあります。
Noneまたはstrで指定します。
| column type | 扱い |
|---|---|
| column_id | ID列として無視されます |
| column_sort | 時系列の並べ替えに使い、特徴量は算出しません |
| column_value | 値として特徴量を算出に使用します |
| column_kind | 後述 |
データの並び
3種類の入れ方があります
https://tsfresh.readthedocs.io/en/latest/text/data_formats.html
1. Flat DataFrame
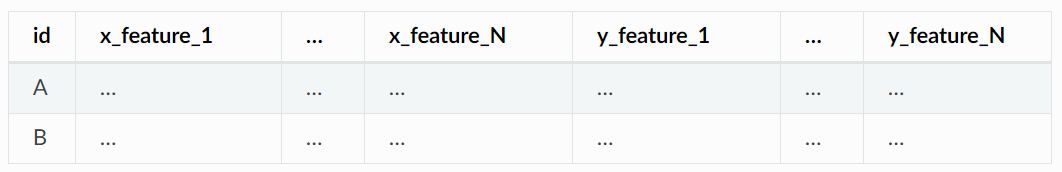
先程使ったデータと同じ並べ方です。下記の場合、idがサンプル名、timeが時間、x, yが特徴量算出の対象となる値となります。
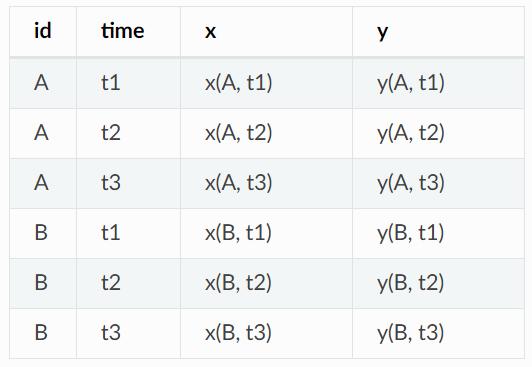
引数の指定方法は以下のようになります
column_id="id", column_sort="time", column_kind=None, column_value=None
2. Stacked DataFrame
上記でx列、y列に分けていたデータを同じ列にまとめて、kind列にxなのかyなのかを書いた並べ方です。
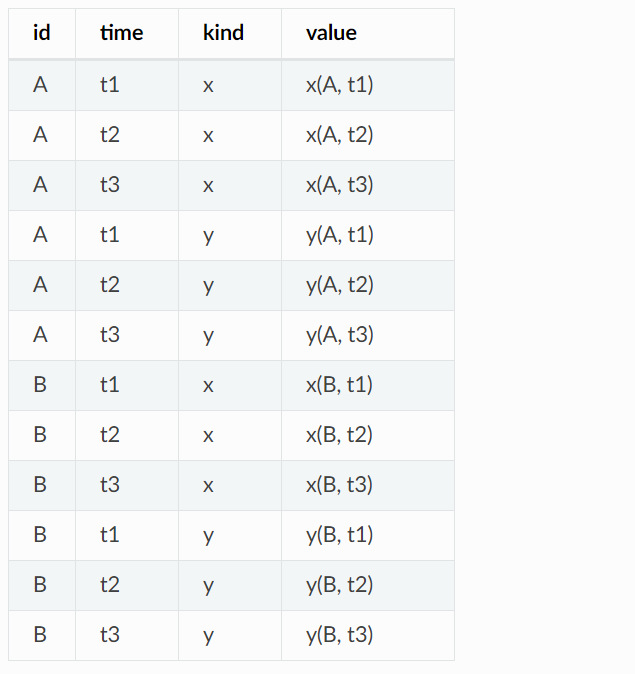
column_kindはこのkind列のような列を指定する為に使用しますので、引数は以下のようになります。
column_id="id", column_sort="time", column_kind="kind", column_value="value"
3. Dictionary of flat DataFrames
x, yを別のDataFrameに分けた並べ方です。

column_id="id", column_sort="time", column_kind=None, column_value="value":
出力
入力が上記3つのどれであっても出力は同じ並べ方で出力されます。
6. 抽出する特徴量を選び手順
新しい機械学習プロジェクトにあたり、当初は色々な特徴量を作っておいて有望なものを特定していき、最終的には必要なものだけ残すという運用が考えられます。このセクションではその流れに沿ったtsfreshの運用方法が紹介されています。
https://tsfresh.readthedocs.io/en/latest/text/feature_extraction_settings.html
6-1. calculate some feature
まず、上でもやっていたようにextract_features()で一般的な特徴量を自動的につくります。
from tsfresh.feature_extraction import ComprehensiveFCParameters
settings = ComprehensiveFCParameters()
# Set here the options of the settings object as shown in the paragraphs below
# ...
from tsfresh.feature_extraction import extract_features
extracted_features = extract_features(timeseries, column_id="id", column_sort="time", default_fc_parameters=settings)
extracted_features
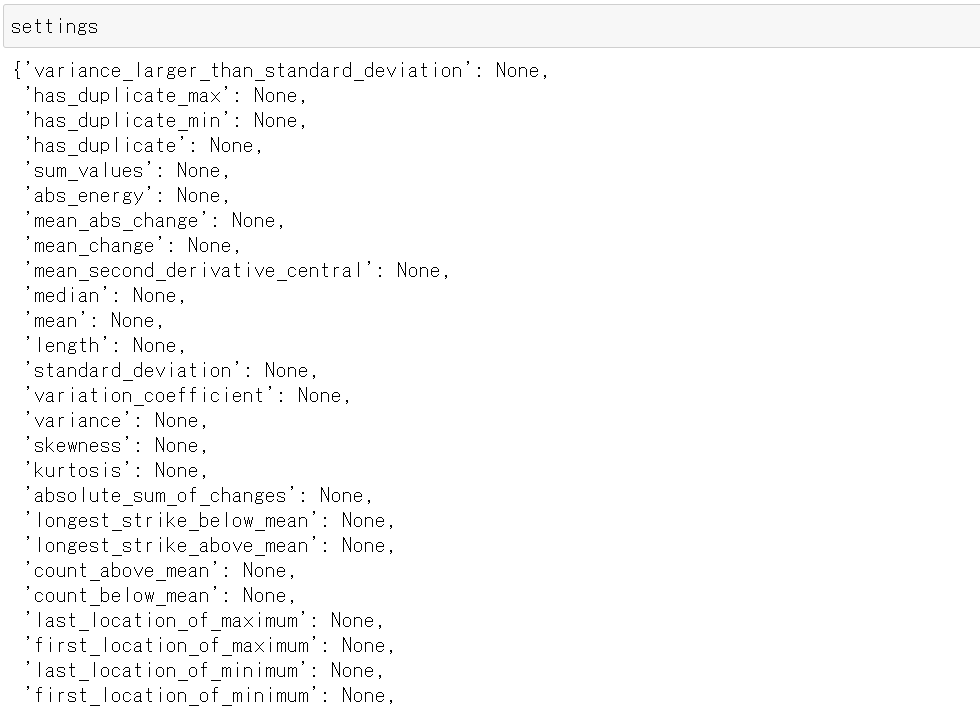
先程とは異なりdefault_fc_parametersにComprehensiveFCParameters()のインスタンスを渡していますが、結果は省略した場合と同じになります。
このComprehensiveFCParameters()インスタンスはtsfresh.feature_extraction.feature_calculators moduleにあるメソッド名をkeyとしたdict型になっていて、当該メソッドの算出条件が記載されています。
6-2. 指定した特徴量のみを作成する
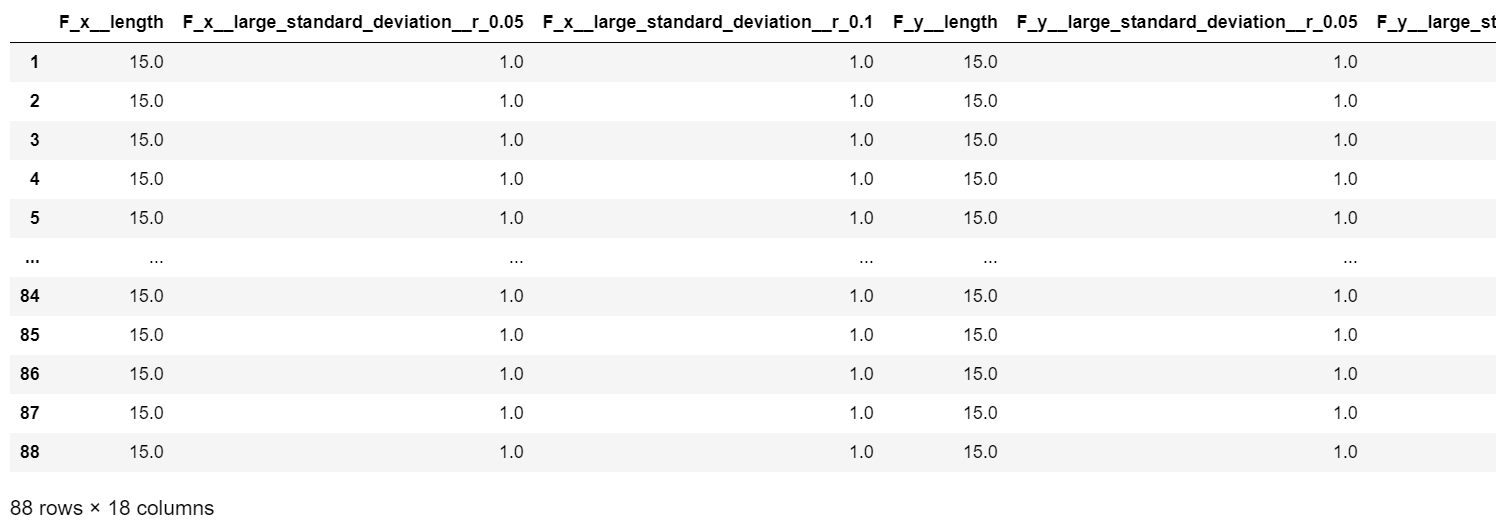
これを例えば以下のようなfc_parametersに変更するとtsfresh.feature_extraction.feature_calculators.length()と、tsfresh.feature_extraction.feature_calculators.large_standard_deviation()をr = 0.05およびr = 0.1として作成した特徴量の合計3つが作成されるという事になります。
fc_parameters = {
    "length": None,
    "large_standard_deviation": [{"r": 0.05}, {"r": 0.1}]
}
extracted_features = extract_features(timeseries, column_id="id", column_sort="time", default_fc_parameters=fc_parameters)
extracted_features
6次元ある入力それぞれについて3つずつ特徴量が作成されたので合計18個の特徴量が得られました。
上記のfc_parametersでlengthが必要ないと分かった場合はこれを消してやることで更に特徴量を絞り込むことができます。
del fc_parameters["length"]

extracted_features = extract_features(timeseries, column_id="id", column_sort="time", default_fc_parameters=fc_parameters)
extracted_features
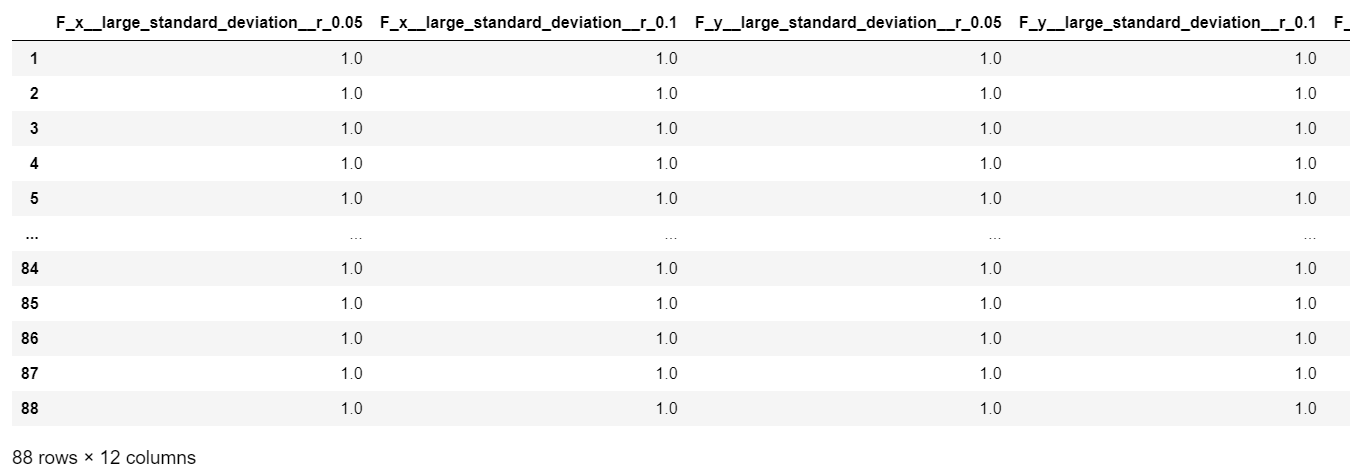
6次元ある入力それぞれについて2つずつ特徴量が作成されたので合計12個の特徴量が得られました。
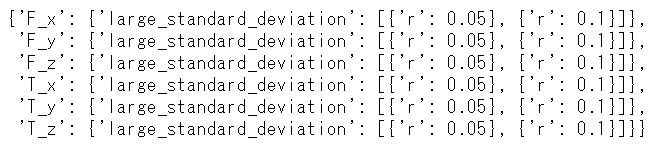
6-3. DataFrameからfc_parametersを作成する
逆にDataFrameからfc_parametersを作ることもできます。
fc_parameters = tsfresh.feature_extraction.settings.from_columns(extracted_features)
fc_parameters
7. 検定による特徴量選択
特徴量と目的変数の間に関連があるか確認する簡易な方法として、検定により評価する関数が用意されています。特徴量と目的変数のそれぞれが2値である場合と連続値である場合の合計4つあります。
https://tsfresh.readthedocs.io/en/latest/api/tsfresh.feature_selection.html#tsfresh.feature_selection.significance_tests.target_binary_feature_binary_test
特徴量を作って2値のものと連続値をとるものを分けておきます
timeseries, y = load_robot_execution_failures()
y.name = 'y'

features = extract_relevant_features(timeseries, y, column_id='id', column_sort='time')

binary_cols = features.columns[features.nunique(axis=0) <= 2]
print('{} columns'.format(len(binary_cols)))
print(binary_cols, '\n')

real_cols = features.columns[features.nunique(axis=0) >= 3]
print('{} columns'.format(len(real_cols)))
print(real_cols, '\n')
7-1. 2値の目的変数と2値の特徴量
特徴量と目的変数を1つずつ選んで食わせるとtwo-sided univariate fisher test (Fisher's exact test?) のp値を返してくれます。カイ2乗検定のサンプル数が少ない版なので、それぞれが関連している場合は帰無仮説が棄却される筈です。
import pandas as pd
import seaborn as sns

for col in binary_cols:
    x = features[col]
    p_value = tsfresh.feature_selection.significance_tests.target_binary_feature_binary_test(x, y)

    df = pd.concat([x, y], axis=1)

    plt.figure(figsize=(4, 4))
    sns.catplot(x='y', y=col, data=df, kind = 'violin')
    plt.title('p value = {:1.5f}'.format(p_value))
    plt.show()
p値が十分に小さいので関連がありそうです
7-2. 2値の目的変数と連続値の特徴量
マン=ホイットニーのU検定またはコルモゴロフ=スミルノフ検定を使って目的変数と特徴量の分布の同一性を対立仮説とした検定を行います。2つの値が関連している場合は同一分布であるとする帰無仮説を棄却できる筈です。
for col in real_cols:
    x = features[col]
    p_value_m = tsfresh.feature_selection.significance_tests.target_binary_feature_real_test(x, y, 'mann')
    p_value_s = tsfresh.feature_selection.significance_tests.target_binary_feature_real_test(x, y, 'smir')

    df = pd.concat([x, y], axis=1)

    plt.figure(figsize=(4, 4))
    sns.catplot(x='y', y=col, data=df, kind = 'violin')
    plt.title('p value(mann) = {:1.5f}, p value(smir) = {:1.5f}'.format(p_value_m, p_value_s))
    plt.show()
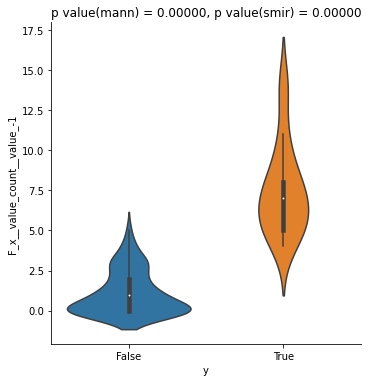
どちらの検定も十分にp値が小さくなっていますので候補に残した方が良さそうです
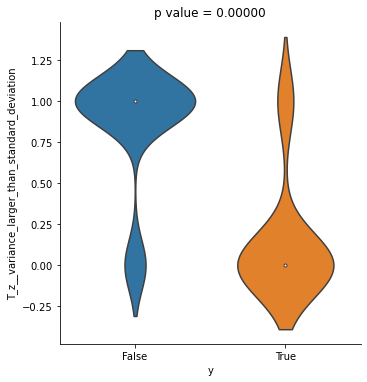
7-3. 連続値の目的変数と2値の特徴量
コルモゴロフ=スミルノフ検定で目的変数と特徴量の分布の同一性を対立仮説とした検定を行います
p_value = tsfresh.feature_selection.significance_tests.target_real_feature_binary_test(x, y)
7-4. 連続値の目的変数と連続値の特徴量
ケンドールの順位相関係数について無相関を対立仮説とする検定により目的変数と特徴量の関連性を評価します
p_value = tsfresh.feature_selection.significance_tests.target_real_feature_real_test(x, y)
8. まとめ
手間をかけずに特徴量エンジニアリングが出来るようにかなり考えて作られていて素晴らしいです。レッツトライ。