インタラクティブなグラフを作れるipywidgetsを試してみたのでまとめます。
公式ドキュメントはここ
https://ipywidgets.readthedocs.io/en/latest/user_guide.html
どんな事ができるか
ipywidgetsに関数を与えると、セレクトボックスとかスライダーの操作で引数を変更しながら関数を実行できるようになります。これを使えばプロットの表示をポチポチ変えていったりできます。
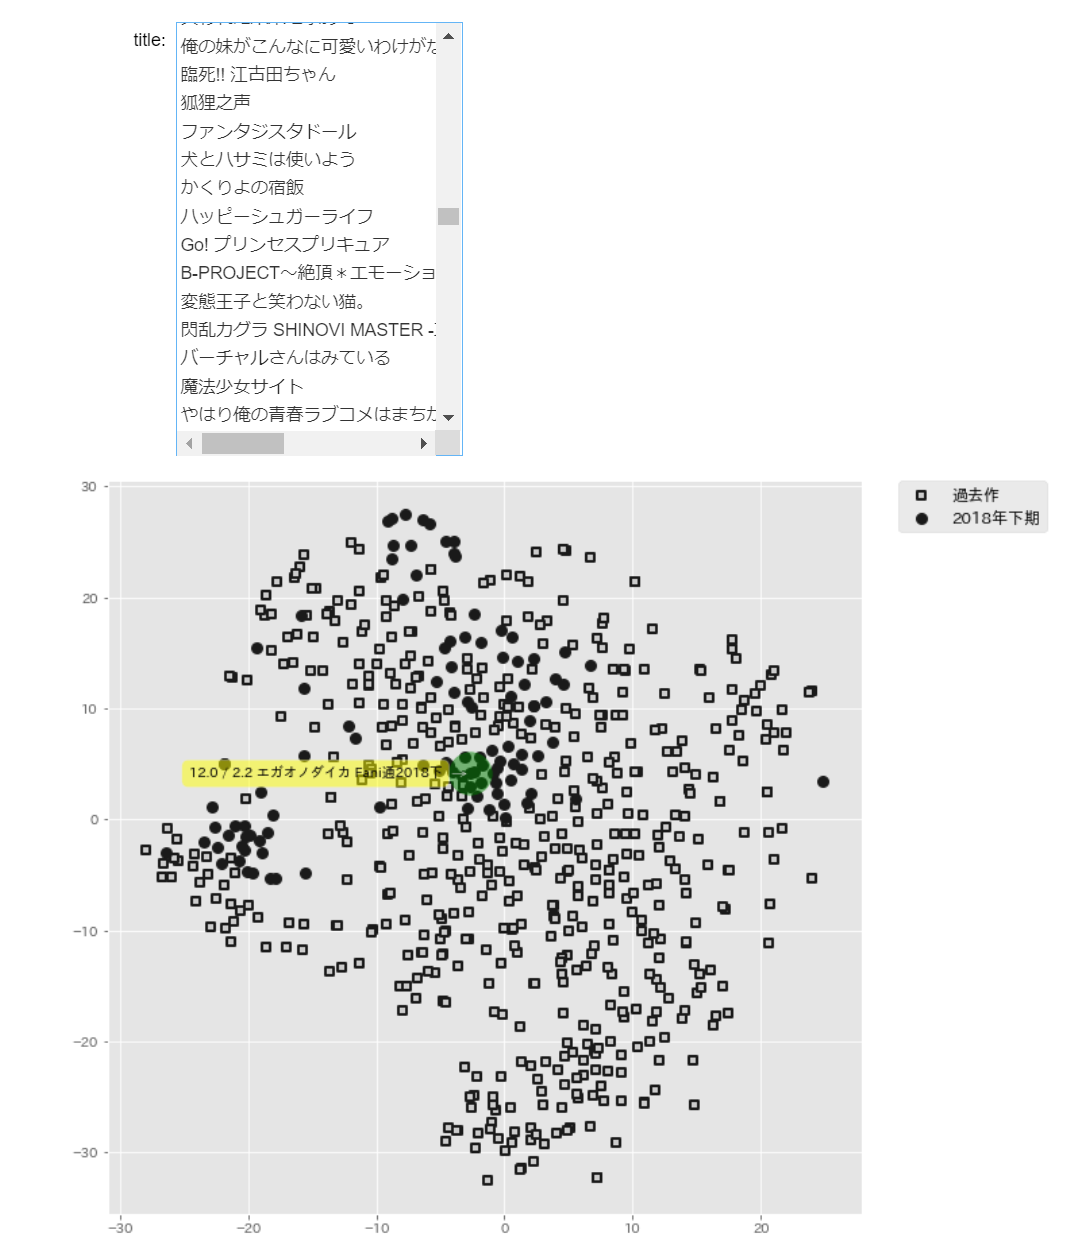
例えば下の画像のようにtsneで2次元化してプロットしたものについてセレクトボックスで選んだサンプルだけ色変え表示させたりできます。
それ以外にもEDAのときにx軸とy軸をセレクトボックスで選びながらプロットするようにしたり、数式のパラメータ変えながらプロットしたりできます。プロット以外にも関数ならなんでも操作できますので色々出来て便利です。
ただし、ipywidgetsは関数を呼ぶだけなので高速に実行したり描画したりはしてくれません。matplotlibでグラフを描く関数を呼ぶようにした場合、毎回グラフをイチから描き直す事になりますのでその分だけ描画は遅いです。インタラクティブなグラフをヌルヌル動かしたいときはbokehなどのインタラクティブ前提のグラフ描画packageを使う必要がありそうです。今回はipywidgets+matplotlib.pyplotのみを扱います。
試行環境
windows10
jupyter notebook
1. 基本的な使い方
widgetをつくってipywidgets.interact()に渡すと操作できるようになります。下の例ではipywidgets.Select()でつくったセレクトボックスをipywidgets.interact()に渡しています。interact()は第1引数の関数に第2以降の引数を渡しますので、以下だとセレクトボックスw1, w2をそれぞれcol1, col2として渡しています。
import numpy as np
import pandas as pd
from sklearn.datasets import load_iris
from ipywidgets import interact, Select
import matplotlib.pyplot as plt
%matplotlib inline

def show_plot(col1, col2):
    plt.figure(figsize=(4.5,4.5))
    plt.scatter(data[col1], data[col2], c=iris.target)
    plt.xlabel('')
    plt.ylabel('')
    plt.show()

iris = load_iris()
data = pd.DataFrame(iris.data, columns=iris.feature_names)

w1 = Select(description='X軸:', options=data.columns, rows=4,)
w2 = Select(description='Y軸:', options=data.columns, rows=4,)
interact(show_plot, col1=w1, col2=w2)
 4列だけだとpair plot描いた方が早いですけど、100列ぐらいあるときはこういうやり方の方がやりやすいと思います。ちなみにセレクトボックスはカーソルキーでも操作できるので大量の選択肢をポチポチ変えていくのがめちゃめちゃ楽です。
2. widgetsいろいろ
ipywidgetsで使用できるwidgetは結構たくさんありますが、グラフに使いやすいのはスライダーとテキストボックスだと思います。数値用のテキストボックスは増減ボタンも付いてるので便利です。使うときは上でやってたみたいにinteract()の第2引数以降に入れて実行します。
・整数用のスライダー
from ipywidgets import IntSlider
IntSlider(value=7, min=0, max=10, step=1, description='Test:',)
・浮動小数点用のスライダー
from ipywidgets import FloatSlider
FloatSlider(value=7.5, min=0, max=10.0, step=0.1,
            description='Test:', readout_format='.1f',)
・テキストボックス
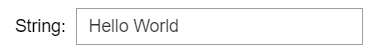
from ipywidgets import Text
Text(value='Hello World', placeholder='Type something', description='String:',)
・整数用のテキストボックス
from ipywidgets import BoundedIntText
BoundedIntText(value=7, min=0, max=10, step=1, description='Text:',)

・浮動小数点用のテキストボックス
from ipywidgets import BoundedFloatText
BoundedFloatText(value=7.5, min=0, max=10.0, step=0.1, description='Text:',)

・ボタン
グラフを動かすには使いにくいですが、ボタンでフラグを立てて動作を変更したりもできます。
from ipywidgets import Button

def test(b):
    print('click!')

w = Button(description='Click me', button_style='',
           tooltip='Click me', icon='check')
w.on_click(test)
display(w)
他にも色々ありますので詳しくは公式ドキュメントを参照してください
https://ipywidgets.readthedocs.io/en/latest/examples/Widget%20List.html
3. 形を整える
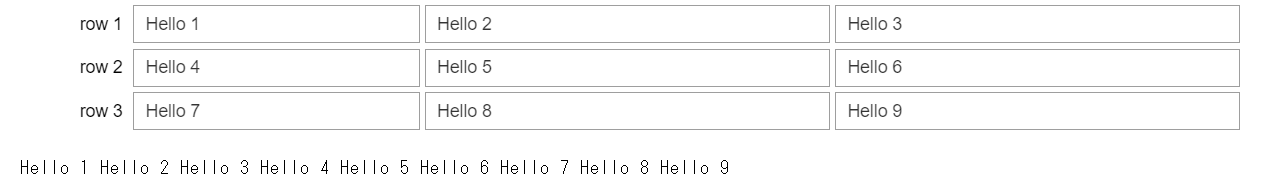
複数のwidgetを縦横に並べて表示することができます。list型にしてHBoxの引数に与えると横に並べ、VBoxに与えると縦に並べてくれるんですが、最初に使ったipywidgets.interact()はHBoxやVBoxを処理できません。じゃあどうすれば良いかというとHBox, VBoxで表示方法を定義しておいて、ipywidgets.interactive_output()に実行方法を定義し、最期にこの2つを同時にdisplay()するというやり方をするようです。なんかややこしいですね。
参考
https://stackoverflow.com/questions/39397759/how-to-use-interactive-with-a-box-containing-widgets
from ipywidgets import interactive_output

t1 = Text(value='Hello 1', description='row 1')
t2 = Text(value='Hello 2', description='')
t3 = Text(value='Hello 3', description='')
t4 = Text(value='Hello 4', description='row 2')
t5 = Text(value='Hello 5', description='')
t6 = Text(value='Hello 6', description='')
t7 = Text(value='Hello 7', description='row 3')
t8 = Text(value='Hello 8', description='')
t9 = Text(value='Hello 9', description='')

def foo(p1,p2,p3,p4,p5,p6,p7,p8,p9):
    print(p1,p2,p3,p4,p5,p6,p7,p8,p9)

out = interactive_output(foo, {"p1":t1, "p2":t2, "p3":t3, "p4":t4, "p5":t5, "p6":t6, "p7":t7, "p8":t8, "p9":t9})
hbox1 = HBox([t1, t2, t3])
hbox2 = HBox([t4, t5, t6])
hbox3 = HBox([t7, t8, t9])
ui = VBox([hbox1, hbox2, hbox3])

display(ui, out)
HBox, VBoxの使い方はこの辺を読むと良さげ
https://ipywidgets.readthedocs.io/en/latest/examples/Widget%20Styling.html
https://www.programcreek.com/python/example/90666/ipywidgets.HBox
4. 複数のwidgetを同期させたり自動で動かしたり
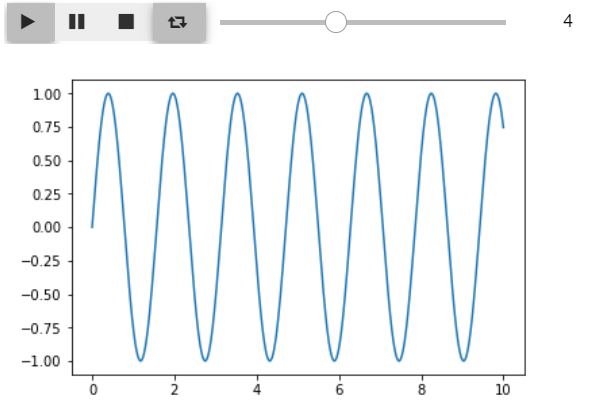
ipywidgets.jslink()を使うと2つのwidgetについて、片方への変更がもう一方に反映されるようにすることが出来ます。例えば下のようにipywidgets.Play()とipywidgets.IntSlider()を同期させてHBoxで横に並べると動画再生の進行バーのようなものが作れます。
これとinteractive_output()を使ってグラフ描画を行えば自動でパラメータを変えながら描画するグラフを作れます。なおグラフのコードは以下を参考にしました。
https://qiita.com/ground0state/items/58a576cf09a56a0dd425
%matplotlib inline
import numpy as np
import matplotlib.pyplot as plt
from ipywidgets import Play, IntSlider, jslink, HBox, interactive_output
import time

def f(k):
    y = np.sin(k*x)
    plt.plot(x, y)
    plt.show()

x = np.linspace(0, 10, num=1000)

play = Play(value=1, min=0, max=10, step=1, interval=1500, description="Press play",)
slider = IntSlider(min=0, max=10)
jslink((play, 'value'), (slider, 'value'))
ui = HBox([play, slider])
out = interactive_output(f, {'k': slider})
display(ui, out)