はじめに
Garminなどで計測したデータをフルに活用するには、fitファイルとして出力されたデータを解析する必要があります。hiking時のデータを事例にfit形式ファイルを解析する方法をまとめました。
1. fitparseライブラリをインストールする
!pip install fitparse
import numpy as np
import pandas as pd
import plotly.express as px
import plotly.graph_objects as go
from plotly.subplots import make_subplots
import os
import fitparse
2. fit形式ファイルを読み込む
fitfile = fitparse.FitFile("./xxxxxx/xxxxxx_ACTIVITY.fit")
fitdata=[]
for record in fitfile.get_messages("record"):
    for data in record:
        if data.units:
            fitdata+=[[data.name, data.value, data.units]]
        else:
            fitdata+=[[data.name, data.value, 'NaN']]
3. ファイルの中身を確認する
df1=pd.DataFrame(fitdata)
df1.columns=['item','value','unit']
df1
表示例
| item | value | unit | |
|---|---|---|---|
| 0 | altitude | 328.2 | m |
| 1 | cadence | 0 | rpm |
| 2 | distance | 0.0 | m |
| 3 | enhanced_altitude | 328.2 | m |
| 4 | enhanced_speed | 0.0 | m/s |
| 5 | fractional_cadence | 0.0 | rpm |
| 6 | heart_rate | 92 | bpm |
| 7 | position_lat | None | semicircles |
| 8 | position_long | None | semicircles |
| 9 | speed | 0.0 | m/s |
| 10 | temperature | 30 | C |
| 11 | timestamp | 2021-07-28 06:03:02 | NaN |
| 12 | unknown_87 | 0 | NaN |
| 13 | unknown_88 | 100 | NaN |
| 14 | altitude | 328.2 | m |
4. 不要な項目を削除する
df1['item'].value_counts()
temperature           1015
unknown_88            1015
fractional_cadence    1015
altitude              1015
enhanced_speed        1015
heart_rate            1015
cadence               1015
position_lat          1015
distance              1015
timestamp             1015
speed                 1015
unknown_87            1015
position_long         1015
enhanced_altitude     1015
unknown_90             865
Name: item, dtype: int64
drop=[]
drop+=df1[df1['item']=='unknown_90'].index.tolist()
drop+=df1[df1['item']=='unknown_88'].index.tolist()
drop+=df1[df1['item']=='unknown_87'].index.tolist()
drop2=sorted(set(drop))
df2=df1.drop(index=df1.index[drop2]).reset_index(drop=True)
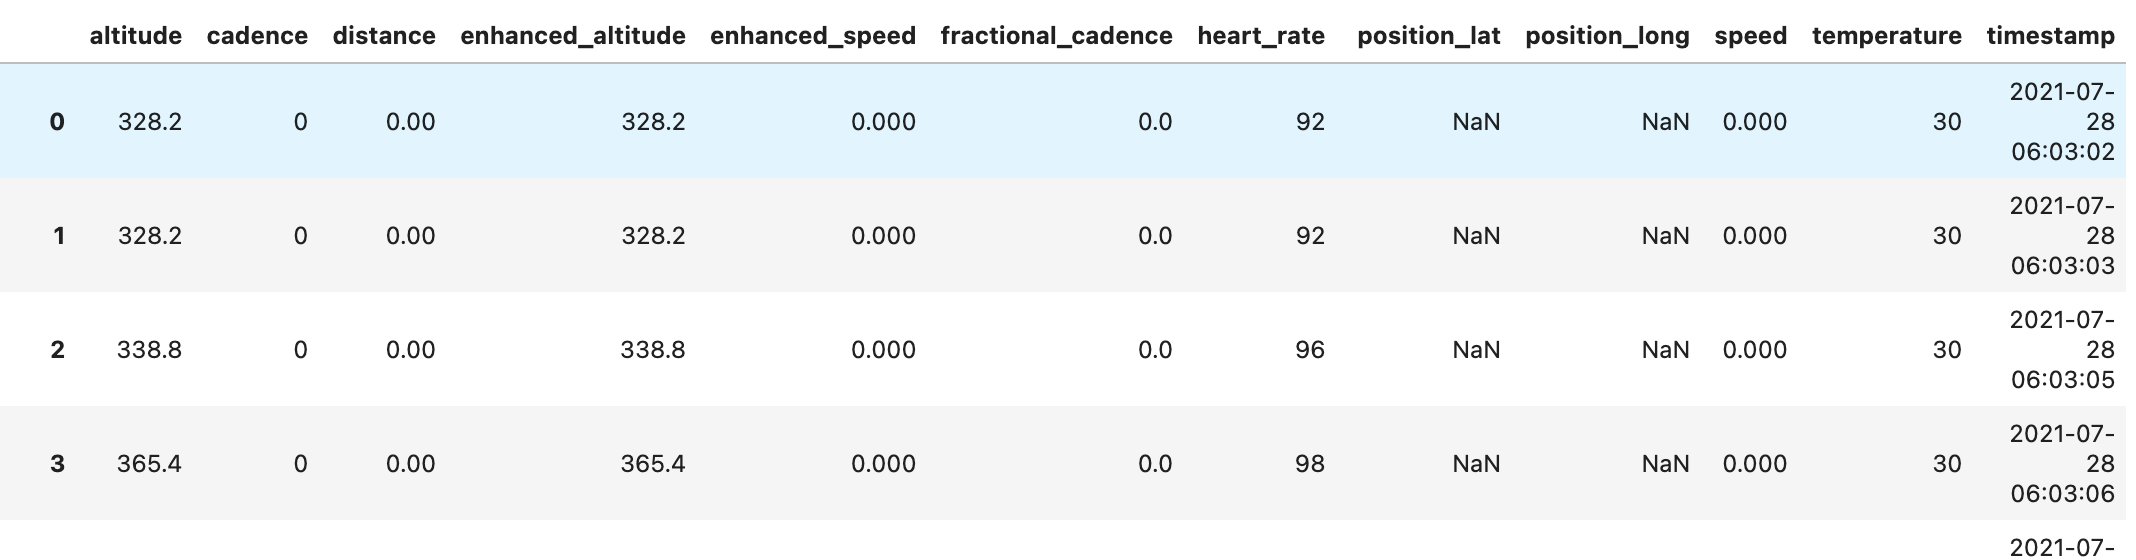
5. 項目名をカラム名にしたテーブルに変換する
items2=df2['item'].unique().tolist()
df3=pd.DataFrame(columns=items2,index=range(len(df2)//len(items2)))
for item in items2:
    df3[item]=df2[df2['item']==item]['value'].tolist()
表示例
Semicircle単位の緯度、経度を度に直すには、以下の式で変換します。地図上にルート表示する場合などに使用します。
df3['latitude']=df3['position_lat']*(180/2**31)
df3['longitude']=df3['position_long']*(180/2**31)
df4=df3[['timestamp','latitude','longitude','altitude','speed','heart_rate']]
6. グラフ化する
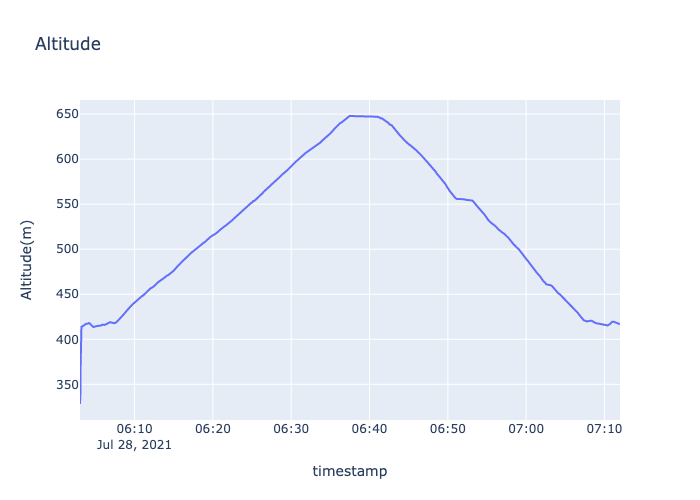
fig=make_subplots(specs=[[{"secondary_y":False}]])
fig.add_trace(go.Scatter(x=df4['timestamp'],y=df4['altitude'],name='Altitude'),secondary_y=False,)
fig.update_layout(autosize=False,width=700,height=500,title_text="Altitude")
fig.update_xaxes(title_text="timestamp")
fig.update_yaxes(title_text="Altitude(m)",secondary_y=False)
fig.show()
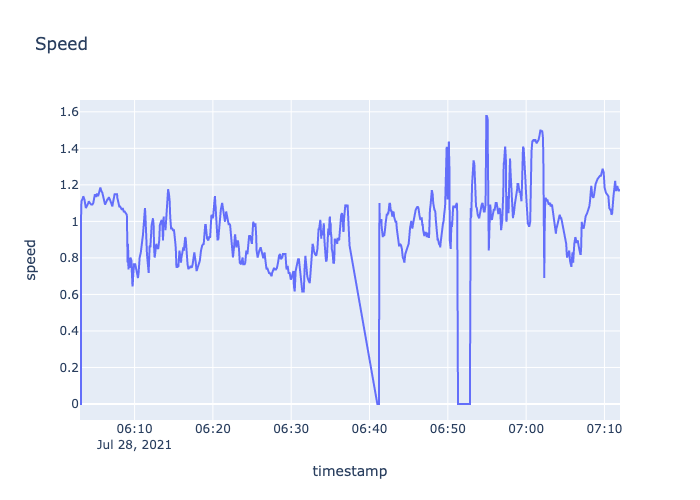
fig=make_subplots(specs=[[{"secondary_y":False}]])
fig.add_trace(go.Scatter(x=df4['timestamp'],y=df4['speed'],name='speed'),secondary_y=False,)
fig.update_layout(autosize=False,width=700,height=500,title_text="Speed")
fig.update_xaxes(title_text="timestamp")
fig.update_yaxes(title_text="speed",secondary_y=False)
fig.show()
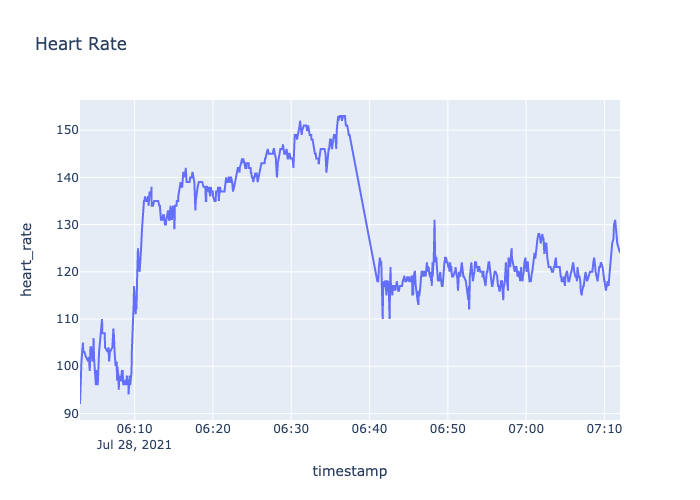
fig=make_subplots(specs=[[{"secondary_y":False}]])
fig.add_trace(go.Scatter(x=df4['timestamp'],y=df4['heart_rate'],name='heart_rate'),secondary_y=False,)
fig.update_layout(autosize=False,width=700,height=500,title_text="Heart Rate")
fig.update_xaxes(title_text="timestamp")
fig.update_yaxes(title_text="heart_rate",secondary_y=False)
fig.show()