モチベーション
Pandasで読み込んだテーブルの中の数値の列に対しては、histメソッドですべての列をヒストグラムで表示できますよね。一方でカテゴリ変数はちょっと面倒だなと感じたので、もろもろを一発で表示してくれる関数を実装しました。実は簡単にやる方法があるのかもと思いつつも投稿します。
ソースコード
以下が実装した機能の本体です。
import matplotlib.pyplot as plt
import pandas as pd

def histgram(df, bins=20, ignore_columns=[], fontsize=18):
    nulls = df.isnull().sum()

    for column in df:
        if column in ignore_columns:
            continue

        column_type = str(df.dtypes[column])
        fig = plt.figure(figsize=[15, 4])
        ax = fig.add_subplot(111)

        if "int" in column_type or "float" in column_type:
            df[column].hist(bins=bins, color="#44ff89")
        else:
            df[column].value_counts().plot(kind="bar")

        plt.title(column, fontsize=fontsize)
        plt.tick_params(labelsize=fontsize)
        plt.grid(False)
        ax.yaxis.grid(linestyle='--', lw=1, alpha=0.4, color='lightgray')
        plt.show()
        print("The number of nulls in {} is {}.".format(column, nulls[column]))
以下のようなdfというDataFrameがあったときに、histgram(df, ignore_columns=["D"])のような形で呼び出します。ignore_columnsに指定したカラム名は表示するときに無視します。idなどを示した列はこれに指定しましょう。
df = pd.DataFrame({"A": [1,1,2,2,2,3],
                   "B": ["katsuo", "tarao", "wakame", "tarao", "tarao", "wakame"],
                   "C": [1,1,1,2, np.nan, np.nan],
                   "D": [1,2,3,4,5,6]})
histgram(df, ignore_columns=["D"])
上記の実行結果は以下の通り。
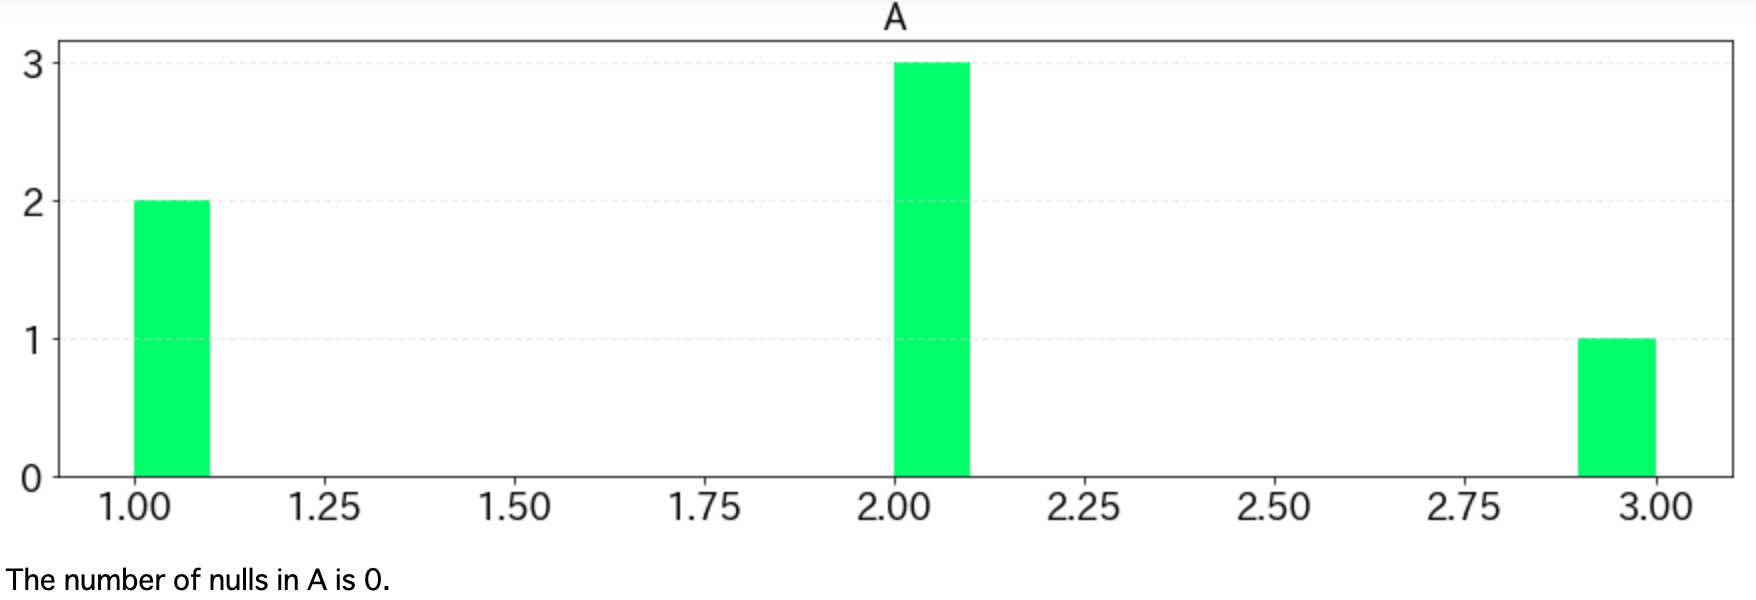
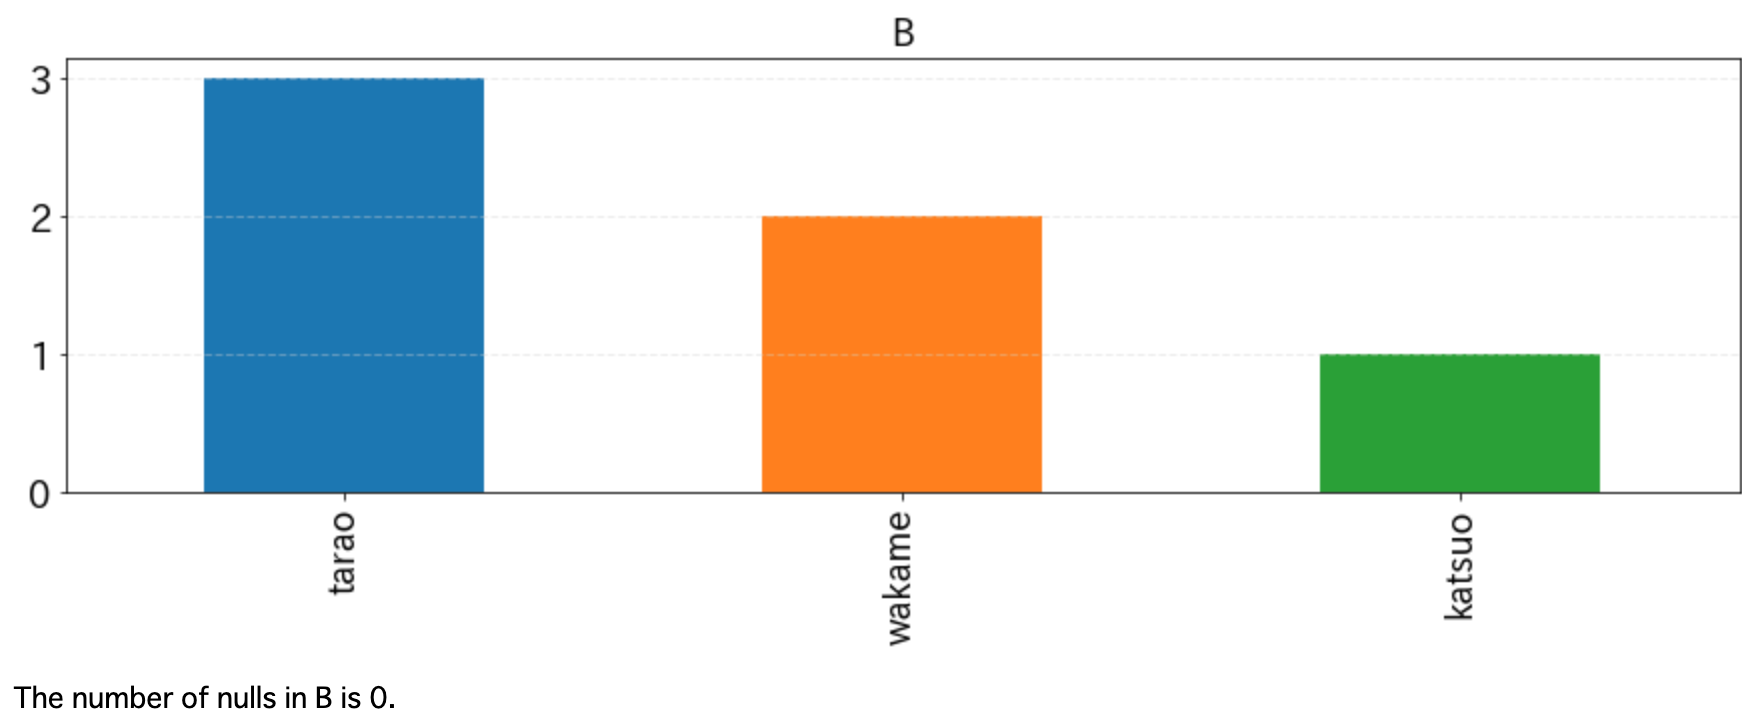
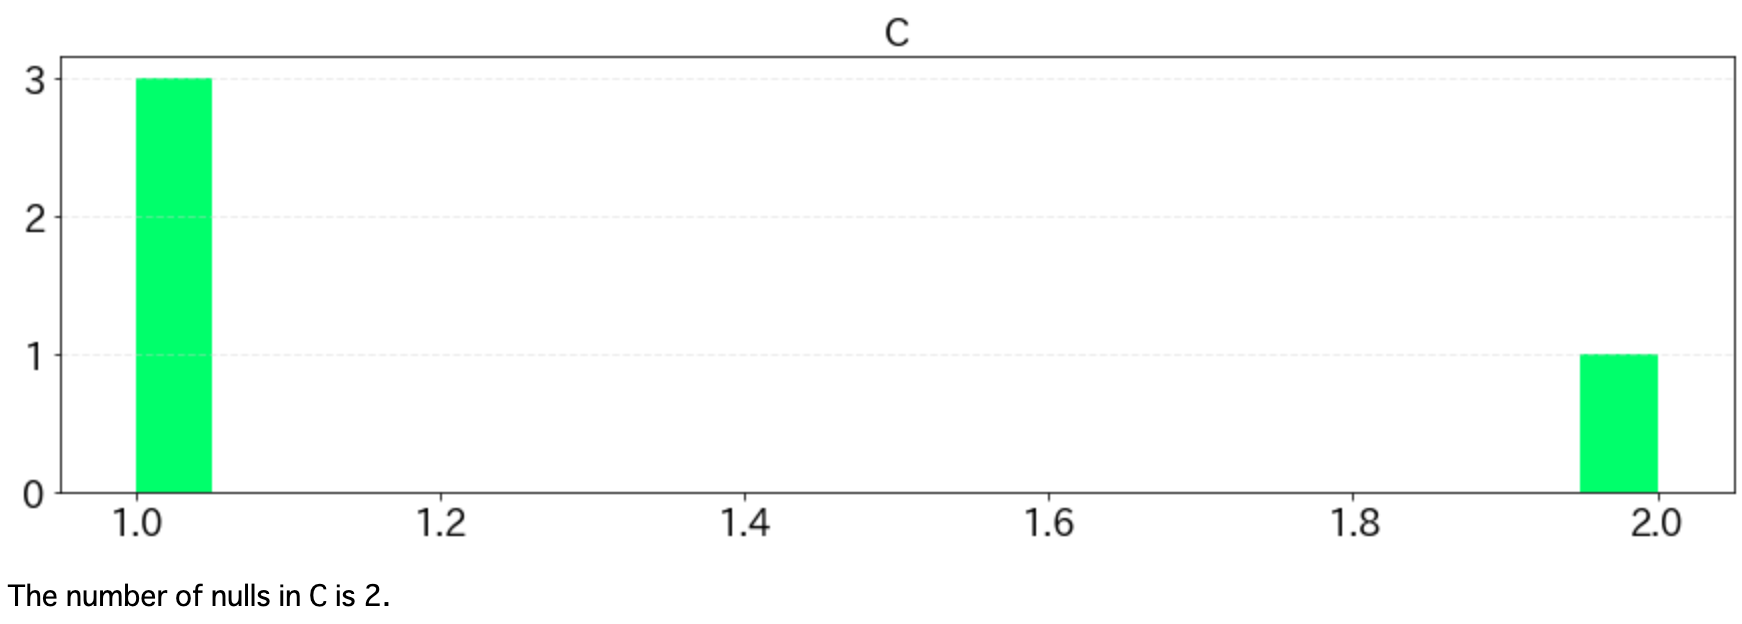
DataFrameに含まれるNaNの数も欲しくなるので、ヒストグラムの下に出力しています。