SIGNATEのお弁当コンペやった時のコードの抜粋
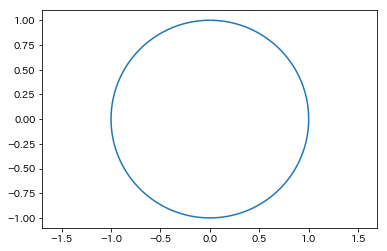
日付を1~365に変換した後にsin,cosに分解
テストデータをpandasで生成後、matplotlibでグラフ上に変換した結果を描画しています。
import pandas as pd
import numpy as np
import math


def convert_cos(x):
    #return np.cos(math.radians(x / 365))
    return np.cos(math.radians(90 - (x / 365)*360))

def convert_sin(x):
    #return np.cos(math.radians(x / 365))
    return np.sin(math.radians(90 - (x / 365)*360))

def datetime_extract(df,df_col='datetime'):

    df['cos_day']=df[df_col].dt.dayofyear
    df['cos_day'] =df['cos_day'].apply(convert_cos)
    df['sin_day']=df[df_col].dt.dayofyear
    df['sin_day'] =df['sin_day'].apply(convert_sin)

    return df
days =pd.date_range(start='2019/1/1', end='2019/12/31', freq='D')
df = pd.DataFrame(days,columns=["date"])
df.head()
| date | |
|---|---|
| 0 | 2019-01-01 |
| 1 | 2019-01-02 |
| 2 | 2019-01-03 |
| 3 | 2019-01-04 |
| 4 | 2019-01-05 |
df.info()
<class 'pandas.core.frame.DataFrame'>
RangeIndex: 365 entries, 0 to 364
Data columns (total 1 columns):
date    365 non-null datetime64[ns]
dtypes: datetime64[ns](1)
memory usage: 2.9 KB
df = datetime_extract(df,df_col="date")
df.head()
| date | cos_day | sin_day | |
|---|---|---|---|
| 0 | 2019-01-01 | 0.017213 | 0.999852 |
| 1 | 2019-01-02 | 0.034422 | 0.999407 |
| 2 | 2019-01-03 | 0.051620 | 0.998667 |
| 3 | 2019-01-04 | 0.068802 | 0.997630 |
| 4 | 2019-01-05 | 0.085965 | 0.996298 |
import matplotlib.pyplot as plt
plt.axes().set_aspect('equal', 'datalim')
plt.plot(df.cos_day,df.sin_day)
plt.show()
kaggler-ja にwakameさんの実装例ありました。
KaggleのKernelだとここ
